| Param | Original file | Final file |
|---|---|---|
| Filename | modeM0/AS1A10_048T03_9000004154_28959cztM0_level2.evt | modeM0/AS1A10_048T03_9000004154_28959cztM0_level2_quad_clean.evt |
| Size (bytes) | 836,291,520 | 133,444,800 |
| Size | 797.5 MB | 127.3 MB |
| Events in quadrant A | 5,053,164 | 838,395 |
| Events in quadrant B | 5,866,616 | 849,295 |
| Events in quadrant C | 5,247,744 | 820,184 |
| Events in quadrant D | 8,440,450 | 797,106 |
| Mode M9 | |||
|---|---|---|---|
| Quadrant | BADHDUFLAG | Total packets | Discarded packets |
| A | 0 | 18 | 0 |
| B | 0 | 18 | 0 |
| C | 0 | 18 | 0 |
| D | 0 | 18 | 0 |
| Mode M0 | |||
|---|---|---|---|
| Quadrant | BADHDUFLAG | Total packets | Discarded packets |
| A | 0 | 22051 | 2 |
| B | 0 | 24297 | 2 |
| C | 0 | 22293 | 2 |
| D | 0 | 32396 | 2 |
| Mode SS | |||
|---|---|---|---|
| Quadrant | BADHDUFLAG | Total packets | Discarded packets |
| A | 0 | 216 | 0 |
| B | 0 | 216 | 0 |
| C | 0 | 216 | 0 |
| D | 0 | 216 | 0 |
| Quadrant | Total seconds | Saturated seconds | Saturation percentage |
|---|---|---|---|
| A | 10635 | 94 | 0.883874% |
| B | 10636 | 364 | 3.422339% |
| C | 10636 | 279 | 2.623167% |
| D | 10636 | 427 | 4.014667% |
Noise dominated data is calculated using 1-second bins in cleaned event files. If a bin has >2000 counts, and if more than 50% of those come from <1% of pixels, then it is considered to be noise-dominated and hence unusable.
| Quadrant | # 1 sec bins | Bins with >0 counts | Bins with >2000 counts | High rate bins dominated by noise | Noise dominated (total time) | Noise dominated (detector-on time) | Marked lightcurve |
|---|---|---|---|---|---|---|---|
| A | 12360 | 10637 | 0 | 0 | 0.00% | 0.00% |  |
| B | 12361 | 10638 | 197 | 197 | 1.59% | 1.85% |  |
| C | 12361 | 10638 | 0 | 0 | 0.00% | 0.00% |  |
| D | 12361 | 10638 | 282 | 282 | 2.28% | 2.65% |  |
Top three noisy pixels from each quadrant. If the there are fewer than three noisy pixels in the level2.evt file, extra rows are filled as -1
| Pixel properties | Quadrant properties | ||||||
|---|---|---|---|---|---|---|---|
| Quadrant | DetID | PixID | Counts | Sigma | Mean | Median | Sigma |
| A | 13 | 254 | 19988 | 71.47 | 1300 | 1271 | 261.9 |
| A | 1 | 113 | 15325 | 53.67 | 1300 | 1271 | 261.9 |
| A | 3 | 137 | 13207 | 45.58 | 1300 | 1271 | 261.9 |
| B | 10 | 245 | 732906 | 2990.56 | 1280 | 1250 | 244.7 |
| B | 0 | 229 | 53019 | 211.6 | 1280 | 1250 | 244.7 |
| B | 12 | 111 | 30918 | 121.26 | 1280 | 1250 | 244.7 |
| C | 14 | 238 | 252784 | 854.82 | 1249 | 1258 | 294.2 |
| C | 14 | 254 | 78119 | 261.21 | 1249 | 1258 | 294.2 |
| C | 2 | 114 | 25541 | 82.53 | 1249 | 1258 | 294.2 |
| D | 8 | 195 | 1830524 | 6117.79 | 1250 | 1217 | 299.0 |
| D | 1 | 52 | 1260535 | 4211.56 | 1250 | 1217 | 299.0 |
| D | 5 | 233 | 480045 | 1601.35 | 1250 | 1217 | 299.0 |
Histogram calculated using DETX and DETY for each event in the final _common_clean file
| Quadrant A |  |
 |
Quadrant B |
|---|---|---|---|
| Quadrant D |  |
 |
Quadrant C |
| Plot type | Count rate plots | Images |
|---|---|---|
| Comparison with Poisson distribution Blue bars denote a histogram of data divided into 1 sec bins. Red curve is a Poisson curve with rate = median count rate of data. |
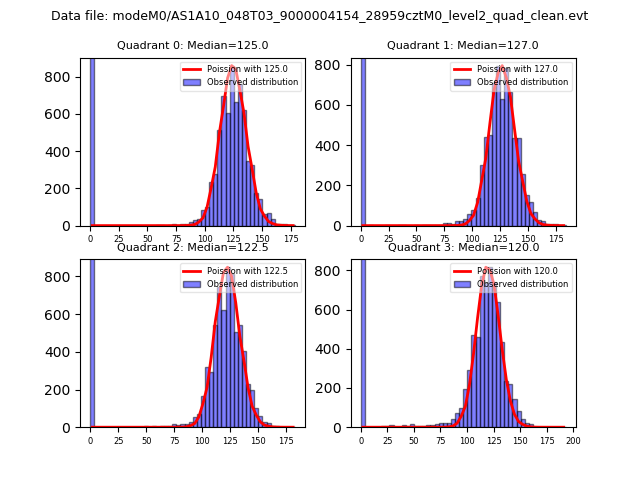 |
 |
| Quadrant-wise count rates Data is divided into 100 sec bins |
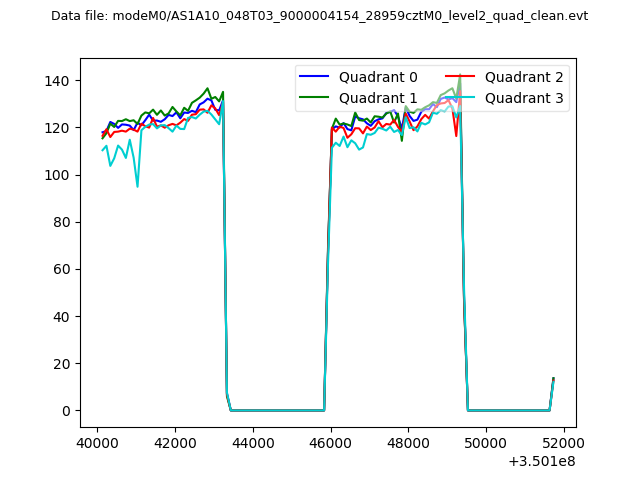 |
|
| Module-wise count rates for Quadrant A Data is divided into 100 sec bins |
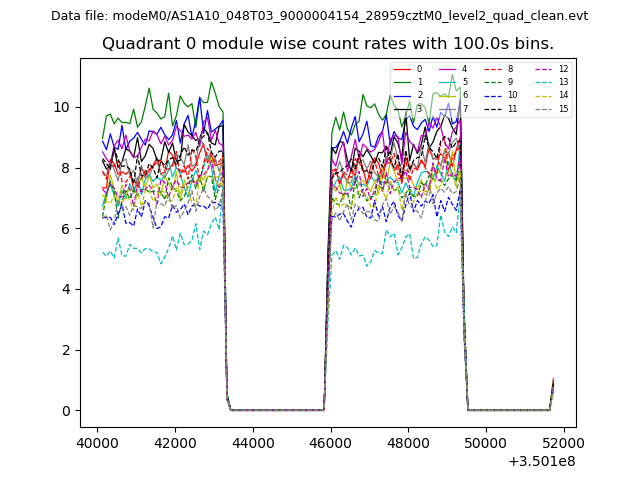 |
 |
| Module-wise count rates for Quadrant B Data is divided into 100 sec bins |
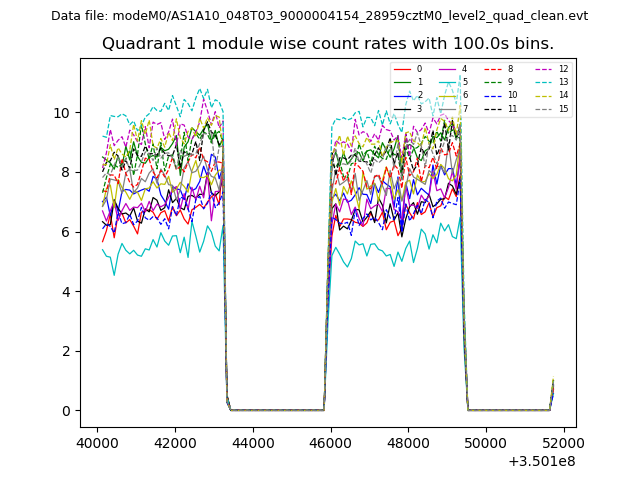 |
 |
| Module-wise count rates for Quadrant C Data is divided into 100 sec bins |
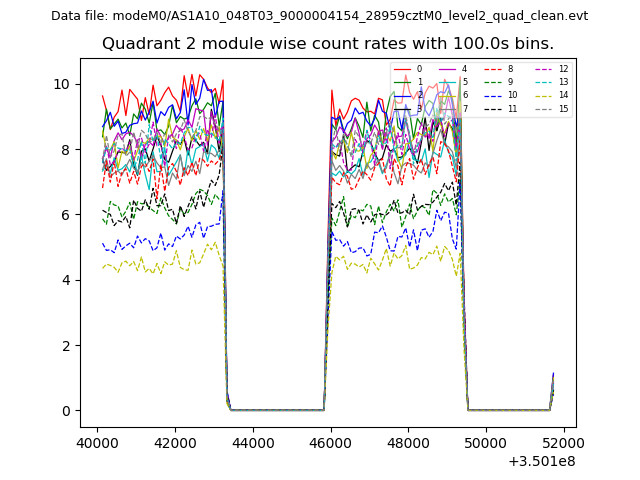 |
 |
| Module-wise count rates for Quadrant D Data is divided into 100 sec bins |
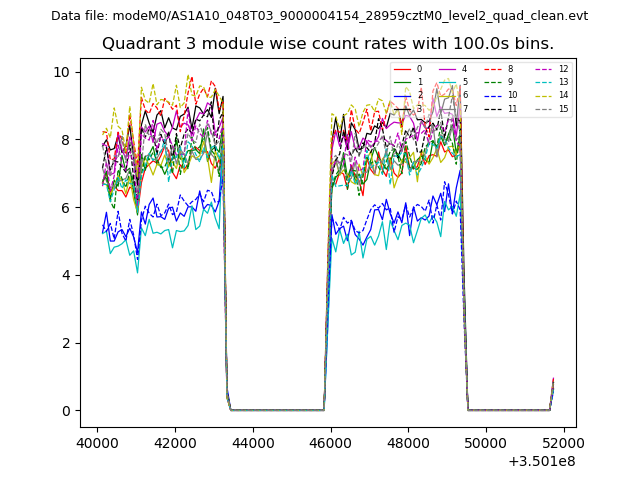 |
 |
| Parameter | Plot |
|---|---|
| CZT HV Monitor | 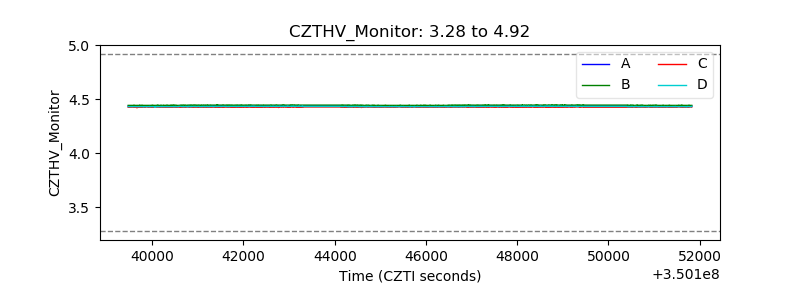 |
| D_VDD |  |
| Temperature 1 |  |
| Veto HV Monitor |  |
| Veto LLD |  |
| Alpha Counter | 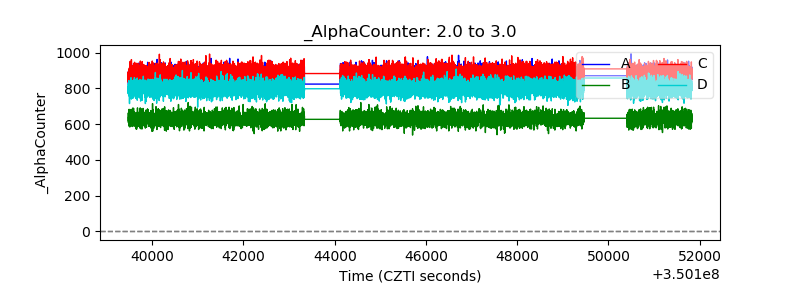 |
| _CPM_Rate | 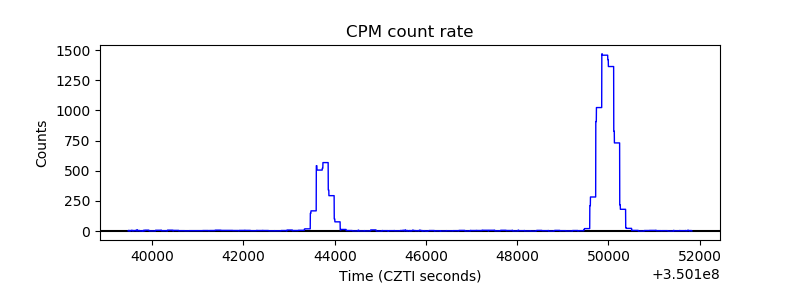 |
| CZT Counter |  |
| +2.5 Volts monitor |  |
| +5 Volts monitor |  |
| _ROLL_ROT | 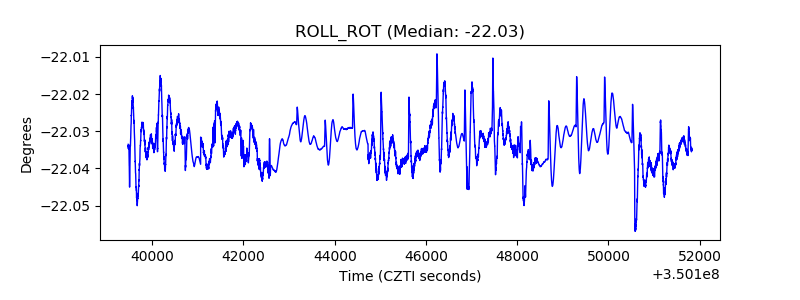 |
| _Roll_DEC | 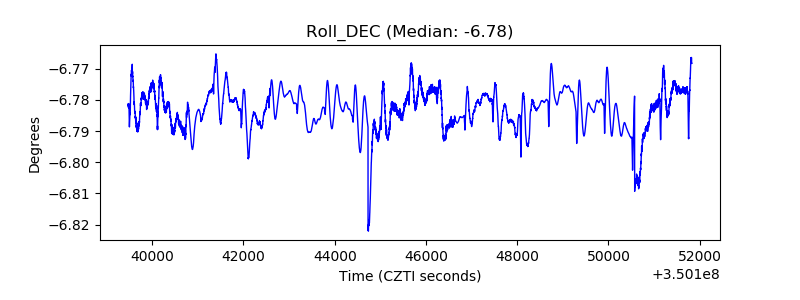 |
| _Roll_RA |  |
| Veto Counter | 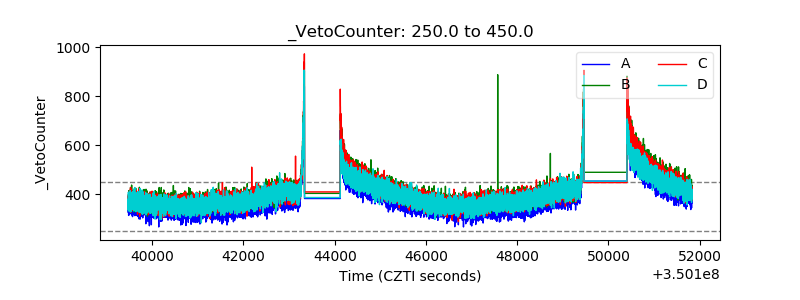 |