| Param | Original file | Final file |
|---|---|---|
| Filename | modeM0/AS1A10_048T03_9000004154_28961cztM0_level2.evt | modeM0/AS1A10_048T03_9000004154_28961cztM0_level2_quad_clean.evt |
| Size (bytes) | 526,302,720 | 84,286,080 |
| Size | 501.9 MB | 80.4 MB |
| Events in quadrant A | 3,402,372 | 528,926 |
| Events in quadrant B | 3,558,447 | 539,395 |
| Events in quadrant C | 3,492,708 | 514,923 |
| Events in quadrant D | 5,033,356 | 504,118 |
| Mode M9 | |||
|---|---|---|---|
| Quadrant | BADHDUFLAG | Total packets | Discarded packets |
| A | 0 | 21 | 0 |
| B | 0 | 21 | 0 |
| C | 0 | 21 | 0 |
| D | 0 | 21 | 0 |
| Mode M0 | |||
|---|---|---|---|
| Quadrant | BADHDUFLAG | Total packets | Discarded packets |
| A | 0 | 14464 | 3 |
| B | 0 | 14979 | 2 |
| C | 0 | 14670 | 2 |
| D | 0 | 19700 | 2 |
| Mode SS | |||
|---|---|---|---|
| Quadrant | BADHDUFLAG | Total packets | Discarded packets |
| A | 0 | 136 | 0 |
| B | 0 | 136 | 0 |
| C | 0 | 136 | 0 |
| D | 0 | 136 | 0 |
| Quadrant | Total seconds | Saturated seconds | Saturation percentage |
|---|---|---|---|
| A | 6674 | 80 | 1.198681% |
| B | 6674 | 112 | 1.678154% |
| C | 6674 | 249 | 3.730896% |
| D | 6675 | 249 | 3.730337% |
Noise dominated data is calculated using 1-second bins in cleaned event files. If a bin has >2000 counts, and if more than 50% of those come from <1% of pixels, then it is considered to be noise-dominated and hence unusable.
| Quadrant | # 1 sec bins | Bins with >0 counts | Bins with >2000 counts | High rate bins dominated by noise | Noise dominated (total time) | Noise dominated (detector-on time) | Marked lightcurve |
|---|---|---|---|---|---|---|---|
| A | 8704 | 6676 | 0 | 0 | 0.00% | 0.00% | 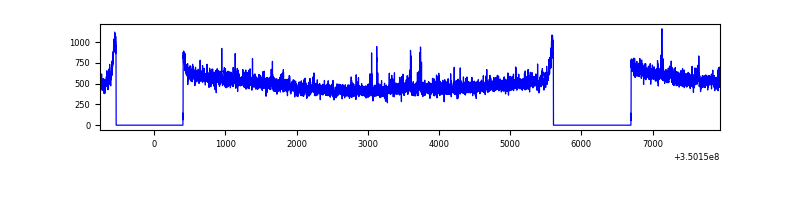 |
| B | 8704 | 6676 | 7 | 7 | 0.08% | 0.10% | 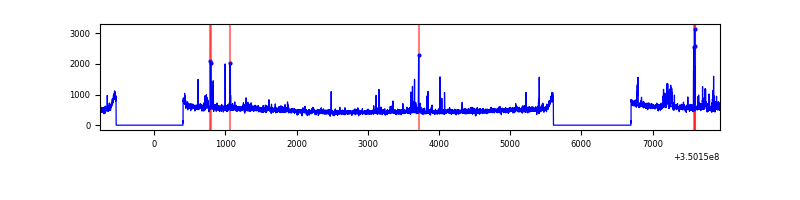 |
| C | 8704 | 6676 | 0 | 0 | 0.00% | 0.00% | 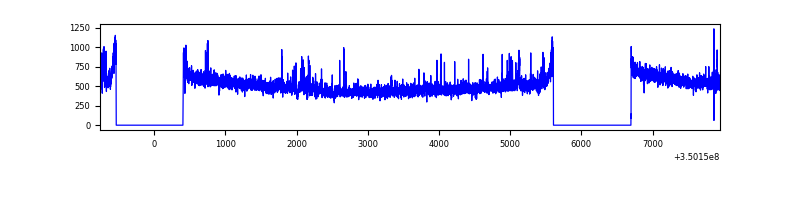 |
| D | 8705 | 6677 | 140 | 140 | 1.61% | 2.10% | 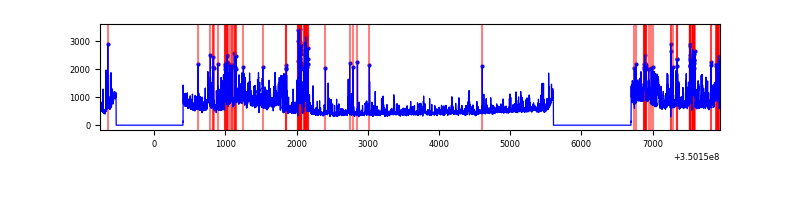 |
Top three noisy pixels from each quadrant. If the there are fewer than three noisy pixels in the level2.evt file, extra rows are filled as -1
| Pixel properties | Quadrant properties | ||||||
|---|---|---|---|---|---|---|---|
| Quadrant | DetID | PixID | Counts | Sigma | Mean | Median | Sigma |
| A | 12 | 96 | 30437 | 169.99 | 865 | 848 | 174.1 |
| A | 15 | 192 | 20571 | 113.31 | 865 | 848 | 174.1 |
| A | 11 | 128 | 13402 | 72.12 | 865 | 848 | 174.1 |
| B | 10 | 245 | 154472 | 928.51 | 860 | 839 | 165.5 |
| B | 12 | 111 | 19990 | 115.74 | 860 | 839 | 165.5 |
| B | 11 | 111 | 18246 | 105.2 | 860 | 839 | 165.5 |
| C | 14 | 238 | 176723 | 911.2 | 823 | 827 | 193.0 |
| C | 14 | 254 | 62324 | 318.57 | 823 | 827 | 193.0 |
| C | 3 | 233 | 26779 | 134.44 | 823 | 827 | 193.0 |
| D | 8 | 195 | 988392 | 4957.43 | 829 | 808 | 199.2 |
| D | 1 | 52 | 421351 | 2111.02 | 829 | 808 | 199.2 |
| D | 5 | 233 | 280246 | 1402.71 | 829 | 808 | 199.2 |
Histogram calculated using DETX and DETY for each event in the final _common_clean file
| Quadrant A | 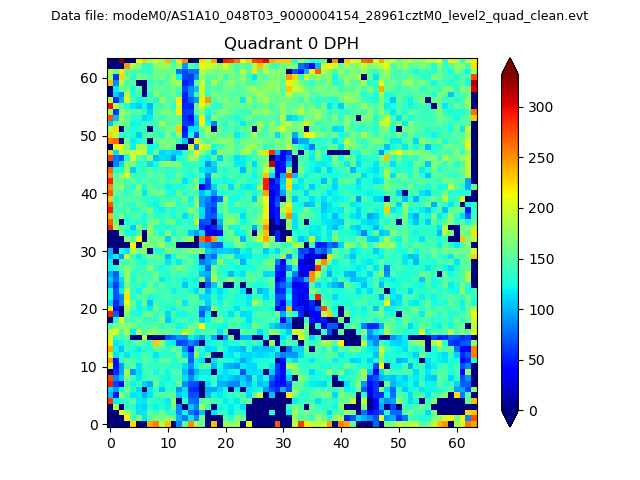 |
 |
Quadrant B |
|---|---|---|---|
| Quadrant D |  |
 |
Quadrant C |
| Plot type | Count rate plots | Images |
|---|---|---|
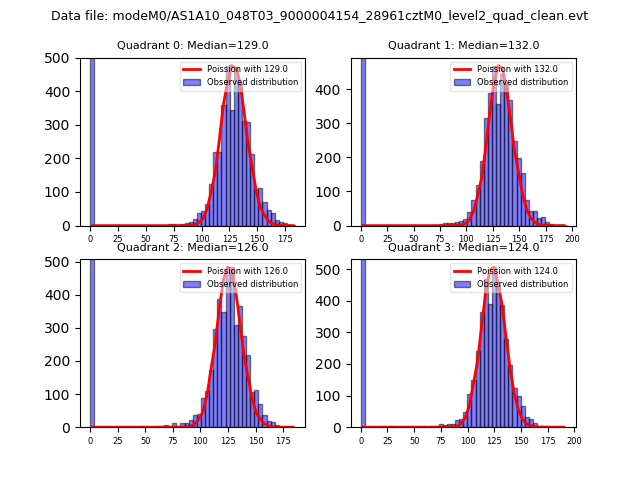
| Comparison with Poisson distribution Blue bars denote a histogram of data divided into 1 sec bins. Red curve is a Poisson curve with rate = median count rate of data. |
 |
 |
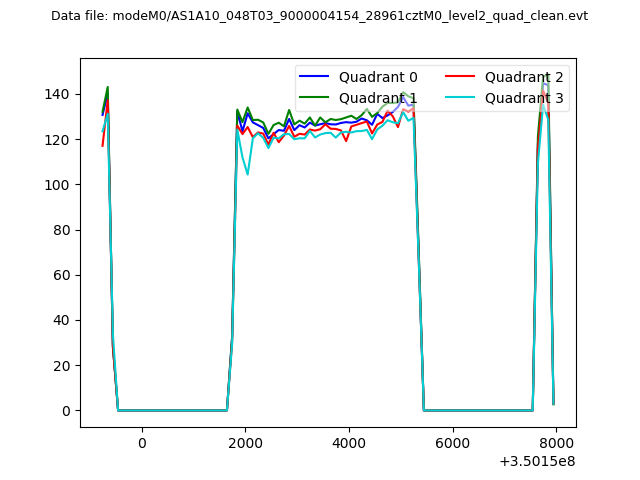
| Quadrant-wise count rates Data is divided into 100 sec bins |
 |
|
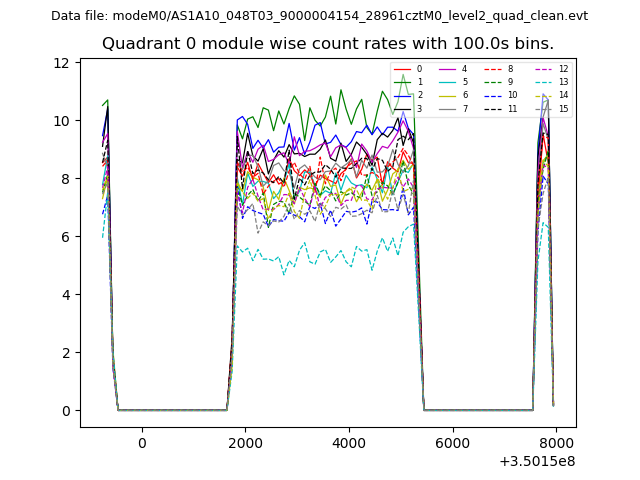
| Module-wise count rates for Quadrant A Data is divided into 100 sec bins |
 |
 |
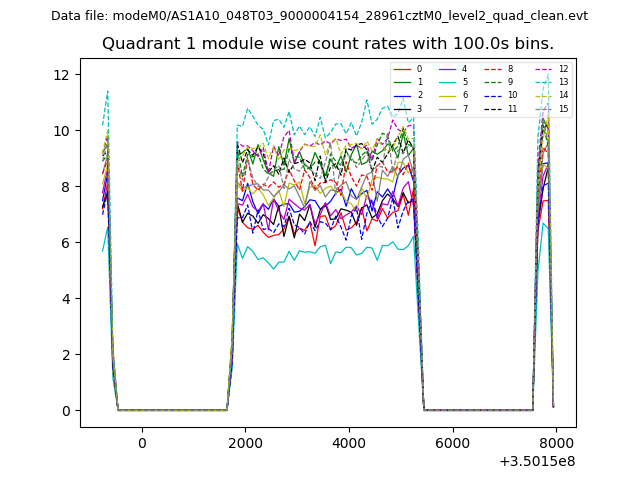
| Module-wise count rates for Quadrant B Data is divided into 100 sec bins |
 |
 |
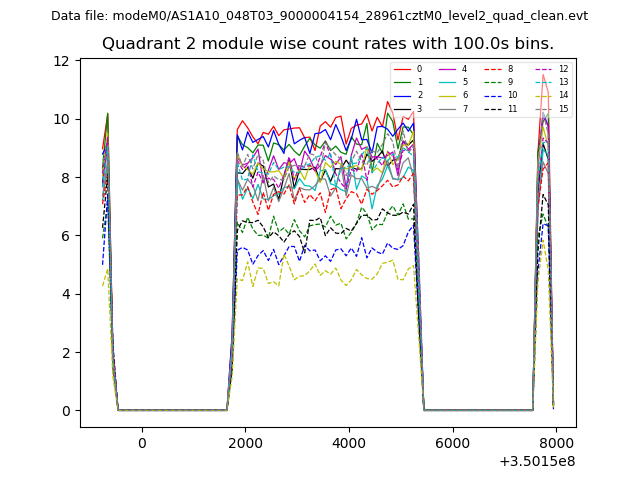
| Module-wise count rates for Quadrant C Data is divided into 100 sec bins |
 |
 |
| Module-wise count rates for Quadrant D Data is divided into 100 sec bins |
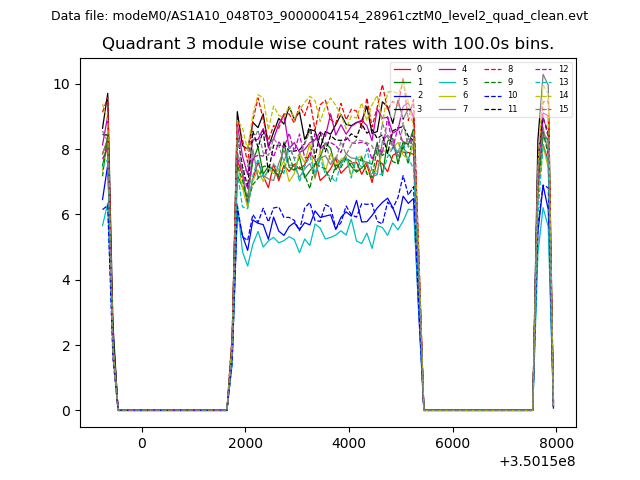 |
 |
| Parameter | Plot |
|---|---|
| CZT HV Monitor | 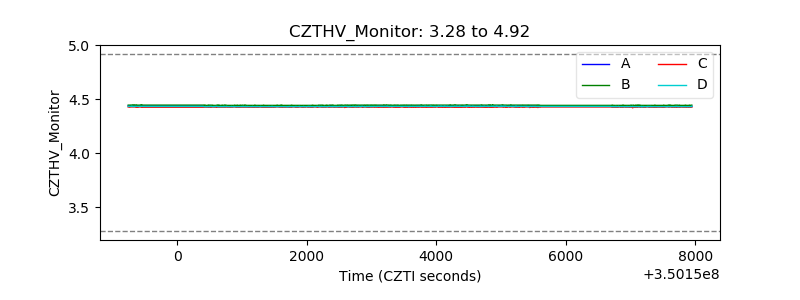 |
| D_VDD | 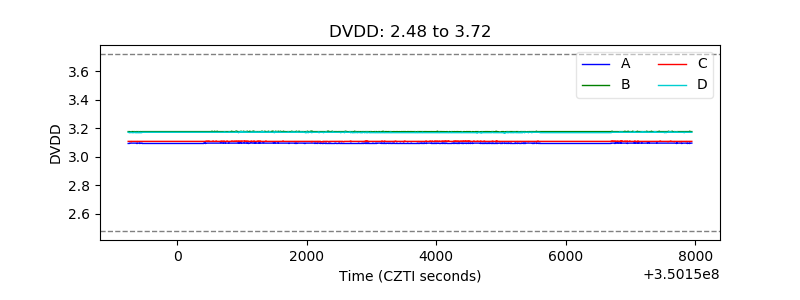 |
| Temperature 1 | 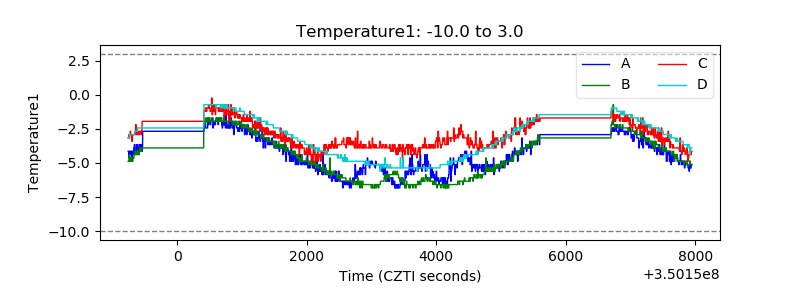 |
| Veto HV Monitor | 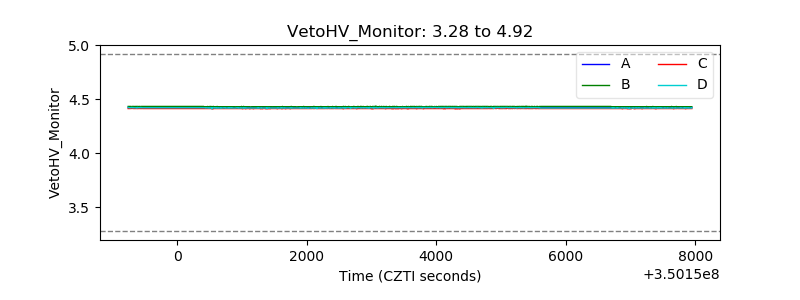 |
| Veto LLD | 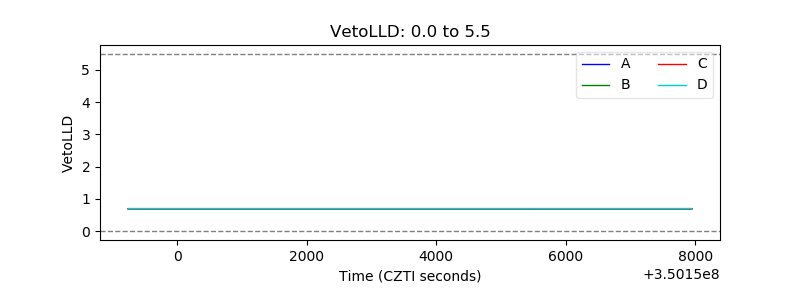 |
| Alpha Counter | 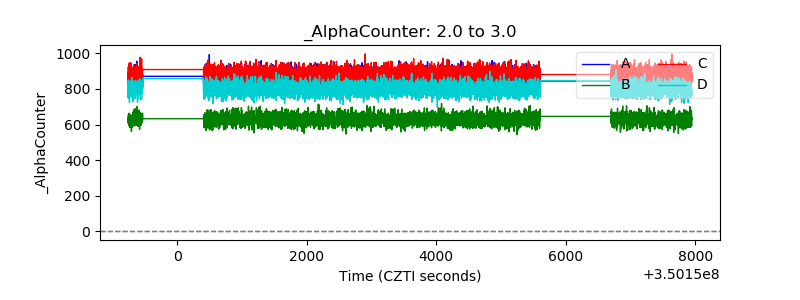 |
| _CPM_Rate | 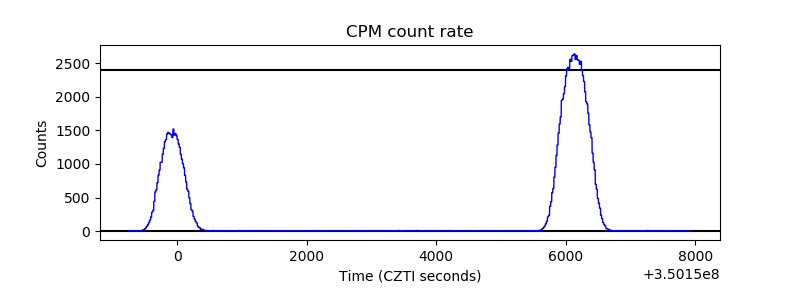 |
| CZT Counter |  |
| +2.5 Volts monitor |  |
| +5 Volts monitor |  |
| _ROLL_ROT | 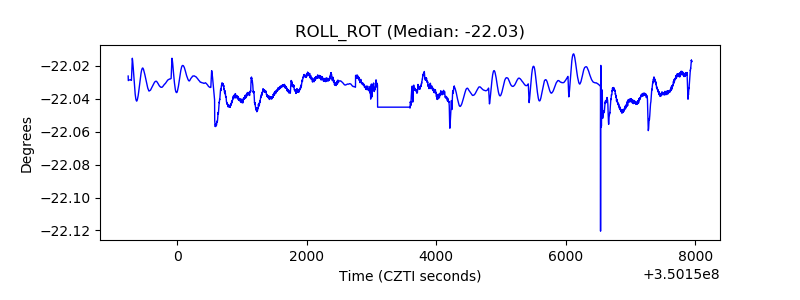 |
| _Roll_DEC | 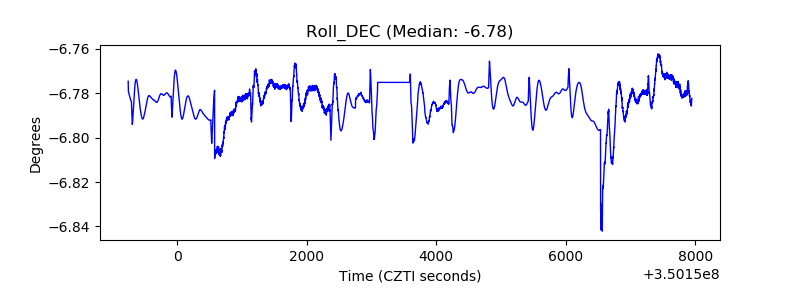 |
| _Roll_RA | 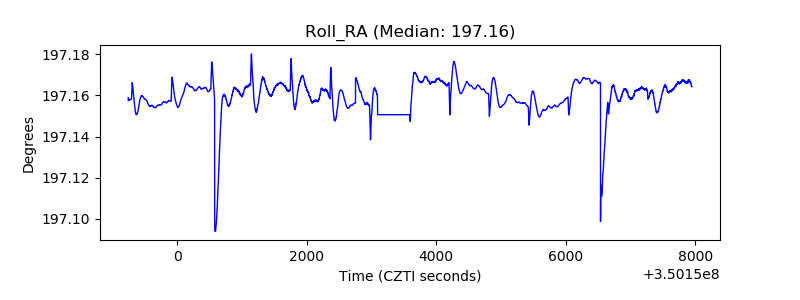 |
| Veto Counter | 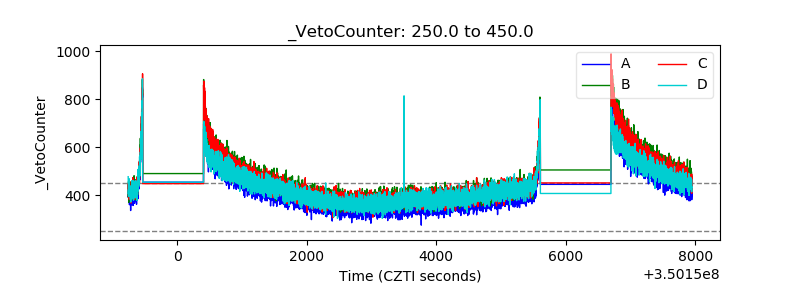 |