| Param | Original file | Final file |
|---|---|---|
| Filename | modeM0/AS1A10_048T03_9000004154_28962cztM0_level2.evt | modeM0/AS1A10_048T03_9000004154_28962cztM0_level2_quad_clean.evt |
| Size (bytes) | 1,934,447,040 | 327,003,840 |
| Size | 1.8 GB | 311.9 MB |
| Events in quadrant A | 12,206,307 | 2,086,050 |
| Events in quadrant B | 13,347,867 | 2,135,103 |
| Events in quadrant C | 12,088,260 | 2,049,854 |
| Events in quadrant D | 19,321,992 | 1,979,638 |
| Mode M9 | |||
|---|---|---|---|
| Quadrant | BADHDUFLAG | Total packets | Discarded packets |
| A | 0 | 46 | 0 |
| B | 0 | 46 | 0 |
| C | 0 | 46 | 0 |
| D | 0 | 46 | 0 |
| Mode M0 | |||
|---|---|---|---|
| Quadrant | BADHDUFLAG | Total packets | Discarded packets |
| A | 0 | 52111 | 5 |
| B | 0 | 55200 | 5 |
| C | 0 | 51073 | 5 |
| D | 0 | 74015 | 5 |
| Mode SS | |||
|---|---|---|---|
| Quadrant | BADHDUFLAG | Total packets | Discarded packets |
| A | 0 | 492 | 0 |
| B | 0 | 492 | 0 |
| C | 0 | 492 | 0 |
| D | 0 | 492 | 0 |
| Quadrant | Total seconds | Saturated seconds | Saturation percentage |
|---|---|---|---|
| A | 24031 | 428 | 1.781033% |
| B | 24031 | 786 | 3.270775% |
| C | 24031 | 647 | 2.692356% |
| D | 24031 | 1066 | 4.435937% |
Noise dominated data is calculated using 1-second bins in cleaned event files. If a bin has >2000 counts, and if more than 50% of those come from <1% of pixels, then it is considered to be noise-dominated and hence unusable.
| Quadrant | # 1 sec bins | Bins with >0 counts | Bins with >2000 counts | High rate bins dominated by noise | Noise dominated (total time) | Noise dominated (detector-on time) | Marked lightcurve |
|---|---|---|---|---|---|---|---|
| A | 28639 | 24039 | 154 | 154 | 0.54% | 0.64% | 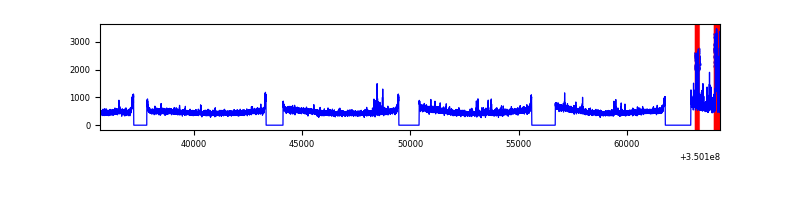 |
| B | 28639 | 24039 | 388 | 388 | 1.35% | 1.61% | 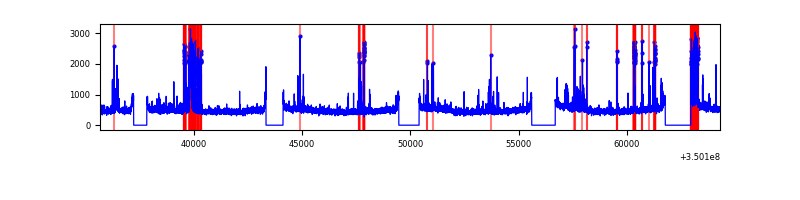 |
| C | 28639 | 24039 | 0 | 0 | 0.00% | 0.00% | 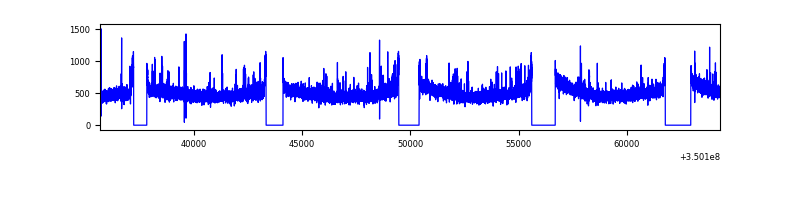 |
| D | 28639 | 24039 | 677 | 677 | 2.36% | 2.82% | 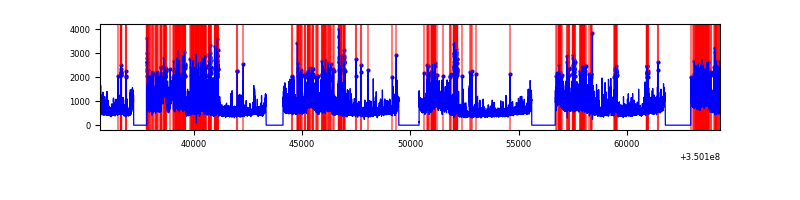 |
Top three noisy pixels from each quadrant. If the there are fewer than three noisy pixels in the level2.evt file, extra rows are filled as -1
| Pixel properties | Quadrant properties | ||||||
|---|---|---|---|---|---|---|---|
| Quadrant | DetID | PixID | Counts | Sigma | Mean | Median | Sigma |
| A | 12 | 96 | 614280 | 1023.26 | 2986 | 2924 | 597.5 |
| A | 13 | 254 | 43628 | 68.13 | 2986 | 2924 | 597.5 |
| A | 15 | 192 | 33540 | 51.24 | 2986 | 2924 | 597.5 |
| B | 10 | 245 | 1457255 | 2564.8 | 2960 | 2882 | 567.1 |
| B | 0 | 229 | 178351 | 309.44 | 2960 | 2882 | 567.1 |
| B | 12 | 111 | 70091 | 118.52 | 2960 | 2882 | 567.1 |
| C | 14 | 238 | 567963 | 841.2 | 2877 | 2894 | 671.7 |
| C | 14 | 254 | 156750 | 229.04 | 2877 | 2894 | 671.7 |
| C | 3 | 233 | 88792 | 127.87 | 2877 | 2894 | 671.7 |
| D | 8 | 195 | 4298576 | 6323.31 | 2869 | 2799 | 679.4 |
| D | 1 | 52 | 2583778 | 3799.16 | 2869 | 2799 | 679.4 |
| D | 5 | 233 | 902119 | 1323.78 | 2869 | 2799 | 679.4 |
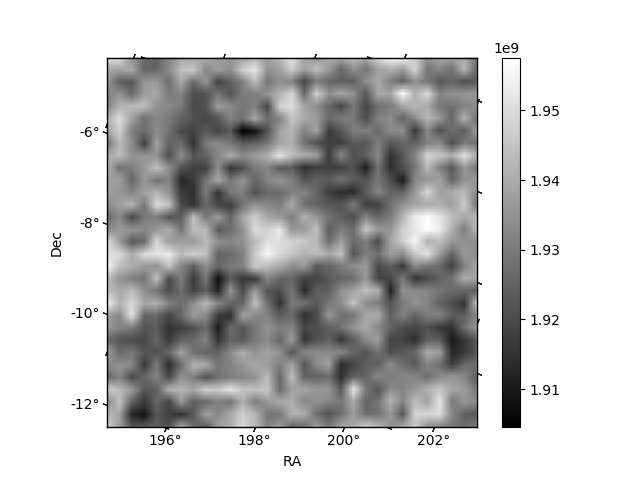
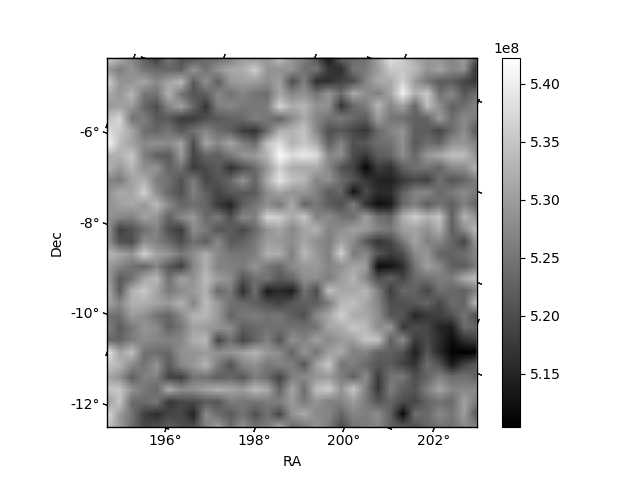
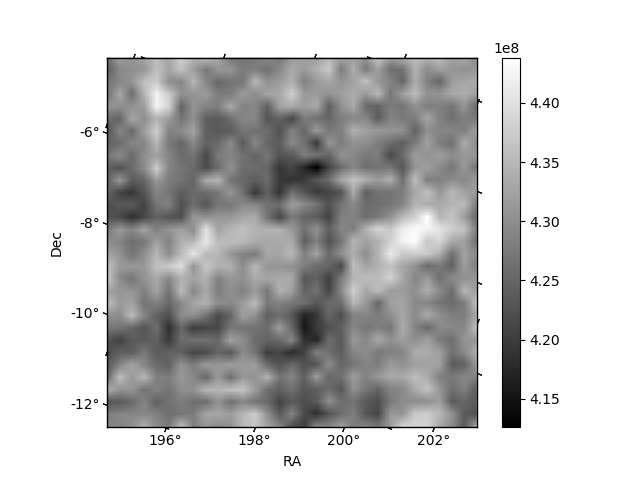
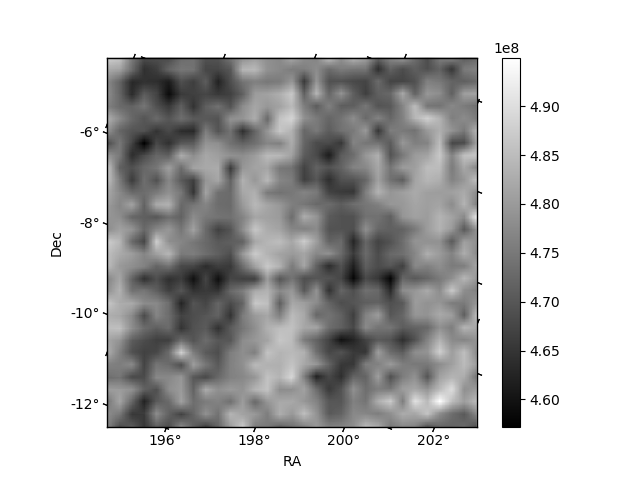
Histogram calculated using DETX and DETY for each event in the final _common_clean file
| Quadrant A | 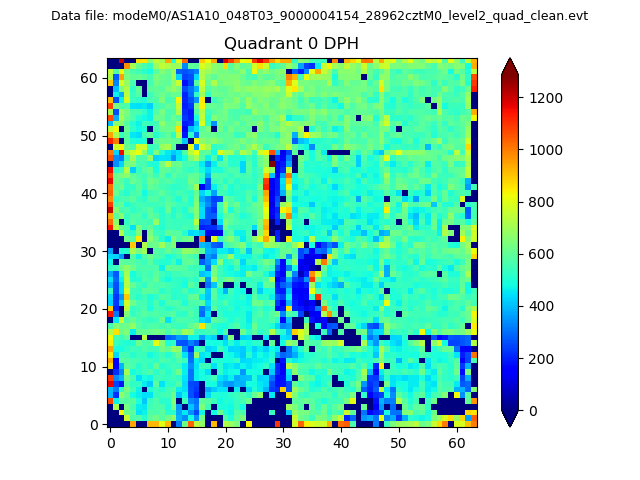 |
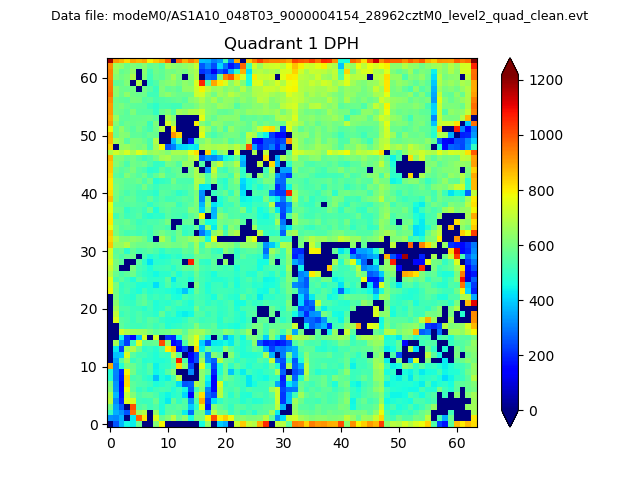 |
Quadrant B |
|---|---|---|---|
| Quadrant D | 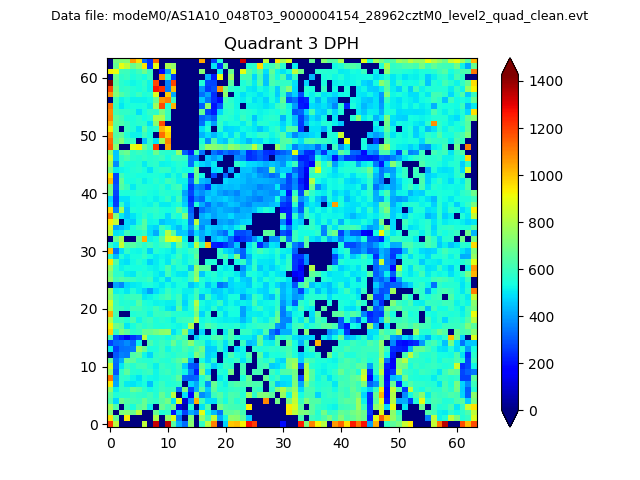 |
 |
Quadrant C |
| Plot type | Count rate plots | Images |
|---|---|---|
| Comparison with Poisson distribution Blue bars denote a histogram of data divided into 1 sec bins. Red curve is a Poisson curve with rate = median count rate of data. |
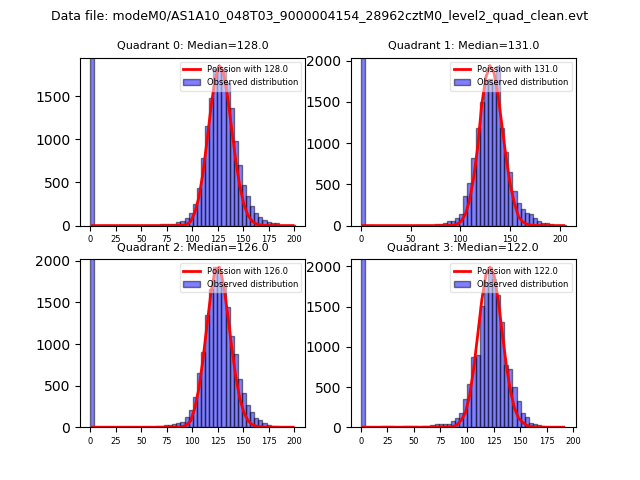 |
 |
| Quadrant-wise count rates Data is divided into 100 sec bins |
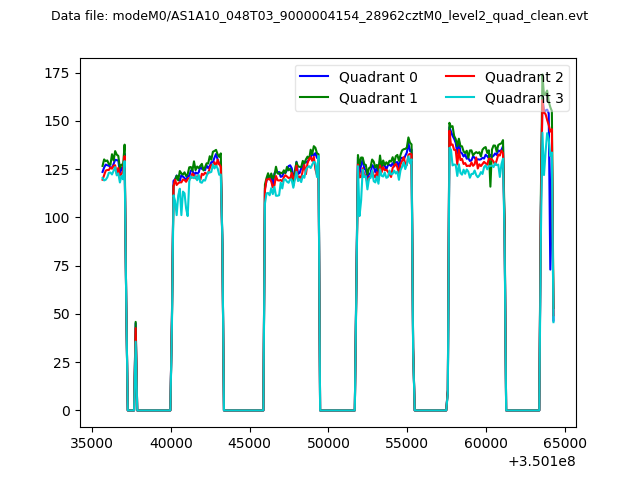 |
|
| Module-wise count rates for Quadrant A Data is divided into 100 sec bins |
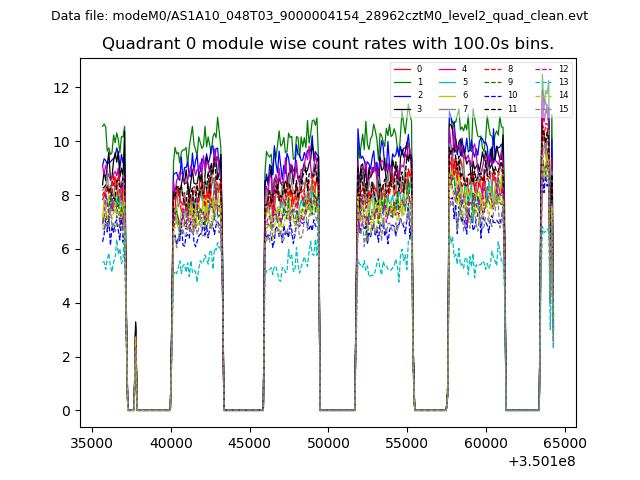 |
 |
| Module-wise count rates for Quadrant B Data is divided into 100 sec bins |
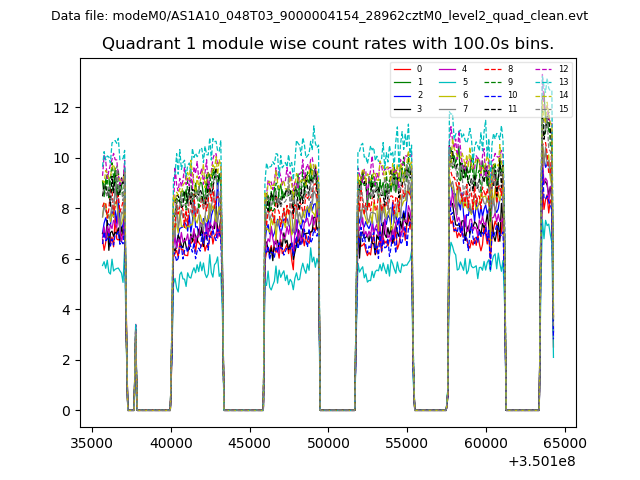 |
 |
| Module-wise count rates for Quadrant C Data is divided into 100 sec bins |
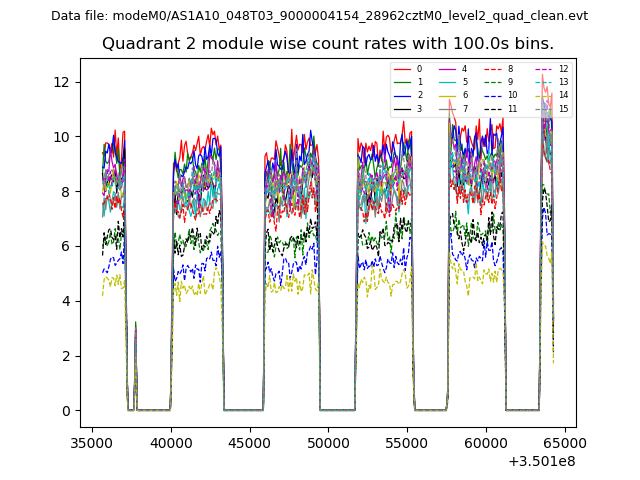 |
 |
| Module-wise count rates for Quadrant D Data is divided into 100 sec bins |
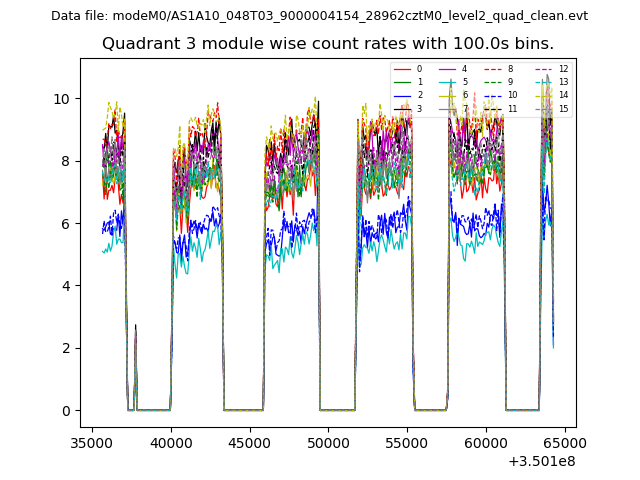 |
 |
| Parameter | Plot |
|---|---|
| CZT HV Monitor | 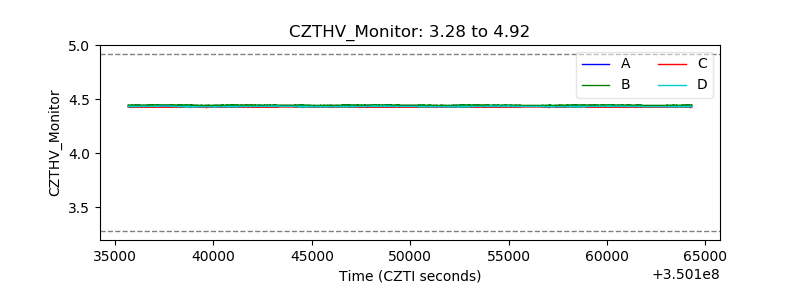 |
| D_VDD | 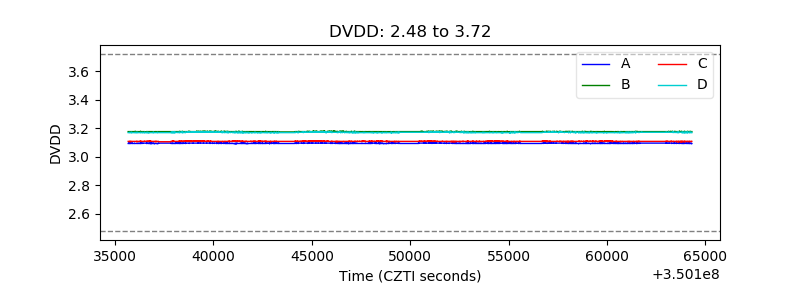 |
| Temperature 1 | 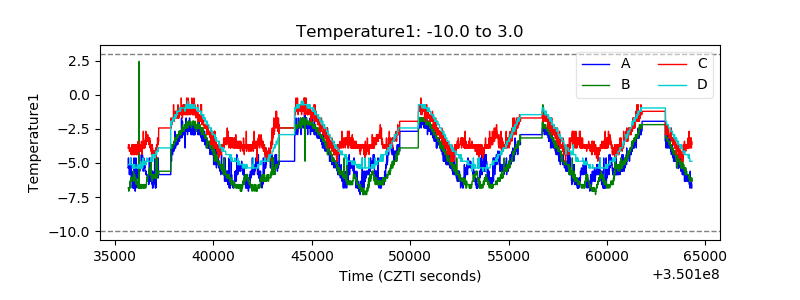 |
| Veto HV Monitor | 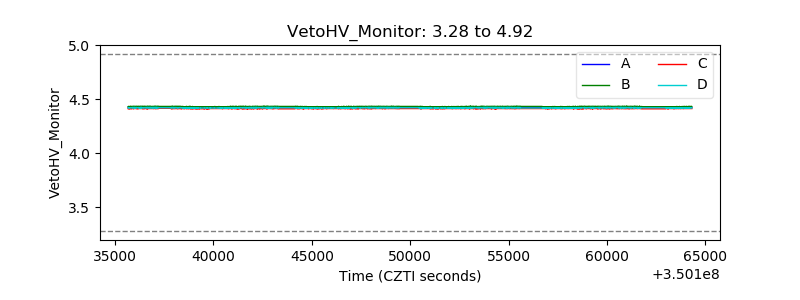 |
| Veto LLD | 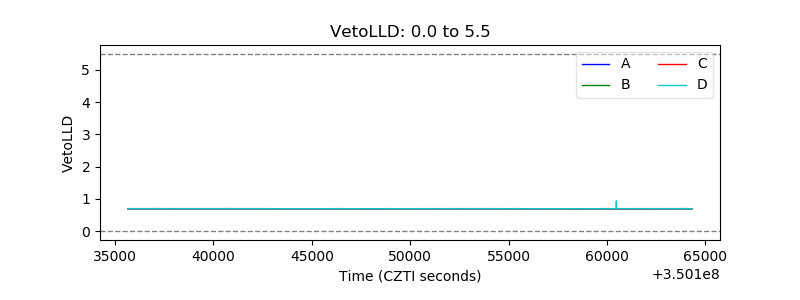 |
| Alpha Counter | 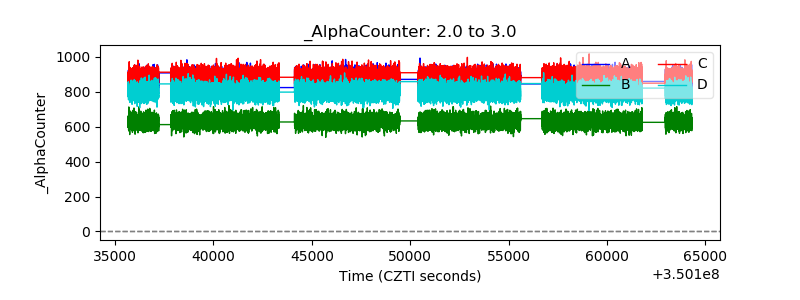 |
| _CPM_Rate | 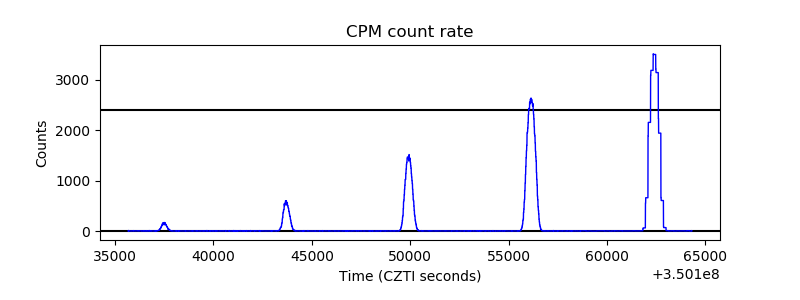 |
| CZT Counter |  |
| +2.5 Volts monitor |  |
| +5 Volts monitor |  |
| _ROLL_ROT | 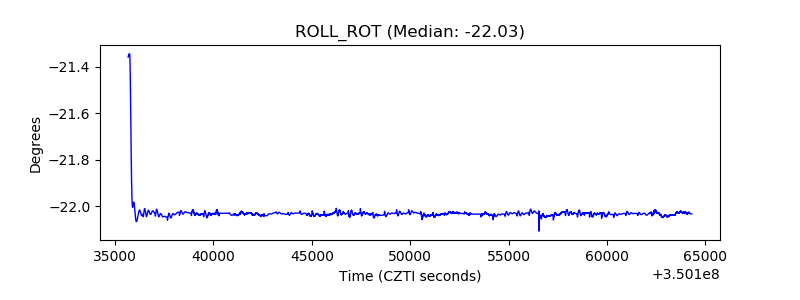 |
| _Roll_DEC | 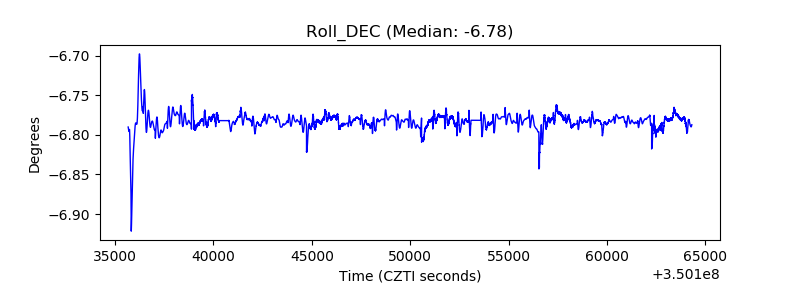 |
| _Roll_RA | 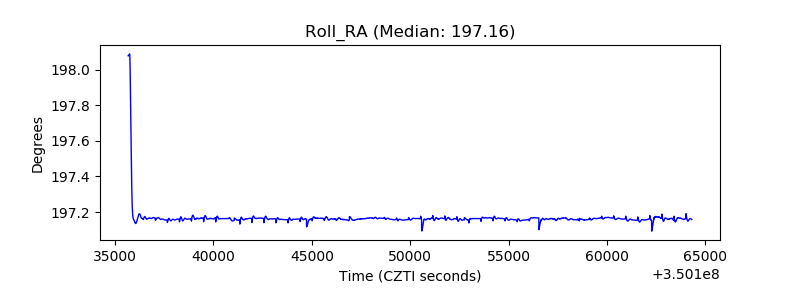 |
| Veto Counter | 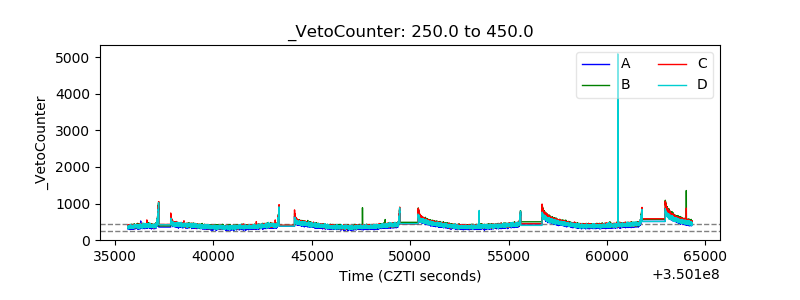 |