| Param | Original file | Final file |
|---|---|---|
| Filename | modeM0/AS1A10_048T03_9000004154_28963cztM0_level2.evt | modeM0/AS1A10_048T03_9000004154_28963cztM0_level2_quad_clean.evt |
| Size (bytes) | 560,473,920 | 105,883,200 |
| Size | 534.5 MB | 101.0 MB |
| Events in quadrant A | 4,031,143 | 696,839 |
| Events in quadrant B | 3,979,154 | 732,693 |
| Events in quadrant C | 3,361,754 | 689,515 |
| Events in quadrant D | 5,174,011 | 646,786 |
| Mode M9 | |||
|---|---|---|---|
| Quadrant | BADHDUFLAG | Total packets | Discarded packets |
| A | 0 | 22 | 0 |
| B | 0 | 23 | 0 |
| C | 0 | 23 | 0 |
| D | 0 | 23 | 0 |
| Mode M0 | |||
|---|---|---|---|
| Quadrant | BADHDUFLAG | Total packets | Discarded packets |
| A | 0 | 16045 | 2 |
| B | 0 | 15811 | 2 |
| C | 0 | 13966 | 2 |
| D | 0 | 19639 | 2 |
| Mode SS | |||
|---|---|---|---|
| Quadrant | BADHDUFLAG | Total packets | Discarded packets |
| A | 0 | 128 | 0 |
| B | 0 | 128 | 0 |
| C | 0 | 128 | 0 |
| D | 0 | 128 | 0 |
| Quadrant | Total seconds | Saturated seconds | Saturation percentage |
|---|---|---|---|
| A | 6318 | 267 | 4.226021% |
| B | 6318 | 265 | 4.194365% |
| C | 6318 | 131 | 2.073441% |
| D | 6318 | 319 | 5.049066% |
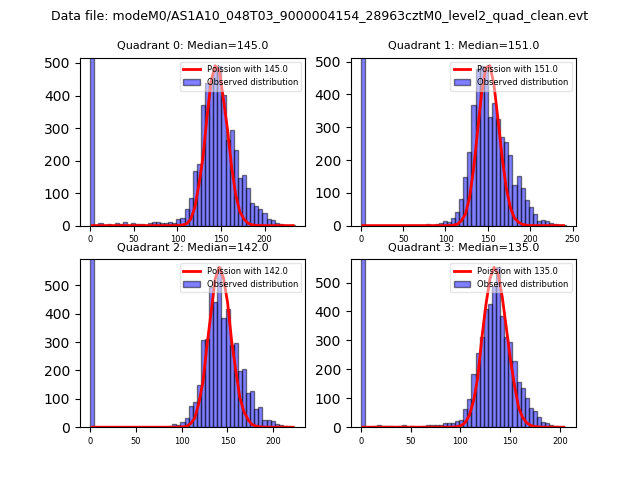
Noise dominated data is calculated using 1-second bins in cleaned event files. If a bin has >2000 counts, and if more than 50% of those come from <1% of pixels, then it is considered to be noise-dominated and hence unusable.
| Quadrant | # 1 sec bins | Bins with >0 counts | Bins with >2000 counts | High rate bins dominated by noise | Noise dominated (total time) | Noise dominated (detector-on time) | Marked lightcurve |
|---|---|---|---|---|---|---|---|
| A | 7598 | 6319 | 195 | 195 | 2.57% | 3.09% |  |
| B | 7598 | 6319 | 161 | 161 | 2.12% | 2.55% | 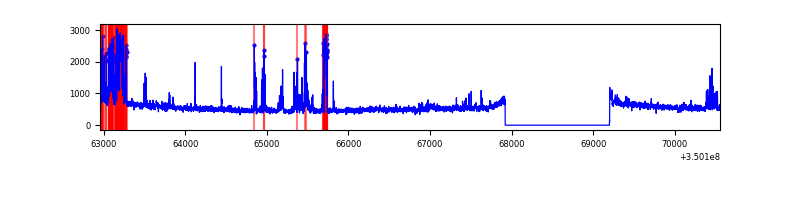 |
| C | 7598 | 6319 | 0 | 0 | 0.00% | 0.00% |  |
| D | 7598 | 6319 | 226 | 226 | 2.97% | 3.58% | 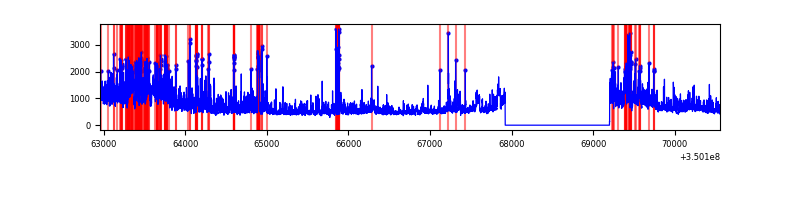 |
Top three noisy pixels from each quadrant. If the there are fewer than three noisy pixels in the level2.evt file, extra rows are filled as -1
| Pixel properties | Quadrant properties | ||||||
|---|---|---|---|---|---|---|---|
| Quadrant | DetID | PixID | Counts | Sigma | Mean | Median | Sigma |
| A | 12 | 96 | 744748 | 4457.14 | 837 | 823 | 166.9 |
| A | 1 | 113 | 27678 | 160.9 | 837 | 823 | 166.9 |
| A | 15 | 192 | 17613 | 100.6 | 837 | 823 | 166.9 |
| B | 10 | 245 | 547517 | 3444.79 | 841 | 822 | 158.7 |
| B | 0 | 229 | 113017 | 706.95 | 841 | 822 | 158.7 |
| B | 12 | 111 | 18816 | 113.38 | 841 | 822 | 158.7 |
| C | 14 | 238 | 145015 | 757.2 | 816 | 823 | 190.4 |
| C | 14 | 254 | 16073 | 80.08 | 816 | 823 | 190.4 |
| C | 2 | 114 | 14932 | 74.09 | 816 | 823 | 190.4 |
| D | 8 | 195 | 1043721 | 5512.5 | 795 | 776 | 189.2 |
| D | 1 | 52 | 922061 | 4869.46 | 795 | 776 | 189.2 |
| D | 5 | 233 | 177726 | 935.27 | 795 | 776 | 189.2 |
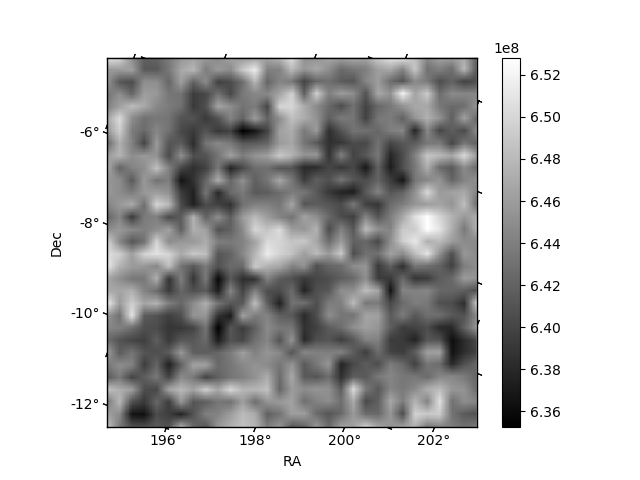
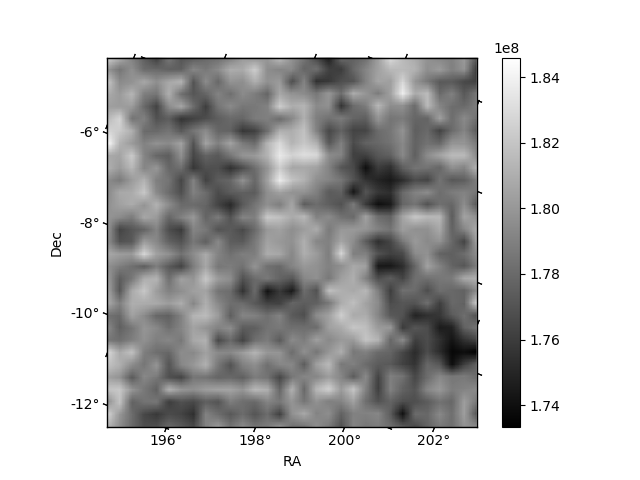
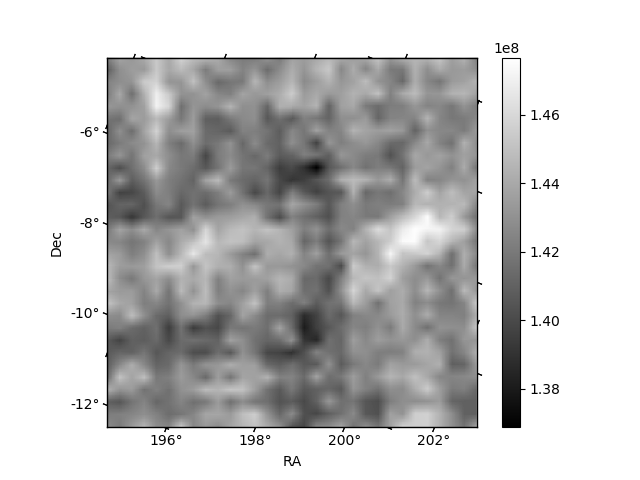
Histogram calculated using DETX and DETY for each event in the final _common_clean file
| Quadrant A |  |
 |
Quadrant B |
|---|---|---|---|
| Quadrant D |  |
 |
Quadrant C |
| Plot type | Count rate plots | Images |
|---|---|---|
| Comparison with Poisson distribution Blue bars denote a histogram of data divided into 1 sec bins. Red curve is a Poisson curve with rate = median count rate of data. |
 |
 |
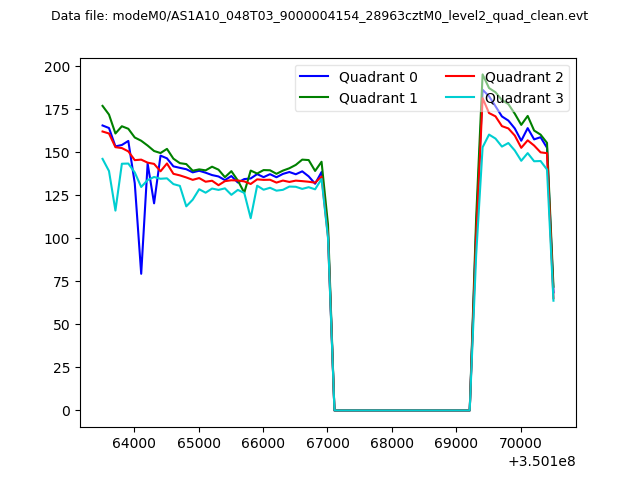
| Quadrant-wise count rates Data is divided into 100 sec bins |
 |
|
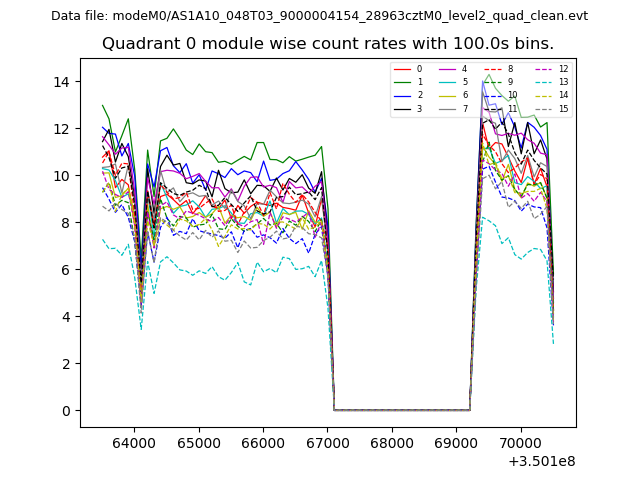
| Module-wise count rates for Quadrant A Data is divided into 100 sec bins |
 |
 |
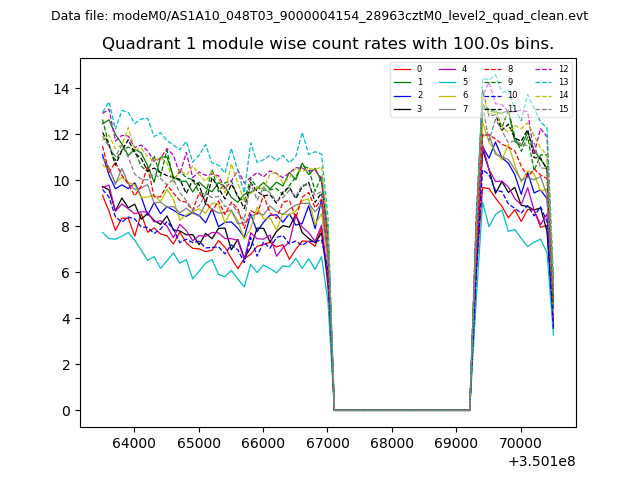
| Module-wise count rates for Quadrant B Data is divided into 100 sec bins |
 |
 |
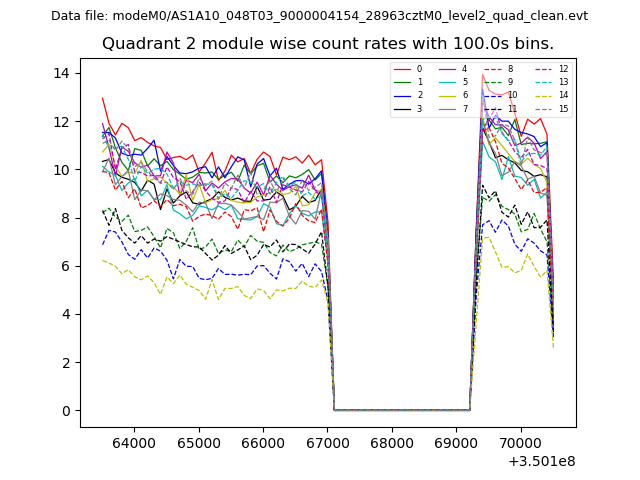
| Module-wise count rates for Quadrant C Data is divided into 100 sec bins |
 |
 |
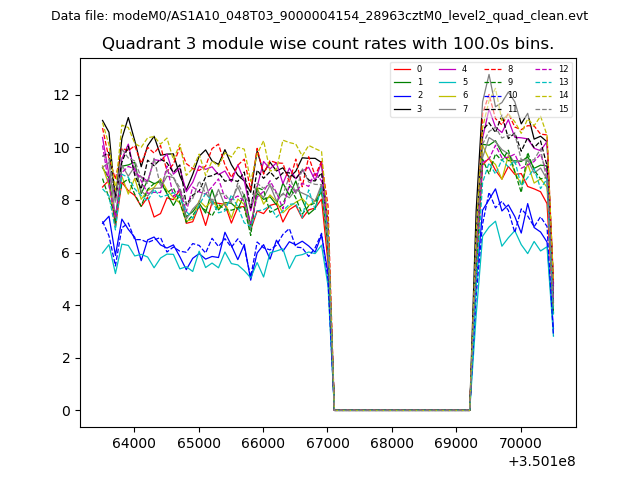
| Module-wise count rates for Quadrant D Data is divided into 100 sec bins |
 |
 |
| Parameter | Plot |
|---|---|
| CZT HV Monitor | 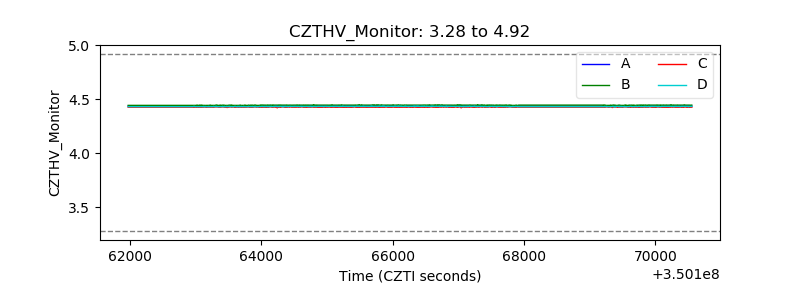 |
| D_VDD | 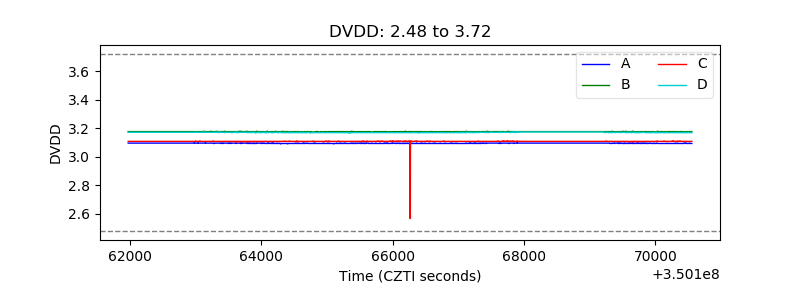 |
| Temperature 1 | 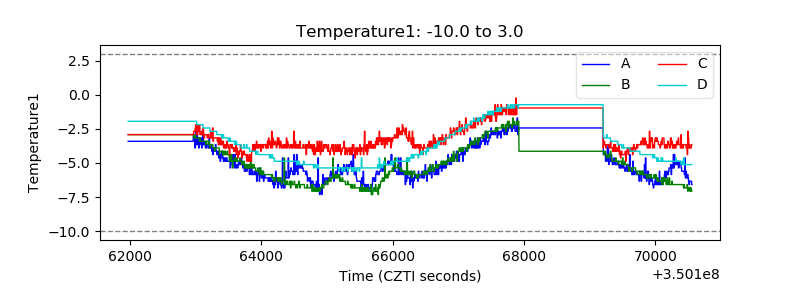 |
| Veto HV Monitor | 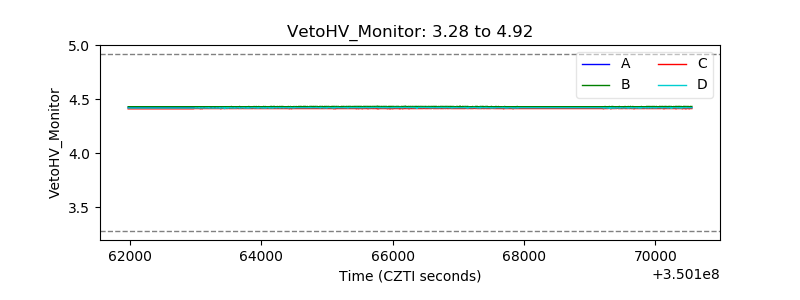 |
| Veto LLD | 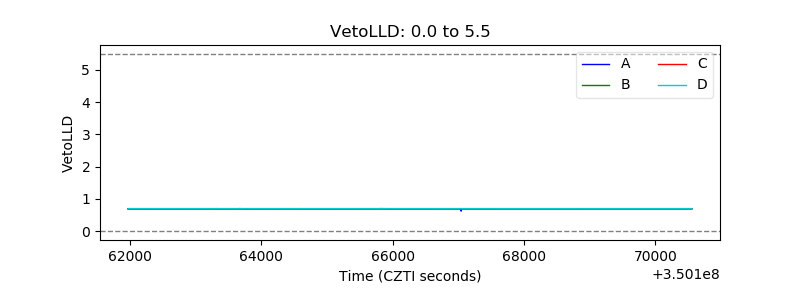 |
| Alpha Counter | 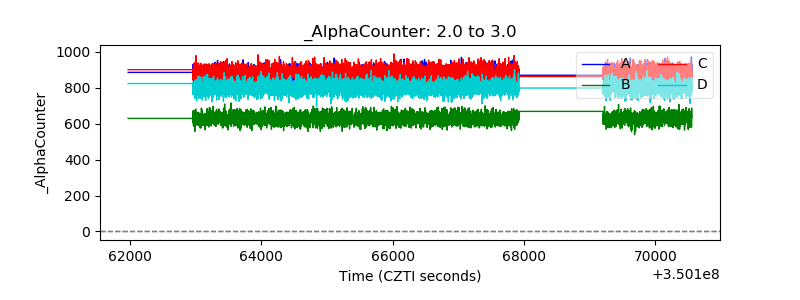 |
| _CPM_Rate | 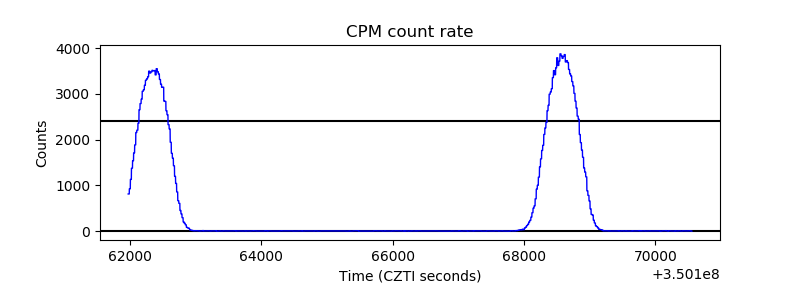 |
| CZT Counter |  |
| +2.5 Volts monitor |  |
| +5 Volts monitor |  |
| _ROLL_ROT | 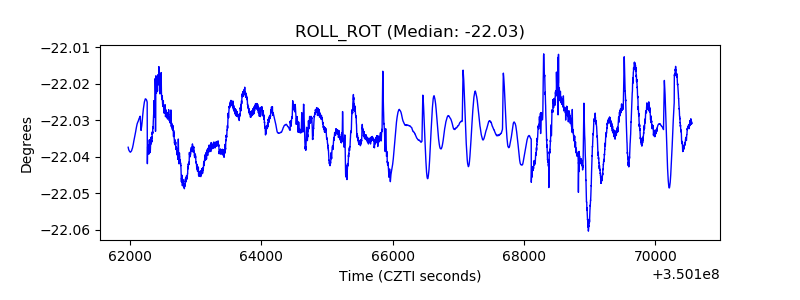 |
| _Roll_DEC | 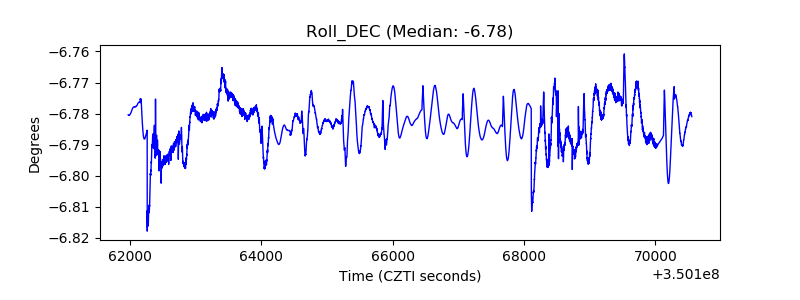 |
| _Roll_RA | 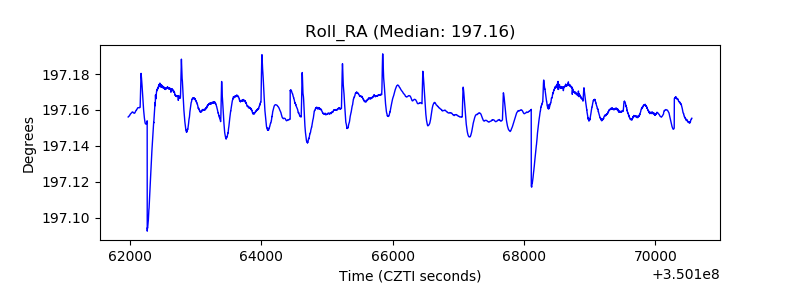 |
| Veto Counter | 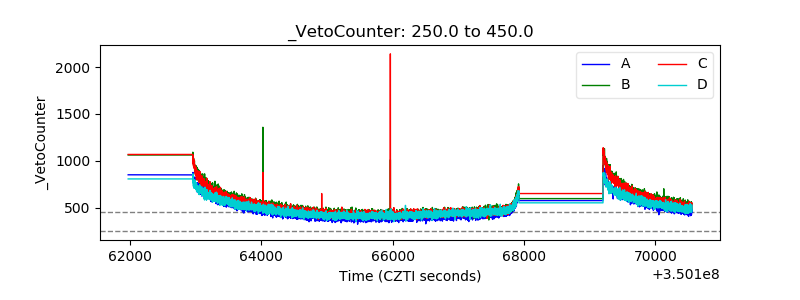 |