| Param | Original file | Final file |
|---|---|---|
| Filename | modeM0/AS1A10_048T03_9000004154_28964cztM0_level2.evt | modeM0/AS1A10_048T03_9000004154_28964cztM0_level2_quad_clean.evt |
| Size (bytes) | 511,531,200 | 110,151,360 |
| Size | 487.8 MB | 105.0 MB |
| Events in quadrant A | 3,487,569 | 738,349 |
| Events in quadrant B | 3,567,449 | 767,269 |
| Events in quadrant C | 3,301,348 | 718,319 |
| Events in quadrant D | 4,717,135 | 681,524 |
| Mode M9 | |||
|---|---|---|---|
| Quadrant | BADHDUFLAG | Total packets | Discarded packets |
| A | 0 | 24 | 0 |
| B | 0 | 25 | 0 |
| C | 0 | 25 | 0 |
| D | 0 | 25 | 0 |
| Mode M0 | |||
|---|---|---|---|
| Quadrant | BADHDUFLAG | Total packets | Discarded packets |
| A | 0 | 14245 | 2 |
| B | 0 | 14429 | 2 |
| C | 0 | 13590 | 2 |
| D | 0 | 18268 | 2 |
| Mode SS | |||
|---|---|---|---|
| Quadrant | BADHDUFLAG | Total packets | Discarded packets |
| A | 0 | 126 | 0 |
| B | 0 | 126 | 0 |
| C | 0 | 126 | 0 |
| D | 0 | 126 | 0 |
| Quadrant | Total seconds | Saturated seconds | Saturation percentage |
|---|---|---|---|
| A | 6167 | 86 | 1.394519% |
| B | 6167 | 122 | 1.978271% |
| C | 6167 | 134 | 2.172856% |
| D | 6167 | 148 | 2.399870% |
Noise dominated data is calculated using 1-second bins in cleaned event files. If a bin has >2000 counts, and if more than 50% of those come from <1% of pixels, then it is considered to be noise-dominated and hence unusable.
| Quadrant | # 1 sec bins | Bins with >0 counts | Bins with >2000 counts | High rate bins dominated by noise | Noise dominated (total time) | Noise dominated (detector-on time) | Marked lightcurve |
|---|---|---|---|---|---|---|---|
| A | 7512 | 6168 | 35 | 35 | 0.47% | 0.57% | 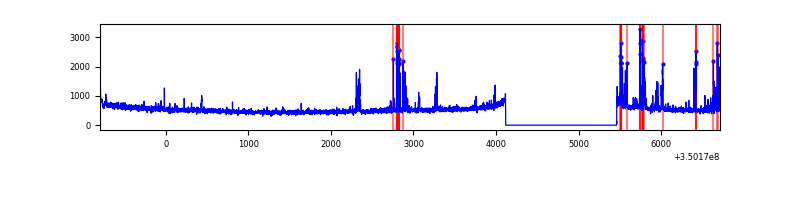 |
| B | 7512 | 6168 | 46 | 46 | 0.61% | 0.75% | 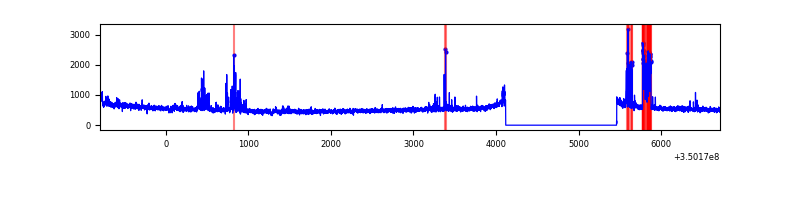 |
| C | 7512 | 6168 | 0 | 0 | 0.00% | 0.00% | 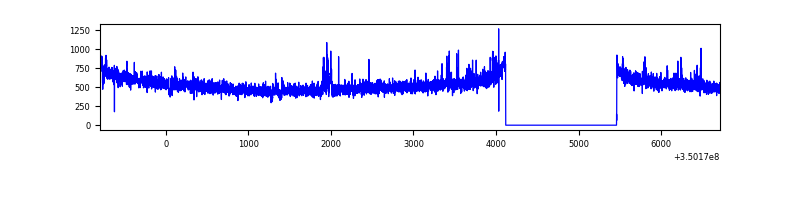 |
| D | 7512 | 6168 | 70 | 70 | 0.93% | 1.13% | 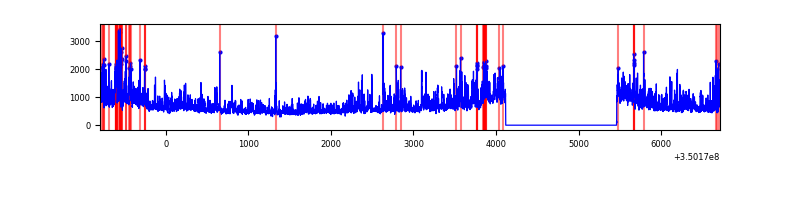 |
Top three noisy pixels from each quadrant. If the there are fewer than three noisy pixels in the level2.evt file, extra rows are filled as -1
| Pixel properties | Quadrant properties | ||||||
|---|---|---|---|---|---|---|---|
| Quadrant | DetID | PixID | Counts | Sigma | Mean | Median | Sigma |
| A | 12 | 96 | 292922 | 1779.97 | 826 | 813 | 164.1 |
| A | 13 | 254 | 10939 | 61.7 | 826 | 813 | 164.1 |
| A | 3 | 137 | 7612 | 41.43 | 826 | 813 | 164.1 |
| B | 10 | 245 | 298872 | 1911.84 | 832 | 812 | 155.9 |
| B | 12 | 111 | 18791 | 115.32 | 832 | 812 | 155.9 |
| B | 11 | 111 | 16803 | 102.57 | 832 | 812 | 155.9 |
| C | 14 | 238 | 152551 | 821.25 | 795 | 801 | 184.8 |
| C | 14 | 254 | 32485 | 171.47 | 795 | 801 | 184.8 |
| C | 2 | 114 | 14270 | 72.89 | 795 | 801 | 184.8 |
| D | 8 | 195 | 1007422 | 5423.07 | 784 | 766 | 185.6 |
| D | 1 | 52 | 669340 | 3601.75 | 784 | 766 | 185.6 |
| D | 5 | 233 | 63682 | 338.94 | 784 | 766 | 185.6 |
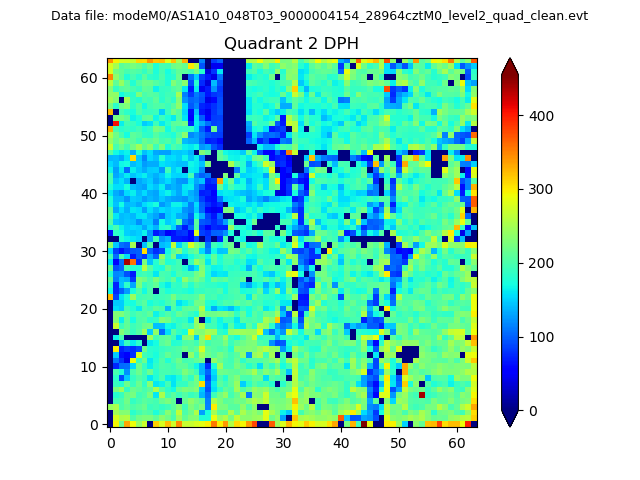
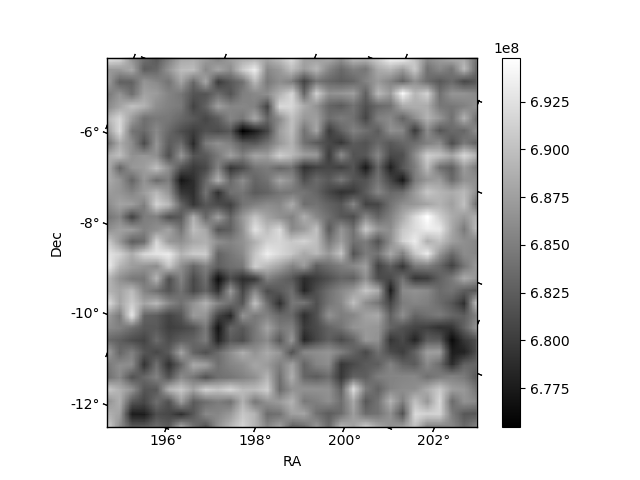
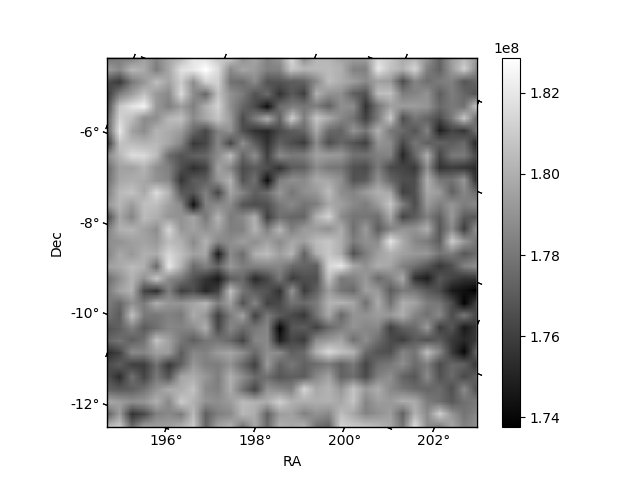
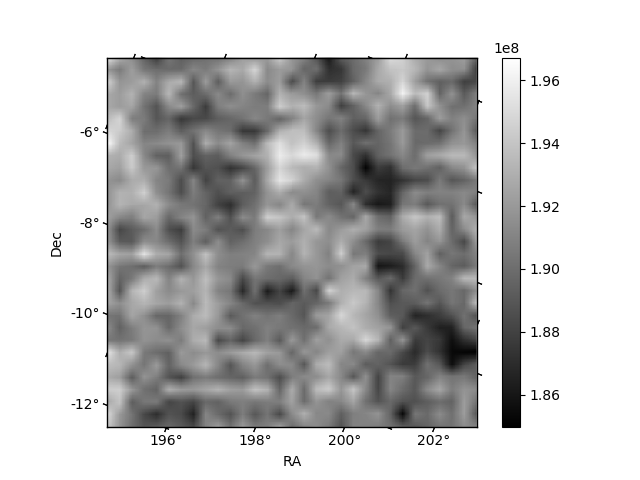
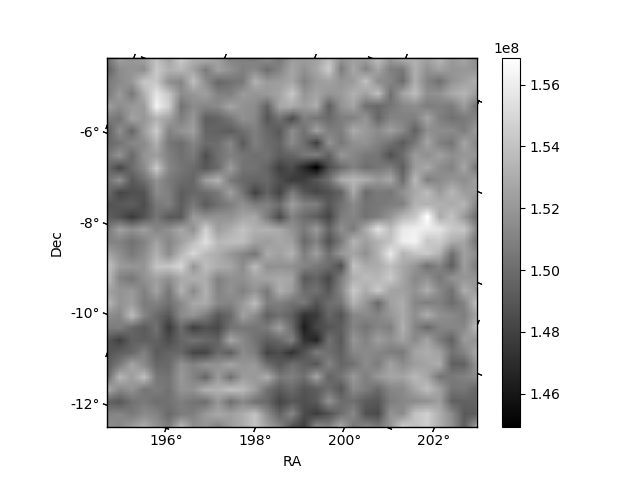
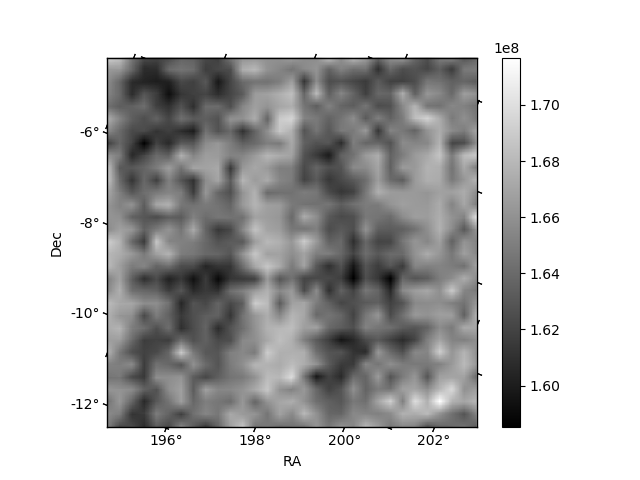
Histogram calculated using DETX and DETY for each event in the final _common_clean file
| Quadrant A | 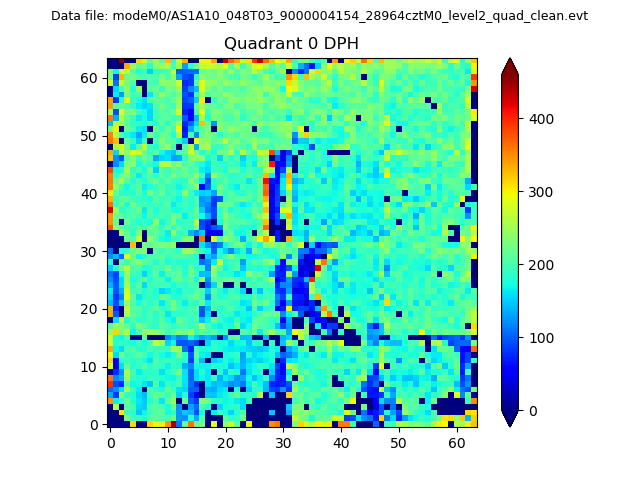 |
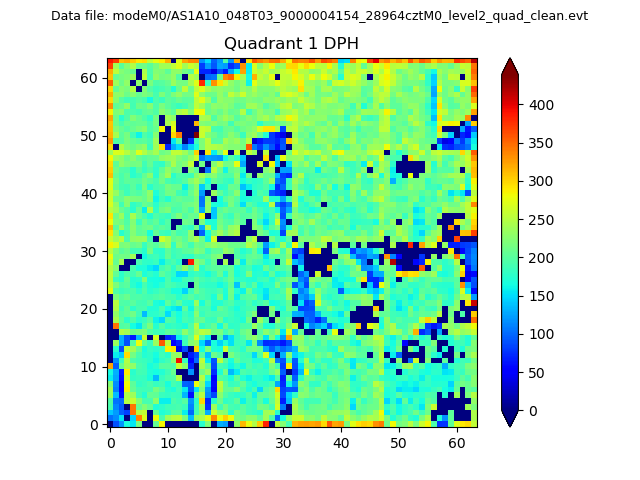 |
Quadrant B |
|---|---|---|---|
| Quadrant D | 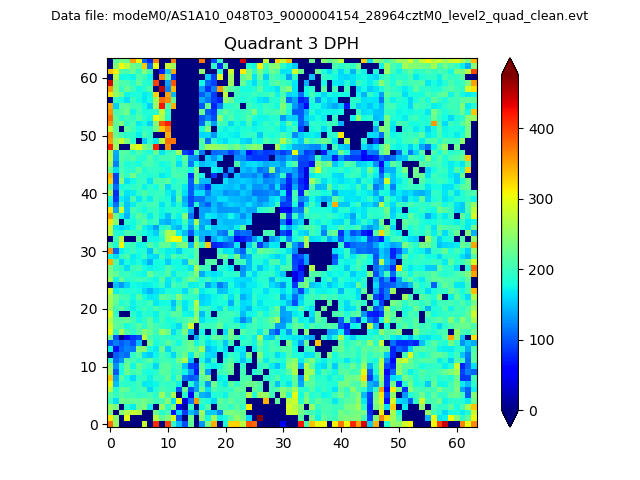 |
 |
Quadrant C |
| Plot type | Count rate plots | Images |
|---|---|---|
| Comparison with Poisson distribution Blue bars denote a histogram of data divided into 1 sec bins. Red curve is a Poisson curve with rate = median count rate of data. |
 |
 |
| Quadrant-wise count rates Data is divided into 100 sec bins |
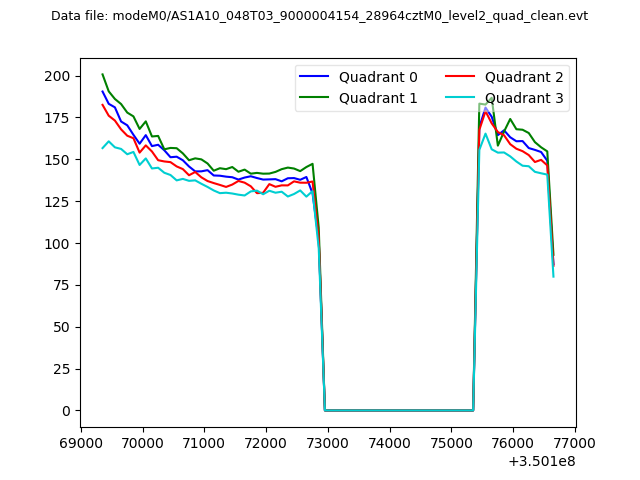 |
|
| Module-wise count rates for Quadrant A Data is divided into 100 sec bins |
 |
 |
| Module-wise count rates for Quadrant B Data is divided into 100 sec bins |
 |
 |
| Module-wise count rates for Quadrant C Data is divided into 100 sec bins |
 |
 |
| Module-wise count rates for Quadrant D Data is divided into 100 sec bins |
 |
 |
| Parameter | Plot |
|---|---|
| CZT HV Monitor |  |
| D_VDD | 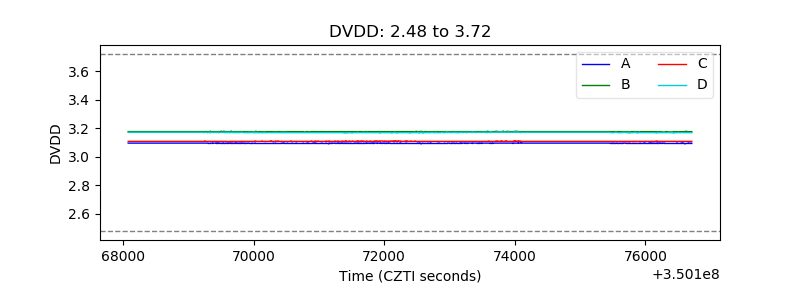 |
| Temperature 1 | 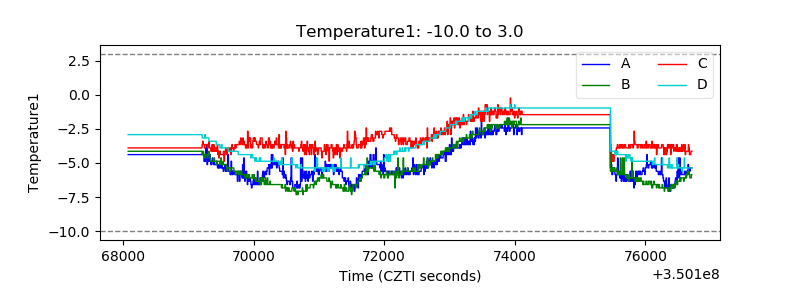 |
| Veto HV Monitor | 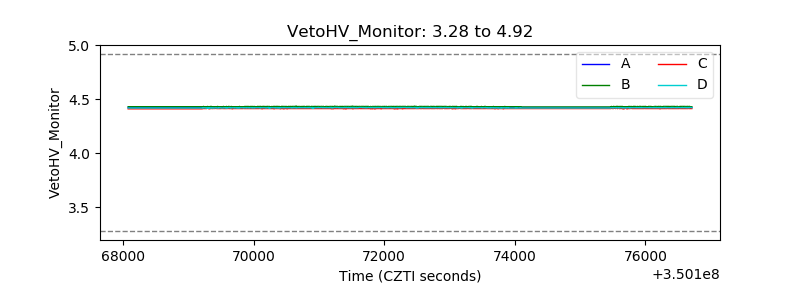 |
| Veto LLD |  |
| Alpha Counter | 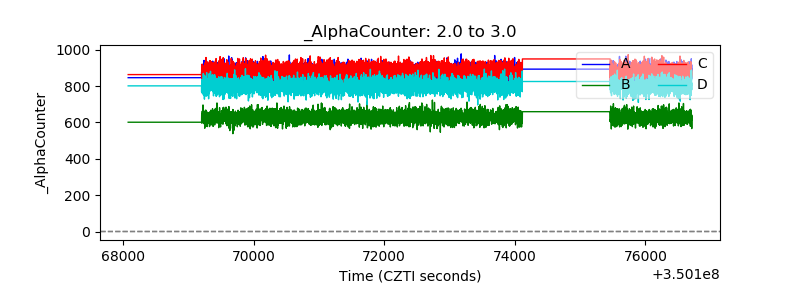 |
| _CPM_Rate | 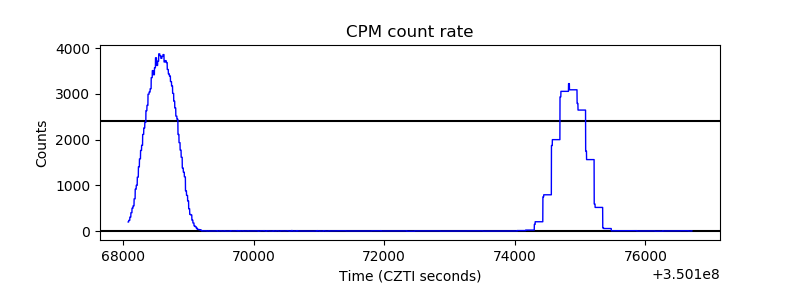 |
| CZT Counter | 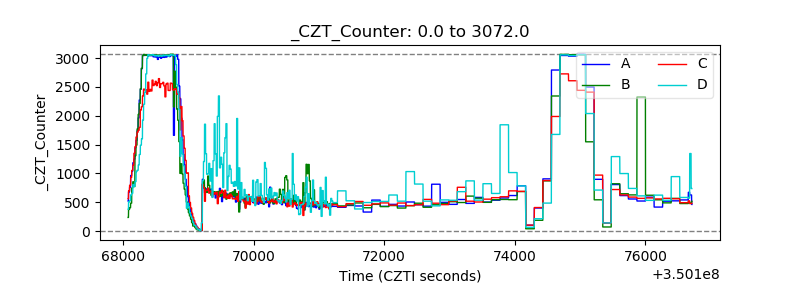 |
| +2.5 Volts monitor |  |
| +5 Volts monitor |  |
| _ROLL_ROT |  |
| _Roll_DEC | 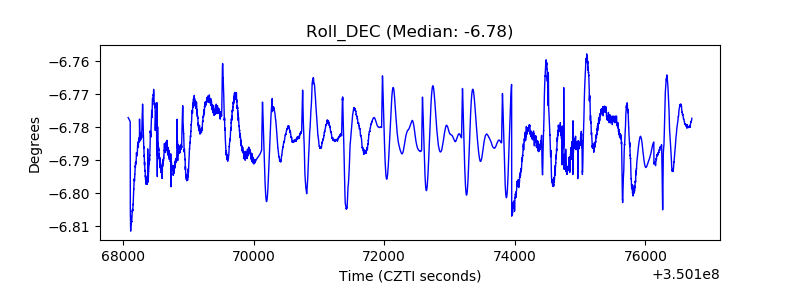 |
| _Roll_RA | 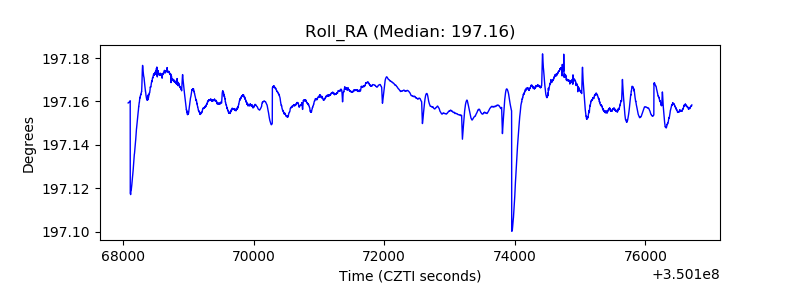 |
| Veto Counter |  |