| Param | Original file | Final file |
|---|---|---|
| Filename | modeM0/AS1A10_048T03_9000004154_28968cztM0_level2.evt | modeM0/AS1A10_048T03_9000004154_28968cztM0_level2_quad_clean.evt |
| Size (bytes) | 578,076,480 | 95,973,120 |
| Size | 551.3 MB | 91.5 MB |
| Events in quadrant A | 3,330,299 | 612,262 |
| Events in quadrant B | 3,614,826 | 628,118 |
| Events in quadrant C | 3,533,882 | 601,490 |
| Events in quadrant D | 6,550,170 | 573,266 |
| Mode M9 | |||
|---|---|---|---|
| Quadrant | BADHDUFLAG | Total packets | Discarded packets |
| A | 0 | 3 | 0 |
| B | 0 | 3 | 0 |
| C | 0 | 3 | 0 |
| D | 0 | 3 | 0 |
| Mode M0 | |||
|---|---|---|---|
| Quadrant | BADHDUFLAG | Total packets | Discarded packets |
| A | 0 | 14453 | 1 |
| B | 0 | 15171 | 1 |
| C | 0 | 14862 | 1 |
| D | 0 | 24337 | 1 |
| Mode SS | |||
|---|---|---|---|
| Quadrant | BADHDUFLAG | Total packets | Discarded packets |
| A | 0 | 144 | 0 |
| B | 0 | 144 | 0 |
| C | 0 | 144 | 0 |
| D | 0 | 144 | 0 |
| Quadrant | Total seconds | Saturated seconds | Saturation percentage |
|---|---|---|---|
| A | 7046 | 126 | 1.788249% |
| B | 7047 | 171 | 2.426564% |
| C | 7047 | 186 | 2.639421% |
| D | 7047 | 550 | 7.804740% |
Noise dominated data is calculated using 1-second bins in cleaned event files. If a bin has >2000 counts, and if more than 50% of those come from <1% of pixels, then it is considered to be noise-dominated and hence unusable.
| Quadrant | # 1 sec bins | Bins with >0 counts | Bins with >2000 counts | High rate bins dominated by noise | Noise dominated (total time) | Noise dominated (detector-on time) | Marked lightcurve |
|---|---|---|---|---|---|---|---|
| A | 7351 | 7048 | 0 | 0 | 0.00% | 0.00% | 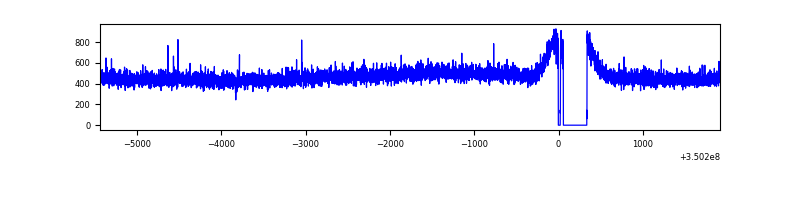 |
| B | 7352 | 7049 | 21 | 21 | 0.29% | 0.30% | 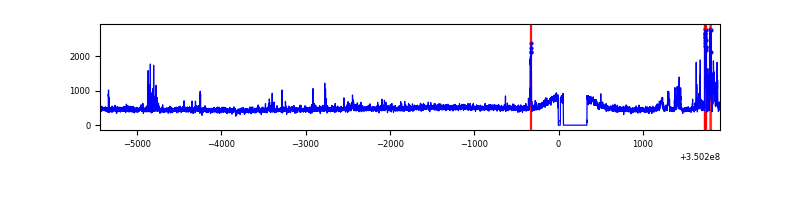 |
| C | 7352 | 7049 | 0 | 0 | 0.00% | 0.00% | 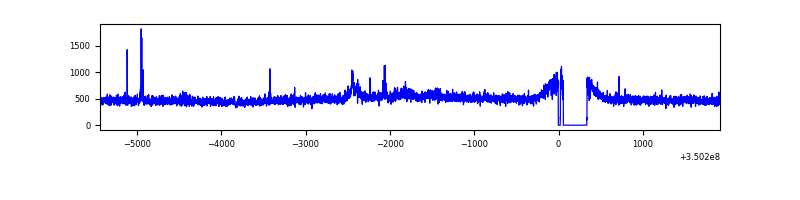 |
| D | 7352 | 7049 | 350 | 350 | 4.76% | 4.97% | 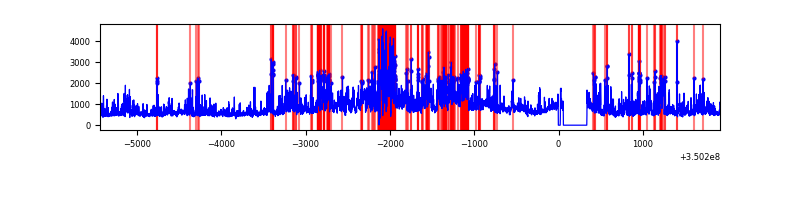 |
Top three noisy pixels from each quadrant. If the there are fewer than three noisy pixels in the level2.evt file, extra rows are filled as -1
| Pixel properties | Quadrant properties | ||||||
|---|---|---|---|---|---|---|---|
| Quadrant | DetID | PixID | Counts | Sigma | Mean | Median | Sigma |
| A | 13 | 254 | 12215 | 64.98 | 861 | 839 | 175.1 |
| A | 3 | 137 | 8664 | 44.7 | 861 | 839 | 175.1 |
| A | 0 | 226 | 7167 | 36.15 | 861 | 839 | 175.1 |
| B | 10 | 246 | 207397 | 1240.67 | 855 | 832 | 166.5 |
| B | 10 | 245 | 42166 | 248.26 | 855 | 832 | 166.5 |
| B | 12 | 111 | 20853 | 120.25 | 855 | 832 | 166.5 |
| C | 14 | 238 | 133722 | 676.75 | 832 | 837 | 196.4 |
| C | 3 | 233 | 120532 | 609.58 | 832 | 837 | 196.4 |
| C | 2 | 114 | 16148 | 77.98 | 832 | 837 | 196.4 |
| D | 1 | 52 | 1916619 | 9817.11 | 816 | 795 | 195.2 |
| D | 8 | 195 | 1366500 | 6998.18 | 816 | 795 | 195.2 |
| D | 13 | 104 | 107967 | 549.17 | 816 | 795 | 195.2 |
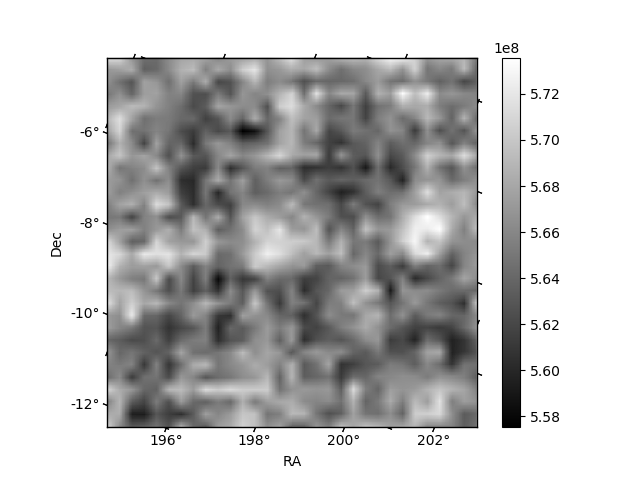
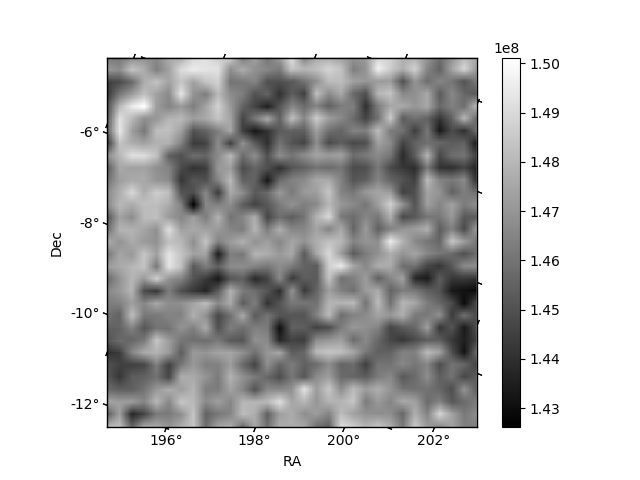
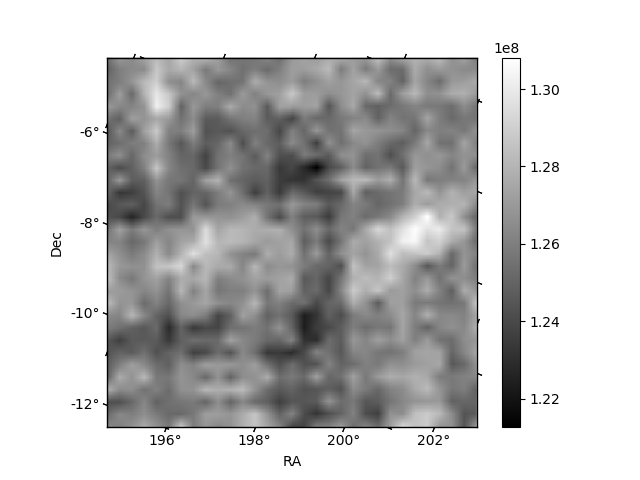
Histogram calculated using DETX and DETY for each event in the final _common_clean file
| Quadrant A | 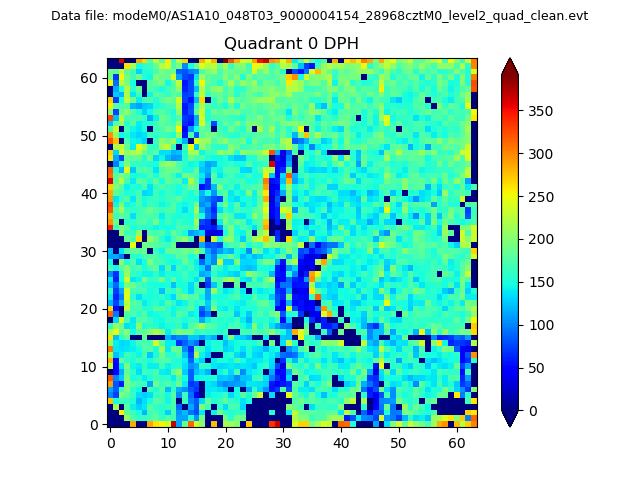 |
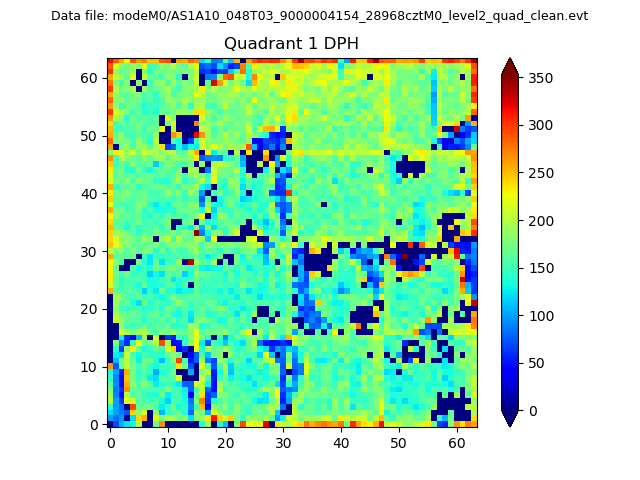 |
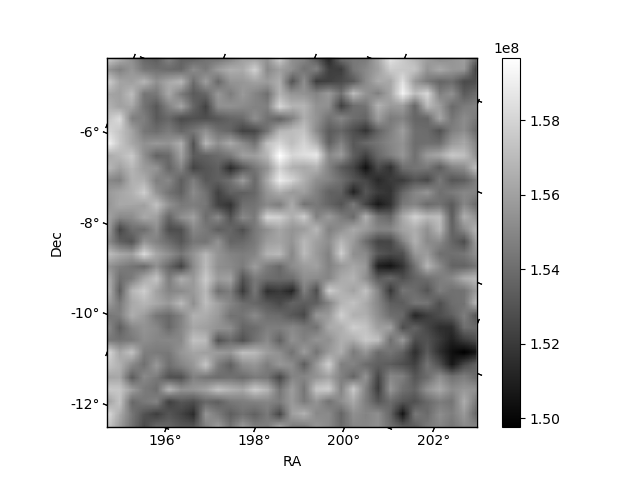
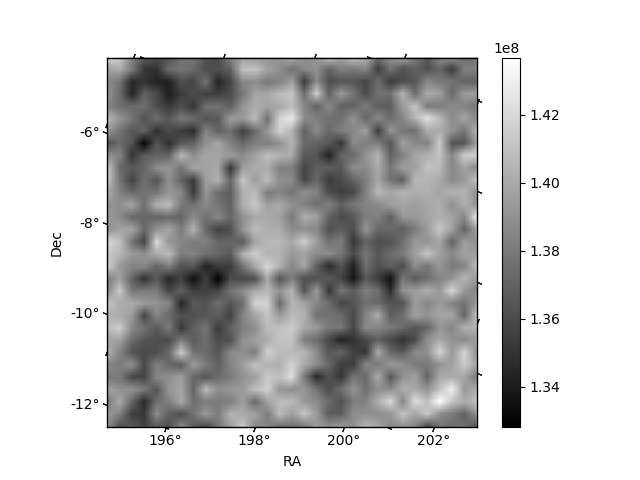
Quadrant B |
|---|---|---|---|
| Quadrant D | 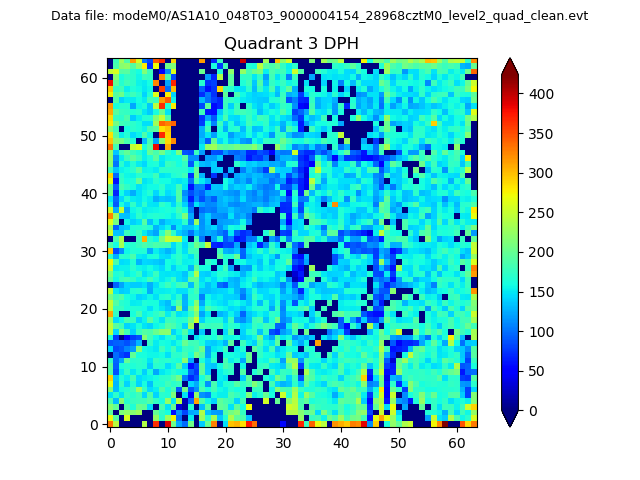 |
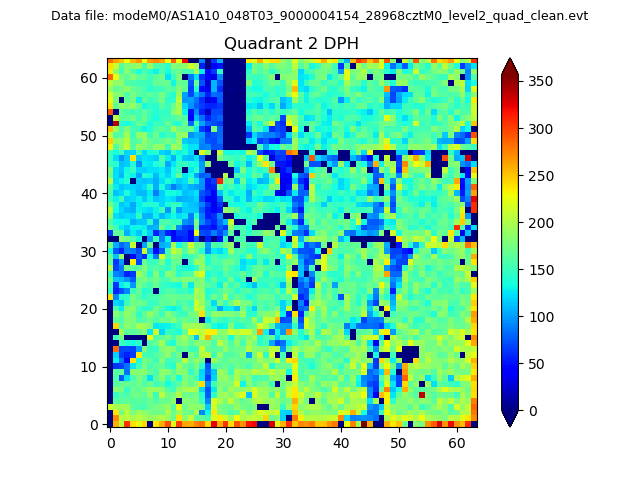 |
Quadrant C |
| Plot type | Count rate plots | Images |
|---|---|---|
| Comparison with Poisson distribution Blue bars denote a histogram of data divided into 1 sec bins. Red curve is a Poisson curve with rate = median count rate of data. |
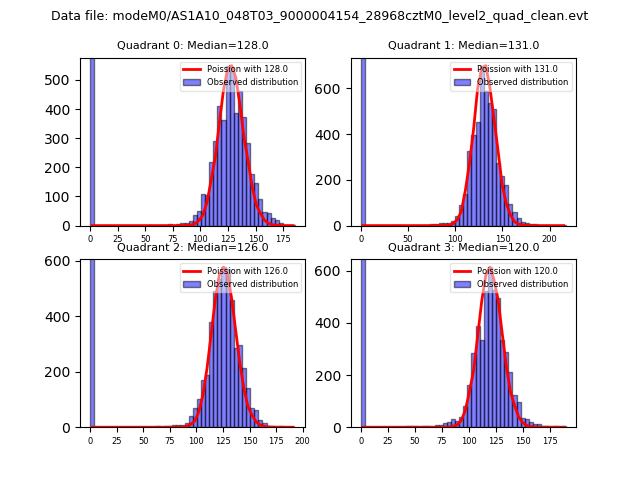 |
 |
| Quadrant-wise count rates Data is divided into 100 sec bins |
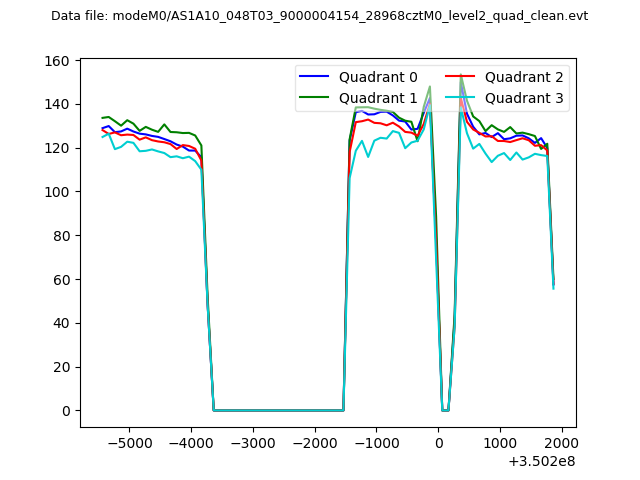 |
|
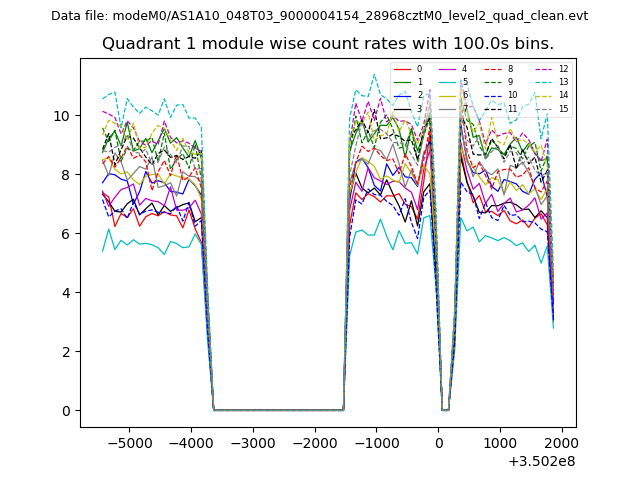
| Module-wise count rates for Quadrant A Data is divided into 100 sec bins |
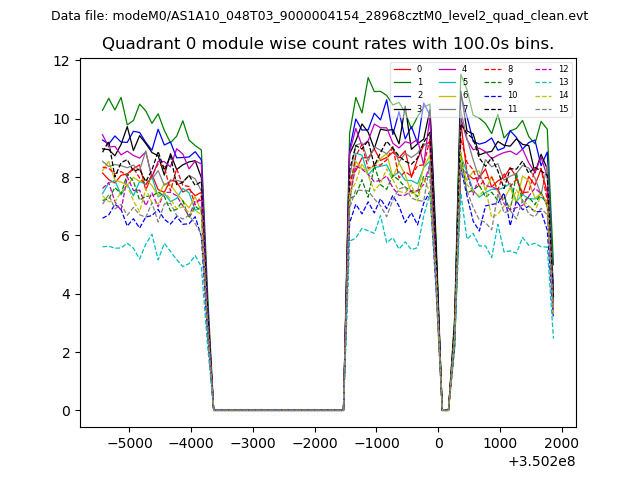 |
 |
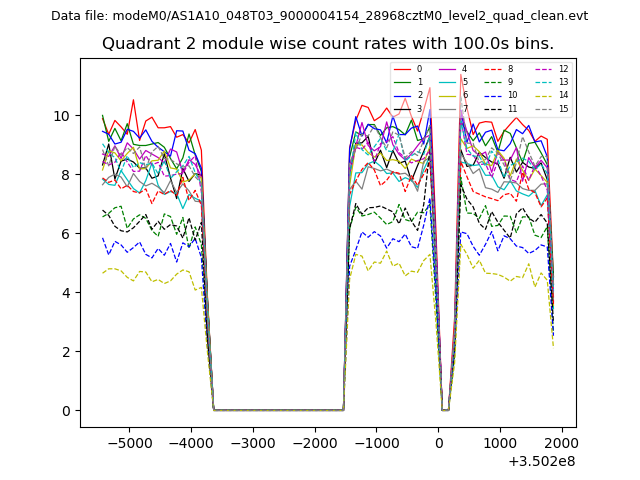
| Module-wise count rates for Quadrant B Data is divided into 100 sec bins |
 |
 |
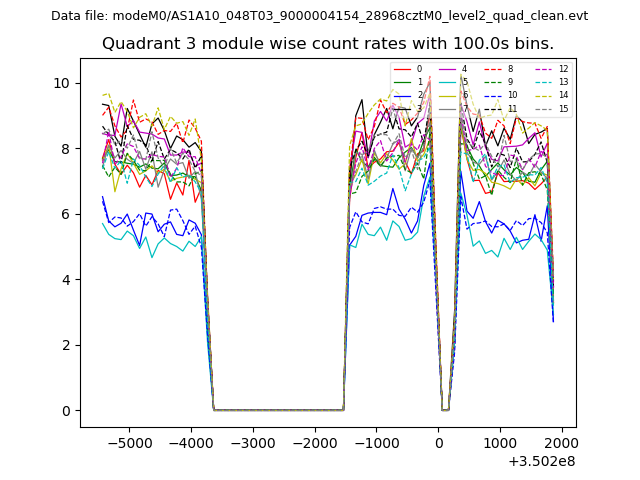
| Module-wise count rates for Quadrant C Data is divided into 100 sec bins |
 |
 |
| Module-wise count rates for Quadrant D Data is divided into 100 sec bins |
 |
 |
| Parameter | Plot |
|---|---|
| CZT HV Monitor | 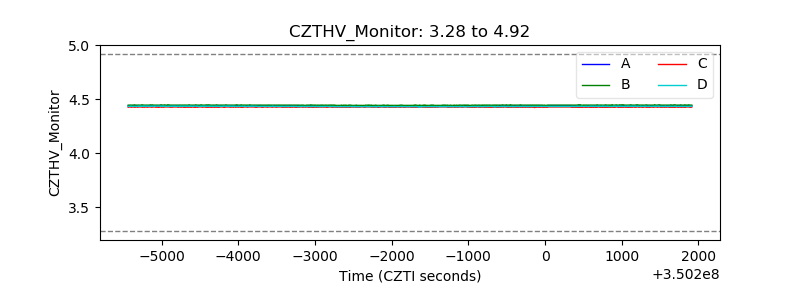 |
| D_VDD | 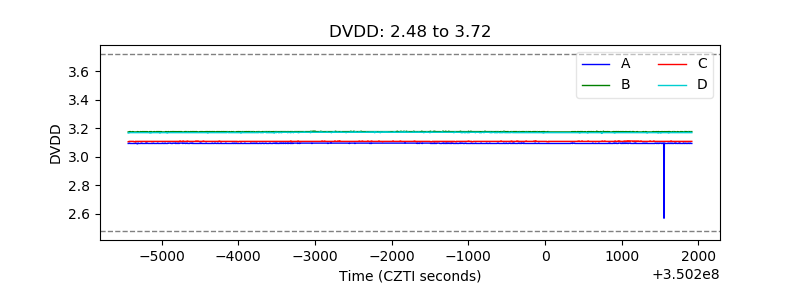 |
| Temperature 1 | 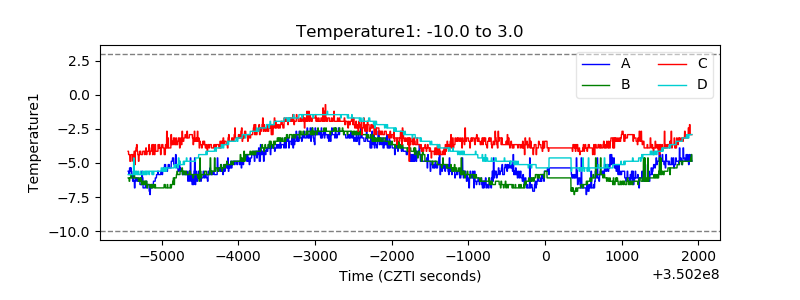 |
| Veto HV Monitor | 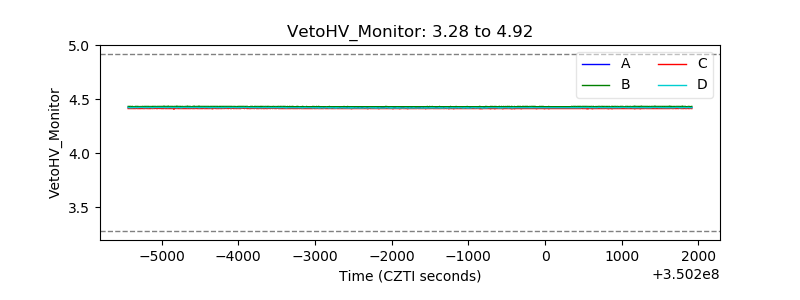 |
| Veto LLD | 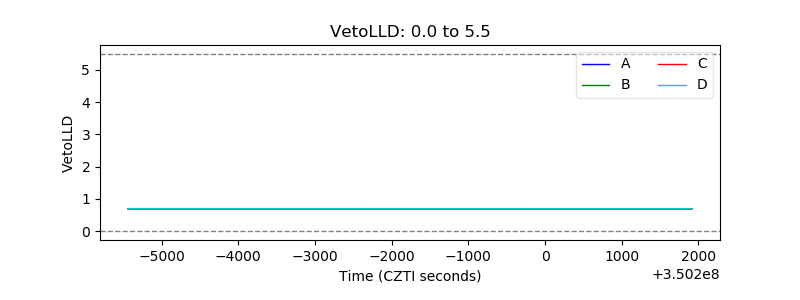 |
| Alpha Counter | 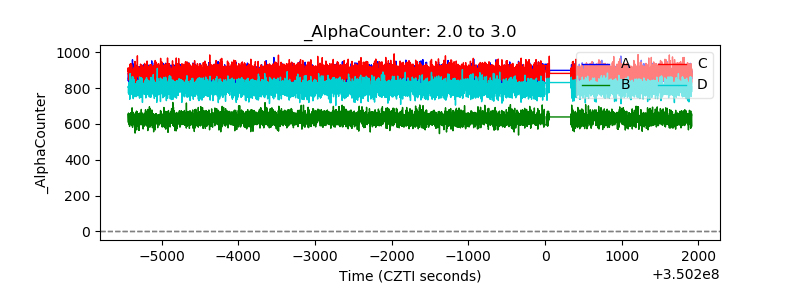 |
| _CPM_Rate | 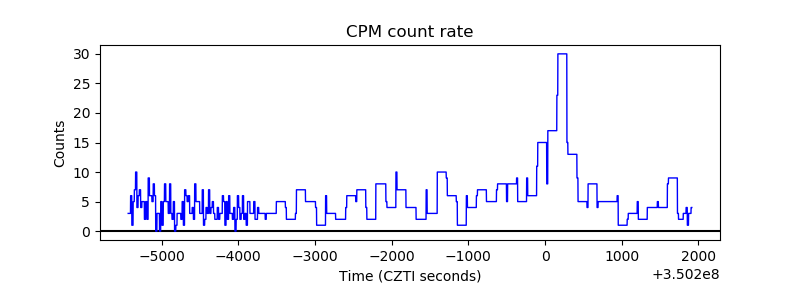 |
| CZT Counter | 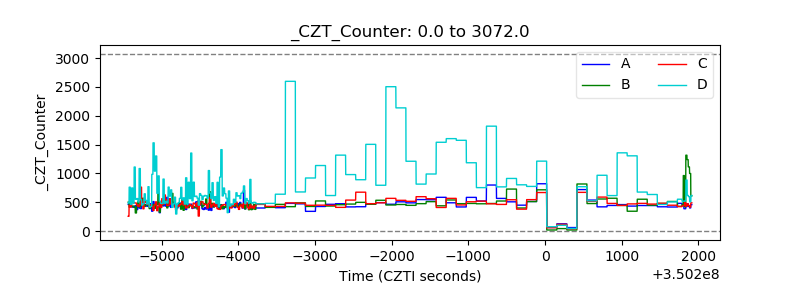 |
| +2.5 Volts monitor | 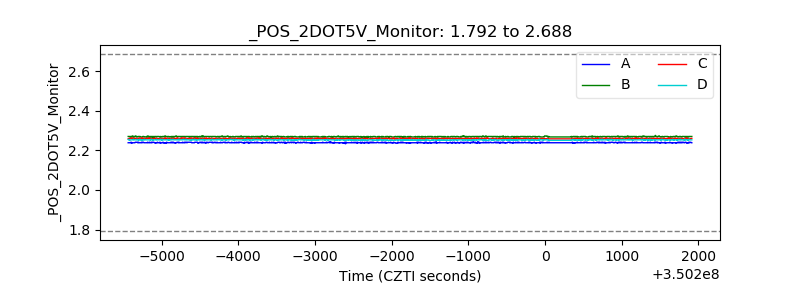 |
| +5 Volts monitor |  |
| _ROLL_ROT | 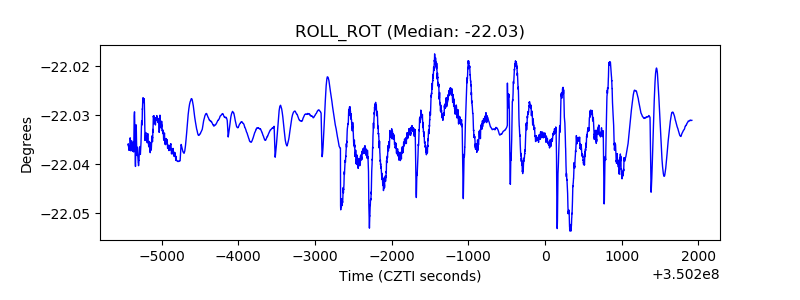 |
| _Roll_DEC | 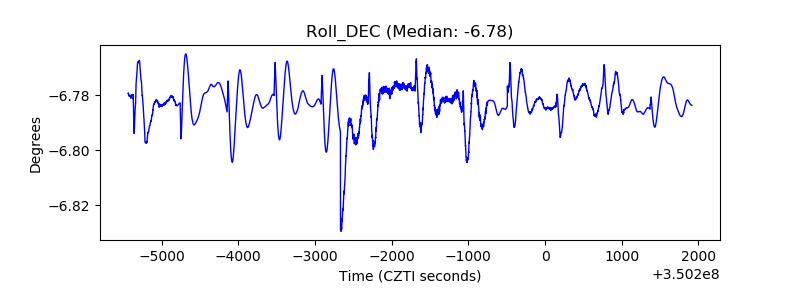 |
| _Roll_RA | 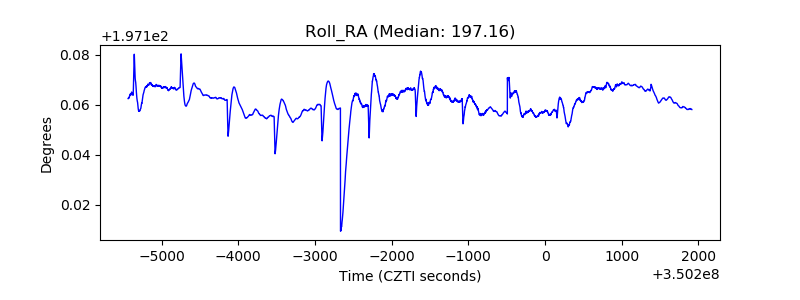 |
| Veto Counter | 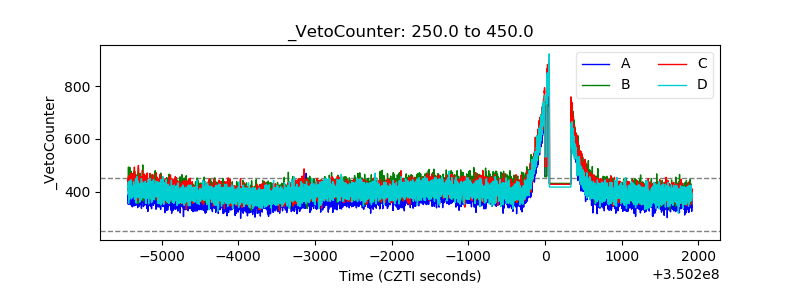 |