| Param | Original file | Final file |
|---|---|---|
| Filename | modeM0/AS1A10_048T03_9000004154_28969cztM0_level2.evt | modeM0/AS1A10_048T03_9000004154_28969cztM0_level2_quad_clean.evt |
| Size (bytes) | 661,524,480 | 105,163,200 |
| Size | 630.9 MB | 100.3 MB |
| Events in quadrant A | 3,677,528 | 673,071 |
| Events in quadrant B | 4,029,727 | 689,470 |
| Events in quadrant C | 3,821,435 | 662,424 |
| Events in quadrant D | 7,982,286 | 621,568 |
| Mode M9 | |||
|---|---|---|---|
| Quadrant | BADHDUFLAG | Total packets | Discarded packets |
| A | 0 | 2 | 0 |
| B | 0 | 3 | 0 |
| C | 0 | 3 | 0 |
| D | 0 | 3 | 0 |
| Mode M0 | |||
|---|---|---|---|
| Quadrant | BADHDUFLAG | Total packets | Discarded packets |
| A | 0 | 16003 | 2 |
| B | 0 | 16896 | 2 |
| C | 0 | 16178 | 3 |
| D | 0 | 29167 | 2 |
| Mode SS | |||
|---|---|---|---|
| Quadrant | BADHDUFLAG | Total packets | Discarded packets |
| A | 0 | 156 | 0 |
| B | 0 | 156 | 0 |
| C | 0 | 156 | 0 |
| D | 0 | 156 | 0 |
| Quadrant | Total seconds | Saturated seconds | Saturation percentage |
|---|---|---|---|
| A | 7735 | 200 | 2.585650% |
| B | 7735 | 243 | 3.141564% |
| C | 7734 | 244 | 3.154900% |
| D | 7734 | 821 | 10.615464% |
Noise dominated data is calculated using 1-second bins in cleaned event files. If a bin has >2000 counts, and if more than 50% of those come from <1% of pixels, then it is considered to be noise-dominated and hence unusable.
| Quadrant | # 1 sec bins | Bins with >0 counts | Bins with >2000 counts | High rate bins dominated by noise | Noise dominated (total time) | Noise dominated (detector-on time) | Marked lightcurve |
|---|---|---|---|---|---|---|---|
| A | 7868 | 7740 | 0 | 0 | 0.00% | 0.00% | 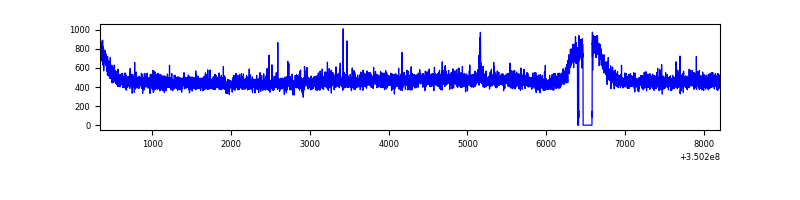 |
| B | 7868 | 7740 | 32 | 32 | 0.41% | 0.41% | 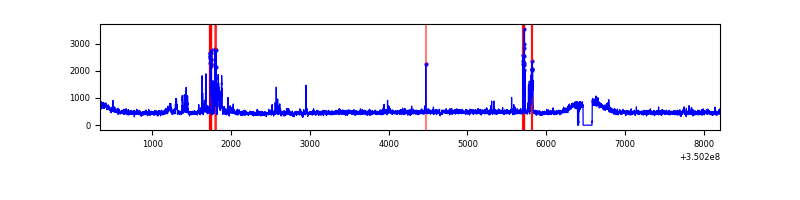 |
| C | 7867 | 7739 | 0 | 0 | 0.00% | 0.00% | 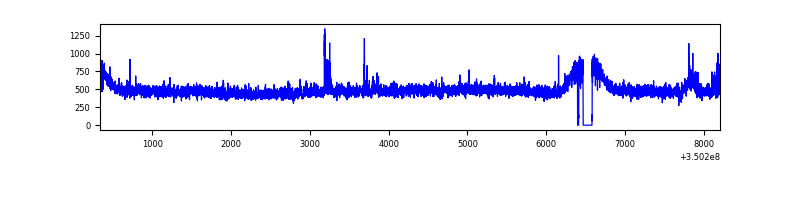 |
| D | 7867 | 7739 | 493 | 493 | 6.27% | 6.37% | 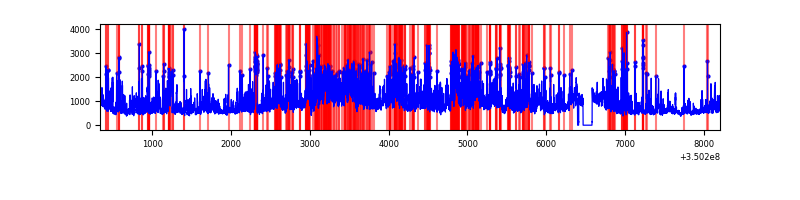 |
Top three noisy pixels from each quadrant. If the there are fewer than three noisy pixels in the level2.evt file, extra rows are filled as -1
| Pixel properties | Quadrant properties | ||||||
|---|---|---|---|---|---|---|---|
| Quadrant | DetID | PixID | Counts | Sigma | Mean | Median | Sigma |
| A | 13 | 254 | 13113 | 62.71 | 950 | 927 | 194.3 |
| A | 3 | 137 | 9792 | 45.62 | 950 | 927 | 194.3 |
| A | 0 | 226 | 8370 | 38.31 | 950 | 927 | 194.3 |
| B | 10 | 246 | 238457 | 1304.31 | 940 | 915 | 182.1 |
| B | 0 | 229 | 55238 | 298.28 | 940 | 915 | 182.1 |
| B | 12 | 111 | 22997 | 121.25 | 940 | 915 | 182.1 |
| C | 14 | 238 | 145856 | 668.02 | 918 | 923 | 217.0 |
| C | 2 | 16 | 37004 | 166.3 | 918 | 923 | 217.0 |
| C | 3 | 233 | 35144 | 157.73 | 918 | 923 | 217.0 |
| D | 1 | 52 | 2725797 | 12673.29 | 898 | 871 | 215.0 |
| D | 8 | 195 | 1608290 | 7475.9 | 898 | 871 | 215.0 |
| D | 13 | 104 | 86354 | 397.57 | 898 | 871 | 215.0 |
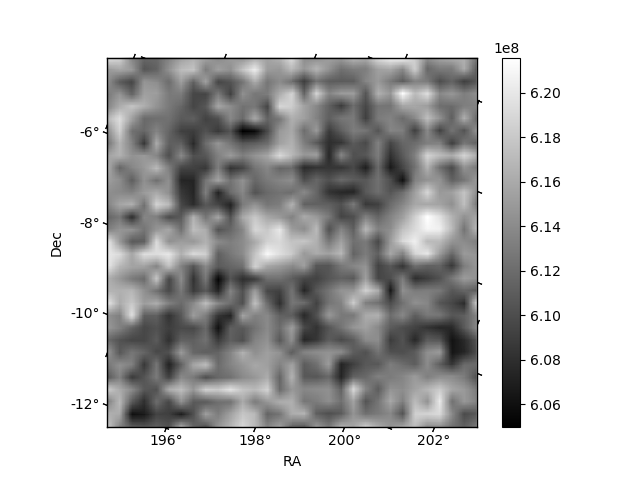
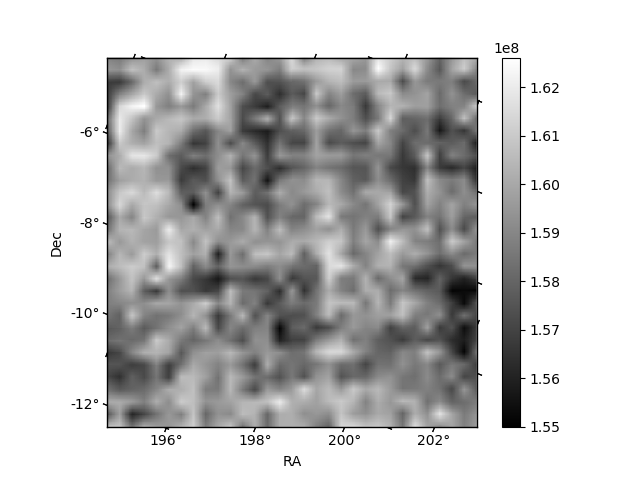
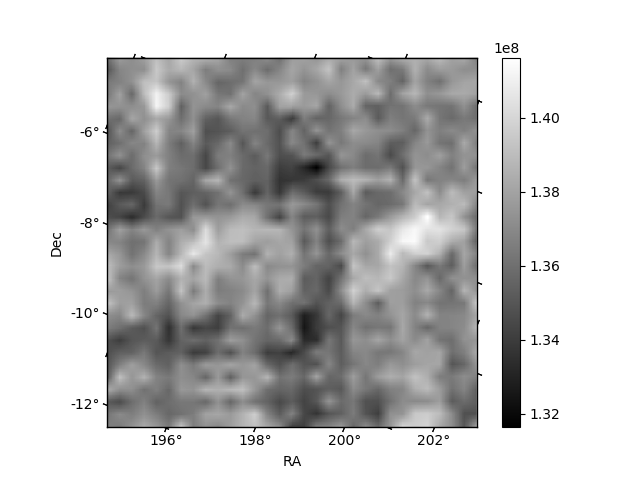
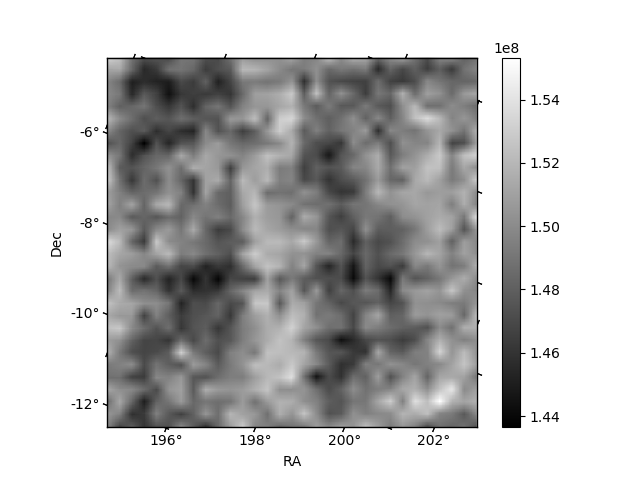
Histogram calculated using DETX and DETY for each event in the final _common_clean file
| Quadrant A | 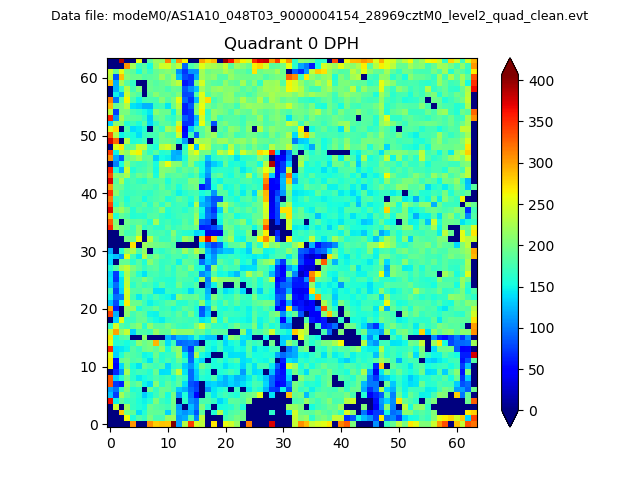 |
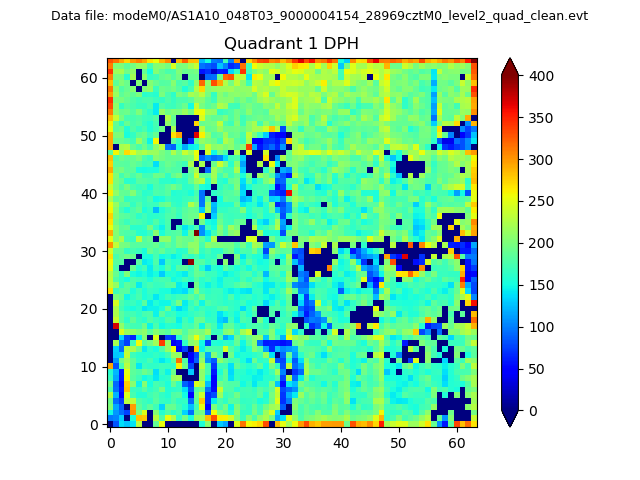 |
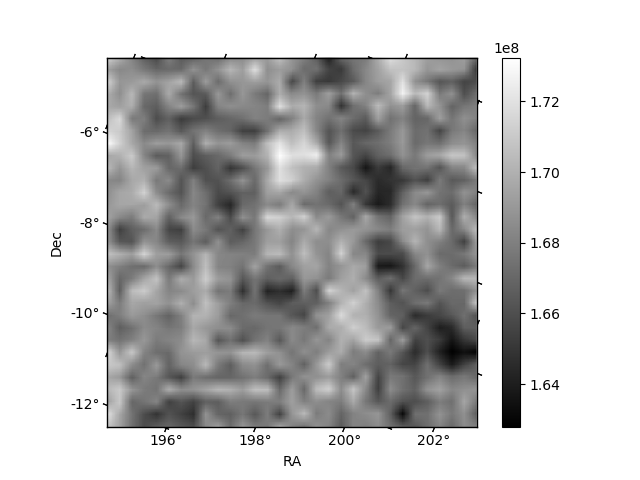
Quadrant B |
|---|---|---|---|
| Quadrant D | 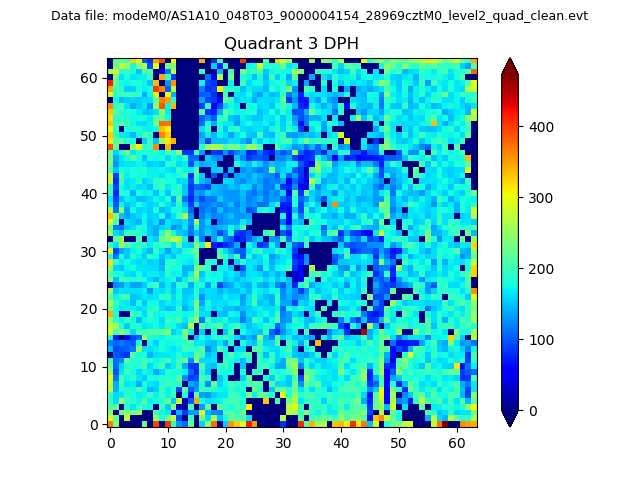 |
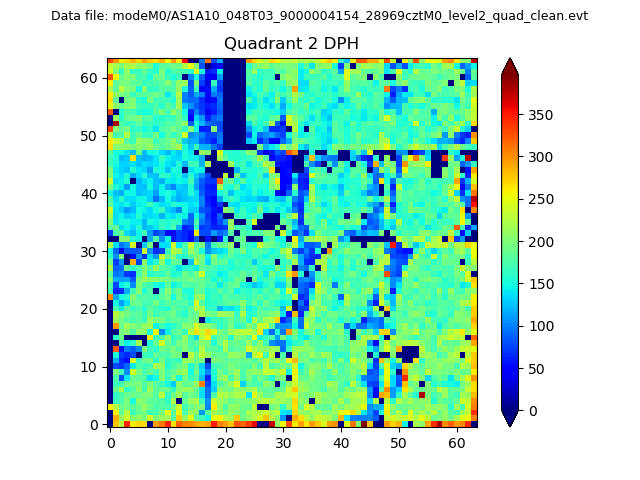 |
Quadrant C |
| Plot type | Count rate plots | Images |
|---|---|---|
| Comparison with Poisson distribution Blue bars denote a histogram of data divided into 1 sec bins. Red curve is a Poisson curve with rate = median count rate of data. |
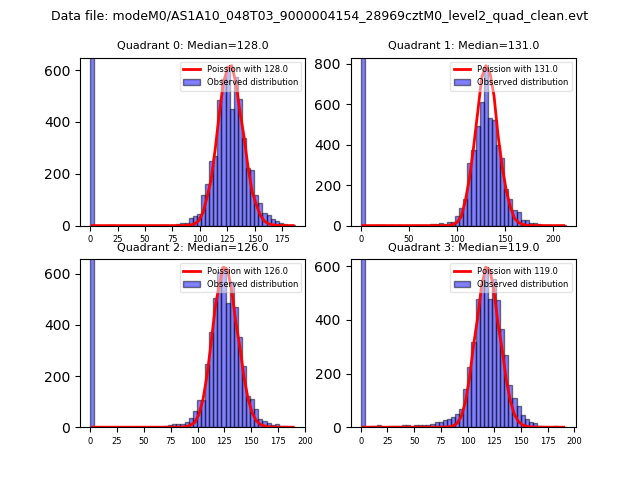 |
 |
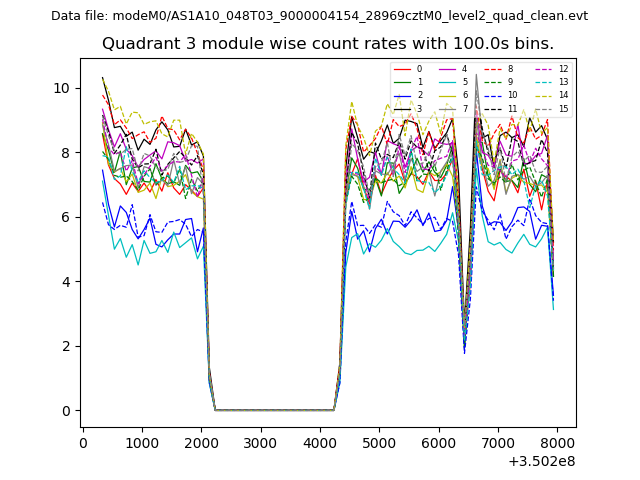
| Quadrant-wise count rates Data is divided into 100 sec bins |
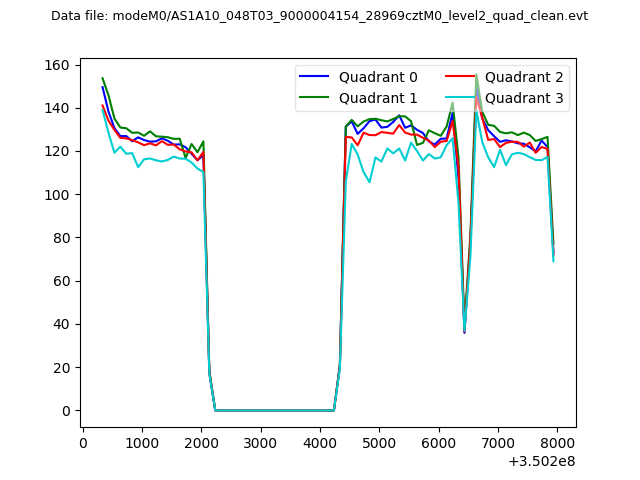 |
|
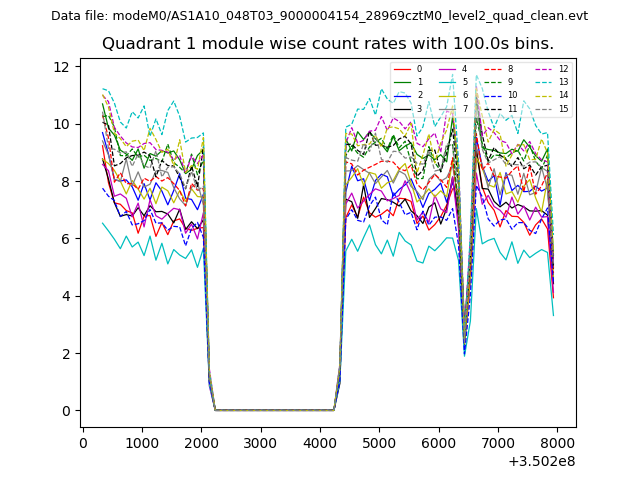
| Module-wise count rates for Quadrant A Data is divided into 100 sec bins |
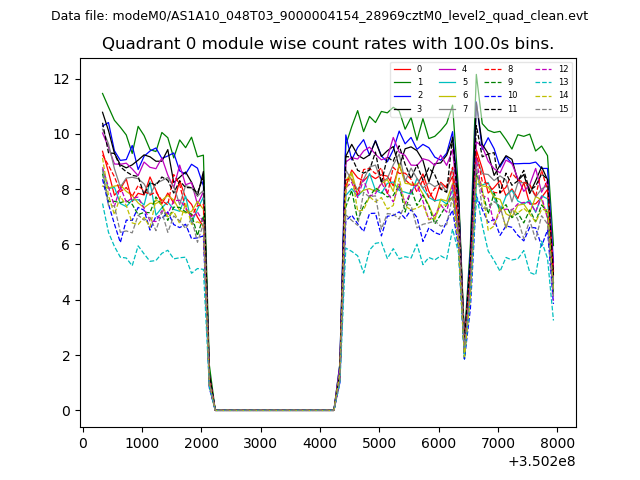 |
 |
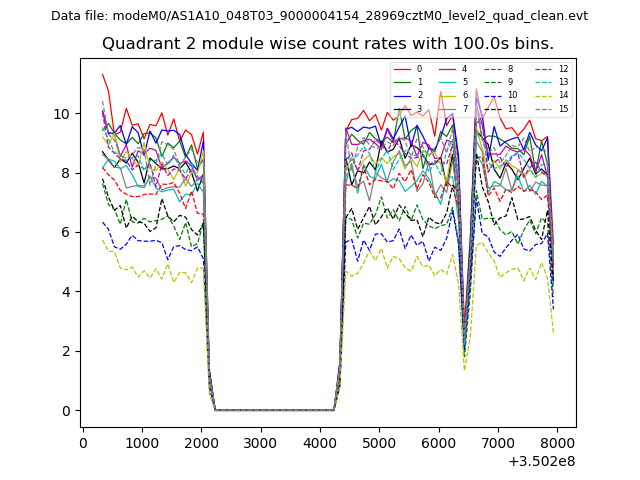
| Module-wise count rates for Quadrant B Data is divided into 100 sec bins |
 |
 |
| Module-wise count rates for Quadrant C Data is divided into 100 sec bins |
 |
 |
| Module-wise count rates for Quadrant D Data is divided into 100 sec bins |
 |
 |
| Parameter | Plot |
|---|---|
| CZT HV Monitor | 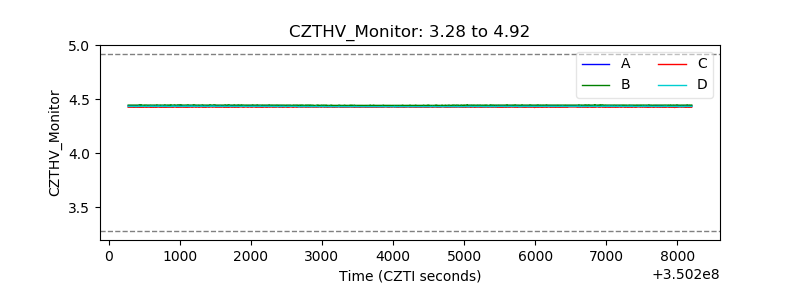 |
| D_VDD | 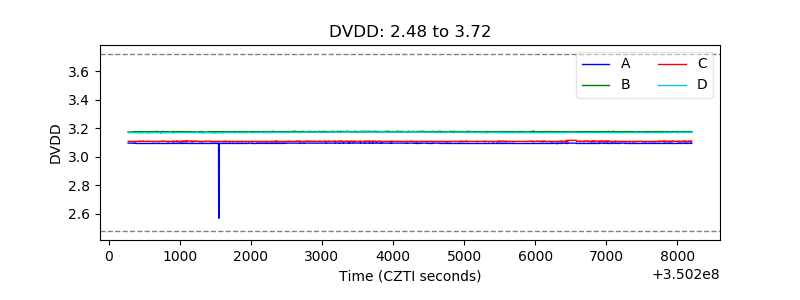 |
| Temperature 1 | 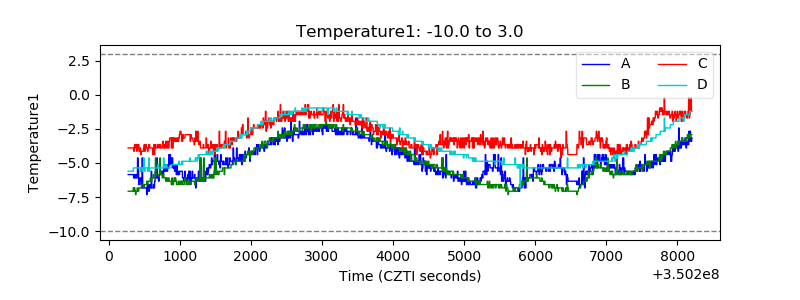 |
| Veto HV Monitor | 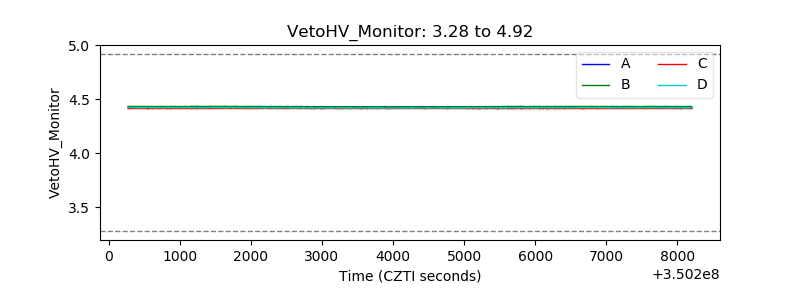 |
| Veto LLD | 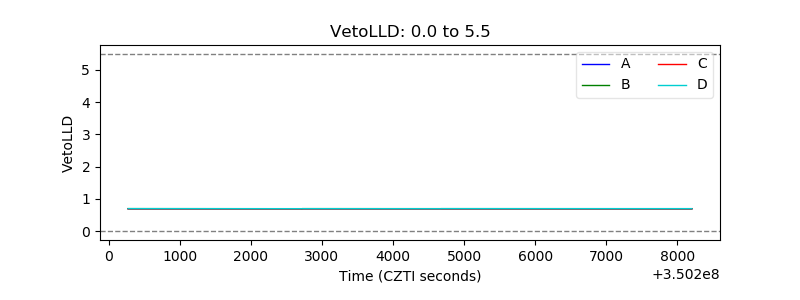 |
| Alpha Counter | 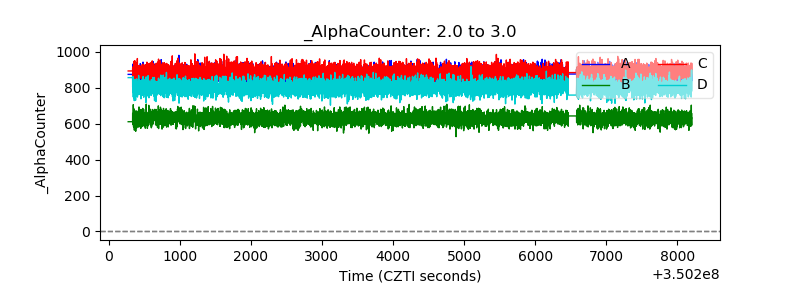 |
| _CPM_Rate | 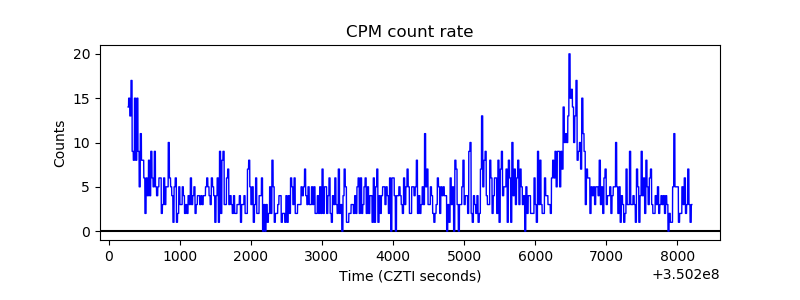 |
| CZT Counter | 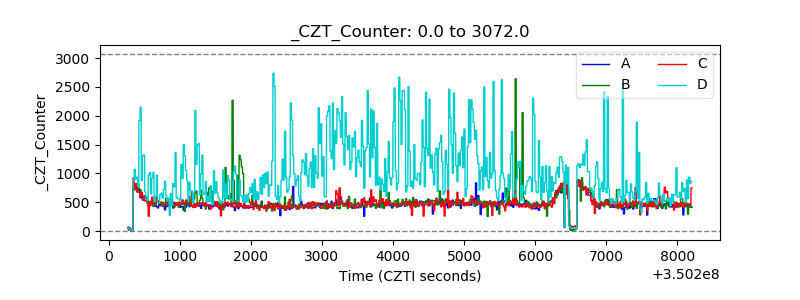 |
| +2.5 Volts monitor |  |
| +5 Volts monitor |  |
| _ROLL_ROT | 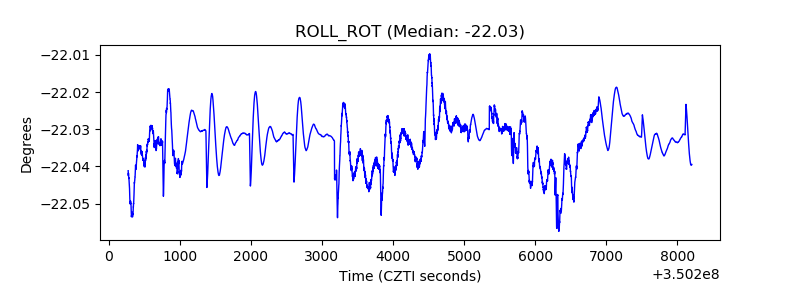 |
| _Roll_DEC | 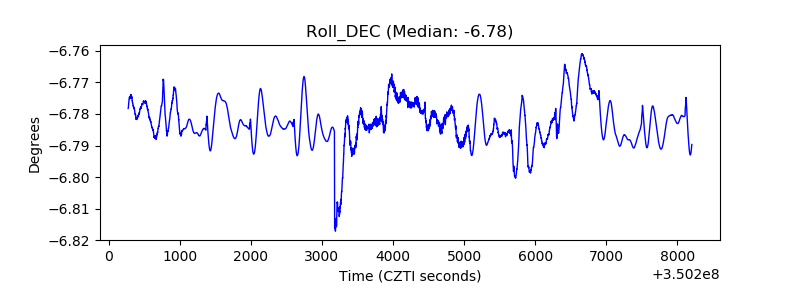 |
| _Roll_RA | 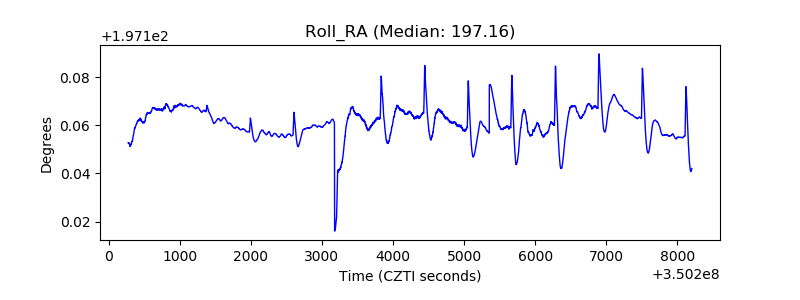 |
| Veto Counter | 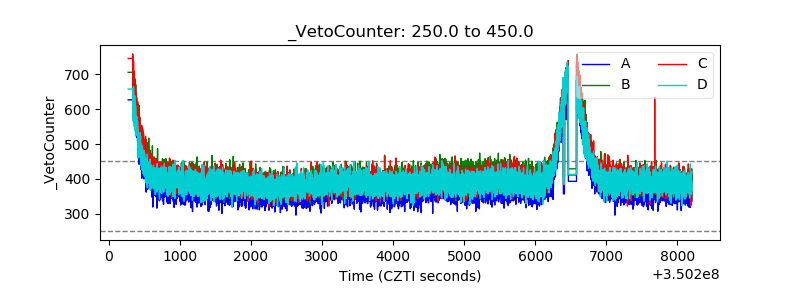 |