| Param | Original file | Final file |
|---|---|---|
| Filename | modeM0/AS1A10_048T03_9000004154_28974cztM0_level2.evt | modeM0/AS1A10_048T03_9000004154_28974cztM0_level2_quad_clean.evt |
| Size (bytes) | 1,953,892,800 | 237,660,480 |
| Size | 1.8 GB | 226.7 MB |
| Events in quadrant A | 10,347,074 | 1,486,126 |
| Events in quadrant B | 10,789,659 | 1,509,911 |
| Events in quadrant C | 10,571,646 | 1,456,001 |
| Events in quadrant D | 26,016,225 | 1,263,618 |
| Mode M9 | |||
|---|---|---|---|
| Quadrant | BADHDUFLAG | Total packets | Discarded packets |
| A | 0 | 25 | 0 |
| B | 0 | 25 | 0 |
| C | 0 | 25 | 0 |
| D | 0 | 25 | 0 |
| Mode M0 | |||
|---|---|---|---|
| Quadrant | BADHDUFLAG | Total packets | Discarded packets |
| A | 0 | 44719 | 4 |
| B | 0 | 45838 | 5 |
| C | 0 | 44814 | 4 |
| D | 0 | 92279 | 4 |
| Mode SS | |||
|---|---|---|---|
| Quadrant | BADHDUFLAG | Total packets | Discarded packets |
| A | 0 | 436 | 0 |
| B | 0 | 436 | 0 |
| C | 0 | 436 | 0 |
| D | 0 | 436 | 0 |
| Quadrant | Total seconds | Saturated seconds | Saturation percentage |
|---|---|---|---|
| A | 21513 | 240 | 1.115605% |
| B | 21512 | 298 | 1.385273% |
| C | 21512 | 337 | 1.566567% |
| D | 21512 | 4259 | 19.798252% |
Noise dominated data is calculated using 1-second bins in cleaned event files. If a bin has >2000 counts, and if more than 50% of those come from <1% of pixels, then it is considered to be noise-dominated and hence unusable.
| Quadrant | # 1 sec bins | Bins with >0 counts | Bins with >2000 counts | High rate bins dominated by noise | Noise dominated (total time) | Noise dominated (detector-on time) | Marked lightcurve |
|---|---|---|---|---|---|---|---|
| A | 31673 | 21519 | 28 | 28 | 0.09% | 0.13% | 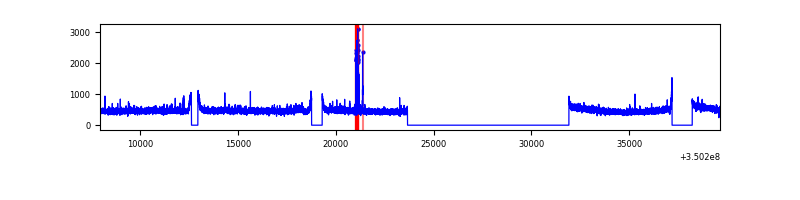 |
| B | 31673 | 21518 | 51 | 51 | 0.16% | 0.24% | 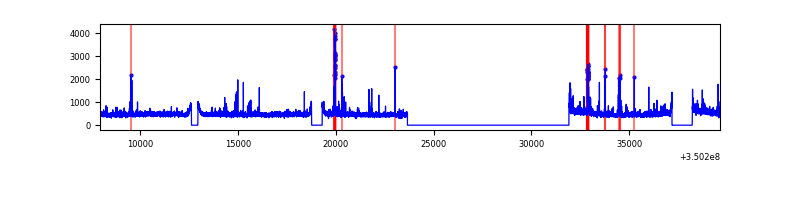 |
| C | 31673 | 21519 | 3 | 3 | 0.01% | 0.01% | 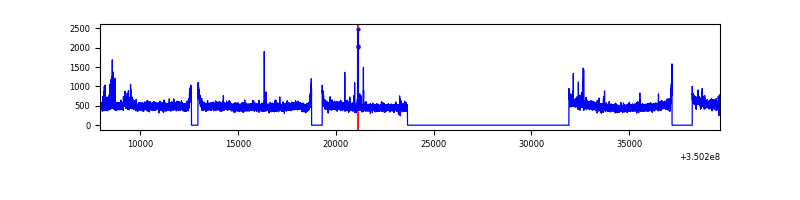 |
| D | 31673 | 21518 | 3690 | 3690 | 11.65% | 17.15% | 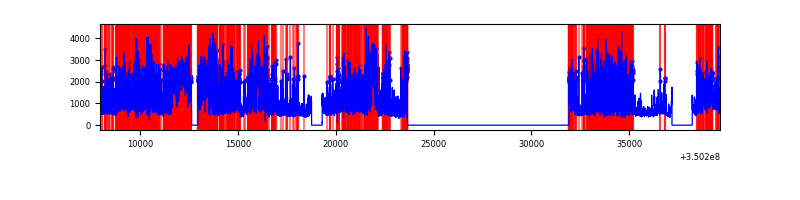 |
Top three noisy pixels from each quadrant. If the there are fewer than three noisy pixels in the level2.evt file, extra rows are filled as -1
| Pixel properties | Quadrant properties | ||||||
|---|---|---|---|---|---|---|---|
| Quadrant | DetID | PixID | Counts | Sigma | Mean | Median | Sigma |
| A | 12 | 210 | 119747 | 220.99 | 2628 | 2569 | 530.2 |
| A | 13 | 6 | 53052 | 95.21 | 2628 | 2569 | 530.2 |
| A | 1 | 113 | 39101 | 68.9 | 2628 | 2569 | 530.2 |
| B | 10 | 245 | 307230 | 607.29 | 2607 | 2538 | 501.7 |
| B | 10 | 246 | 114732 | 223.62 | 2607 | 2538 | 501.7 |
| B | 12 | 111 | 63053 | 120.61 | 2607 | 2538 | 501.7 |
| C | 14 | 238 | 406909 | 679.14 | 2535 | 2560 | 595.4 |
| C | 3 | 233 | 138662 | 228.6 | 2535 | 2560 | 595.4 |
| C | 2 | 16 | 59377 | 95.43 | 2535 | 2560 | 595.4 |
| D | 1 | 52 | 7550346 | 13615.73 | 2332 | 2272 | 554.4 |
| D | 8 | 195 | 4482434 | 8081.62 | 2332 | 2272 | 554.4 |
| D | 7 | 80 | 3140294 | 5660.58 | 2332 | 2272 | 554.4 |
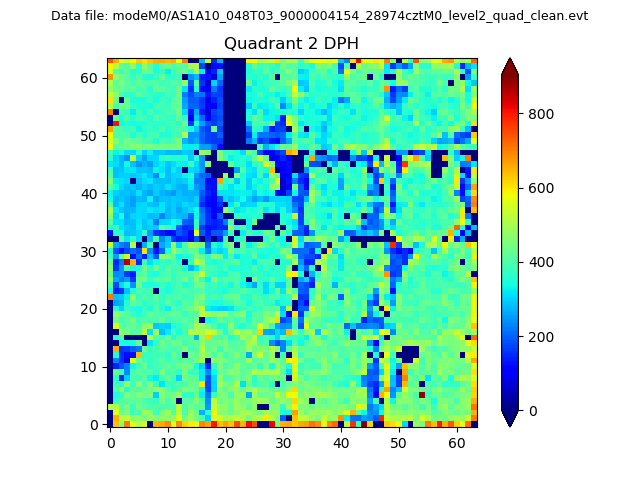
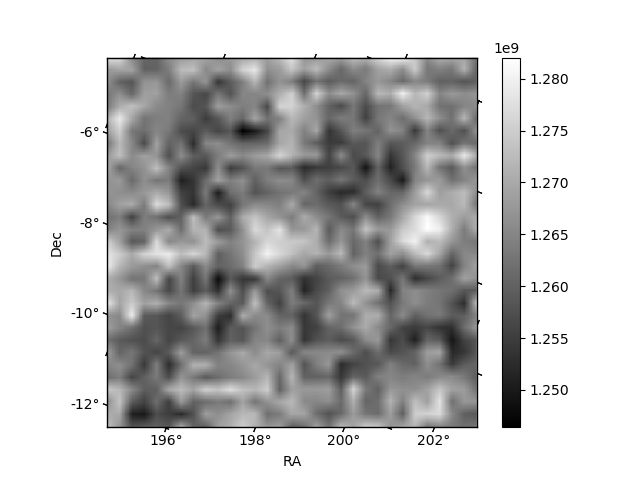
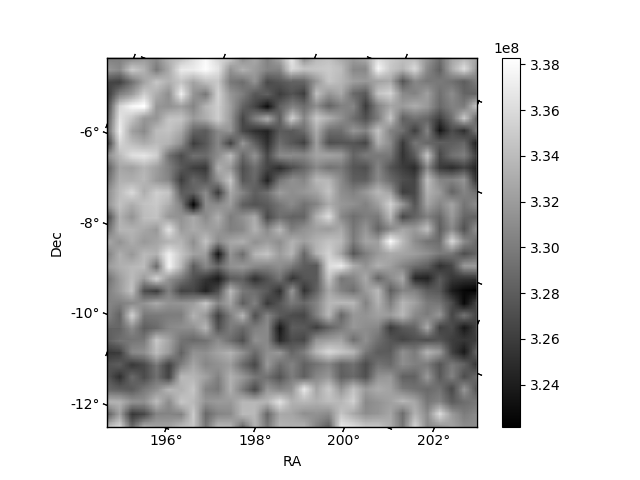
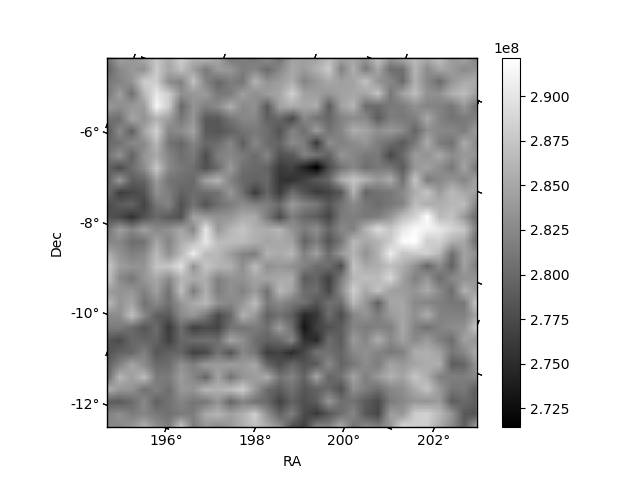
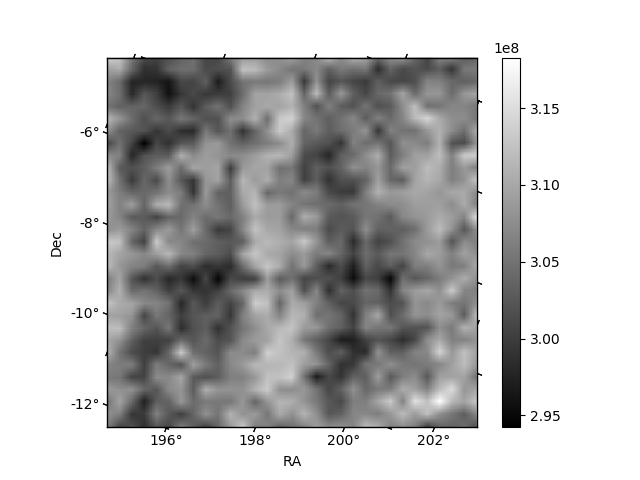
Histogram calculated using DETX and DETY for each event in the final _common_clean file
| Quadrant A | 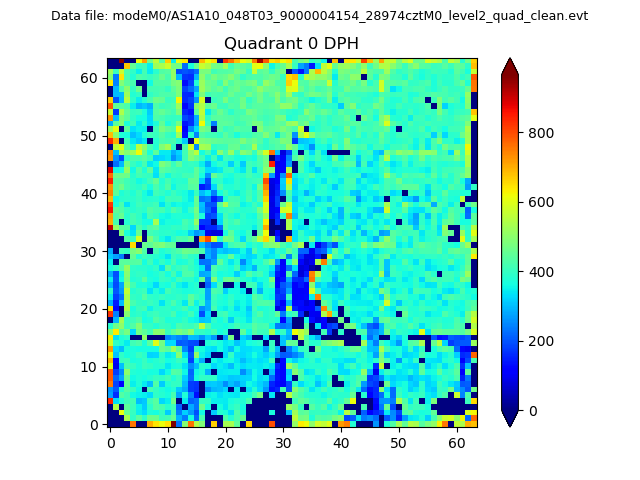 |
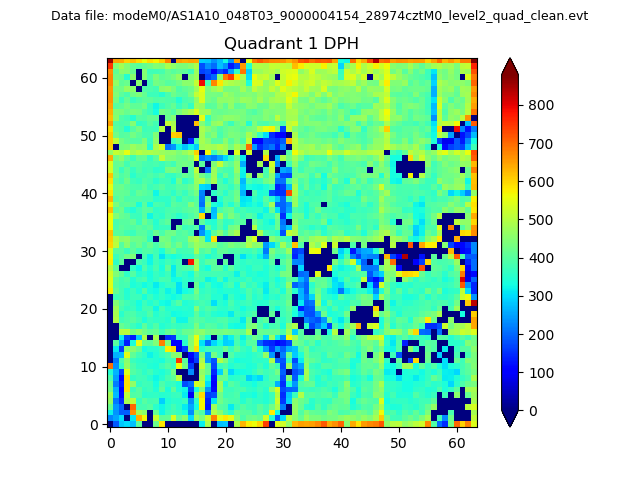 |
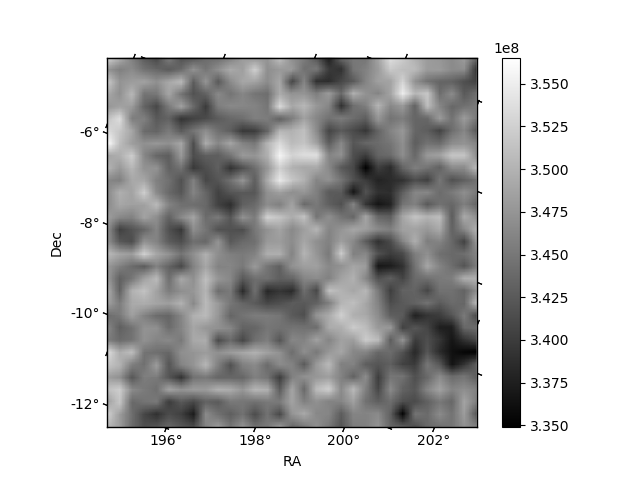
Quadrant B |
|---|---|---|---|
| Quadrant D | 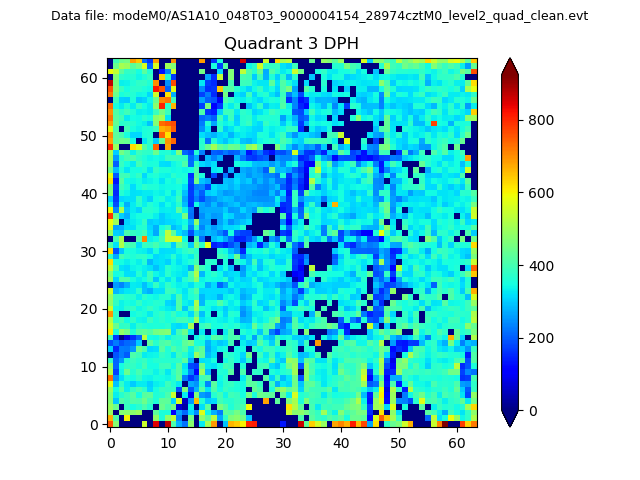 |
 |
Quadrant C |
| Plot type | Count rate plots | Images |
|---|---|---|
| Comparison with Poisson distribution Blue bars denote a histogram of data divided into 1 sec bins. Red curve is a Poisson curve with rate = median count rate of data. |
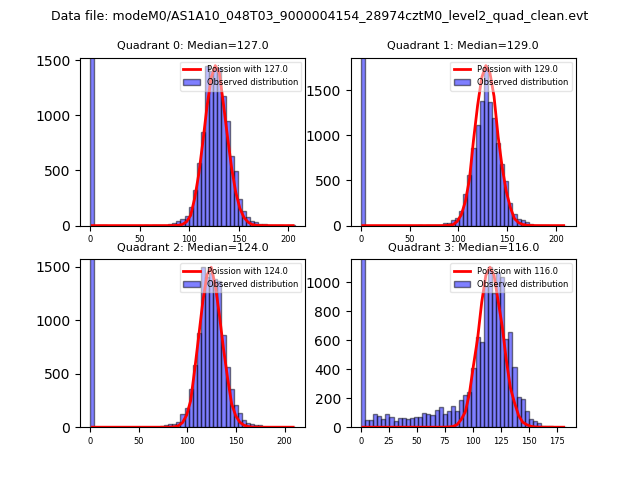 |
 |
| Quadrant-wise count rates Data is divided into 100 sec bins |
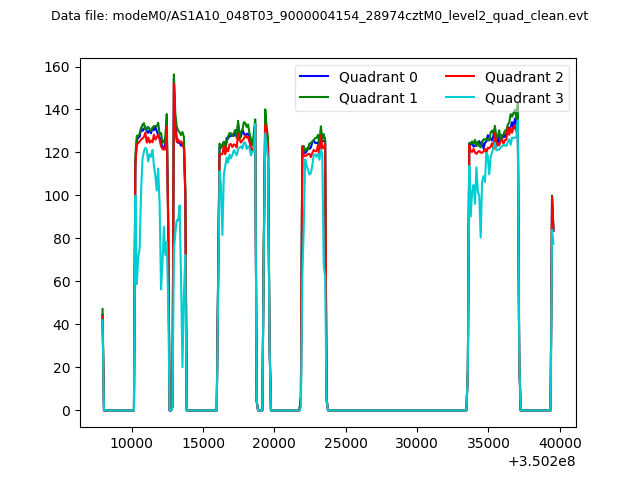 |
|
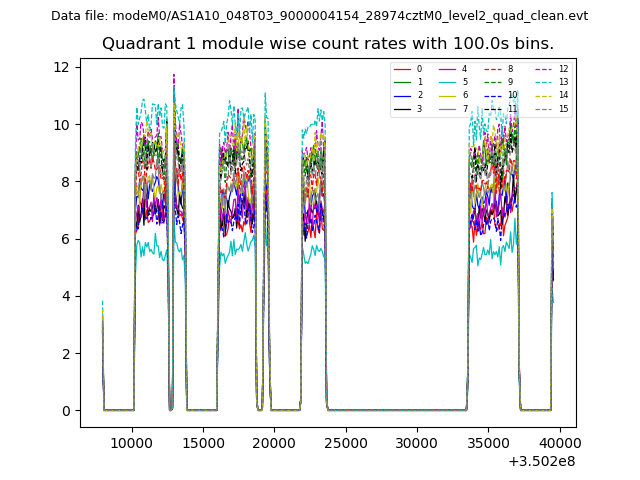
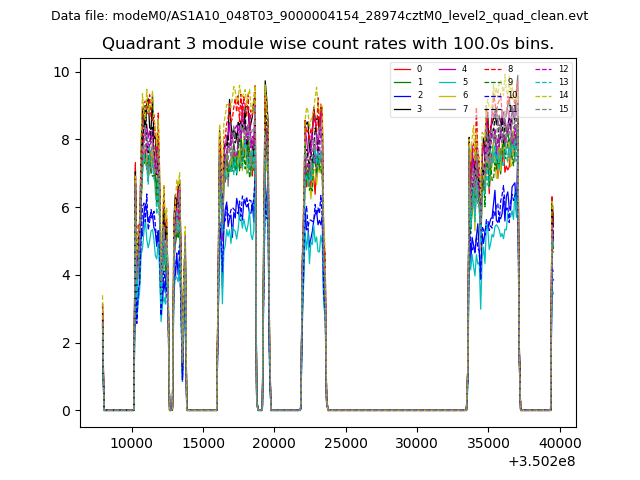
| Module-wise count rates for Quadrant A Data is divided into 100 sec bins |
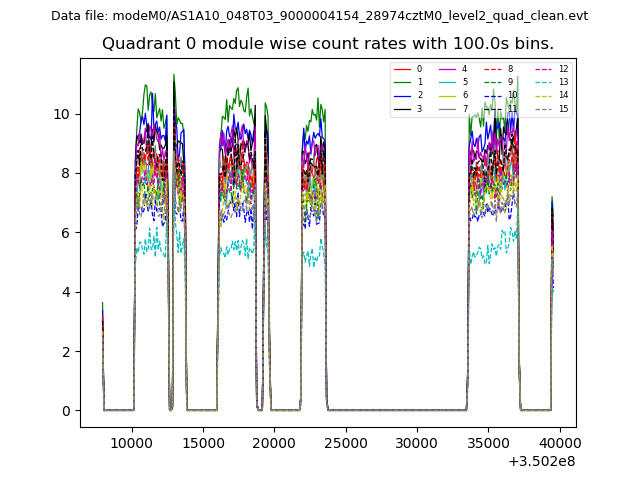 |
 |
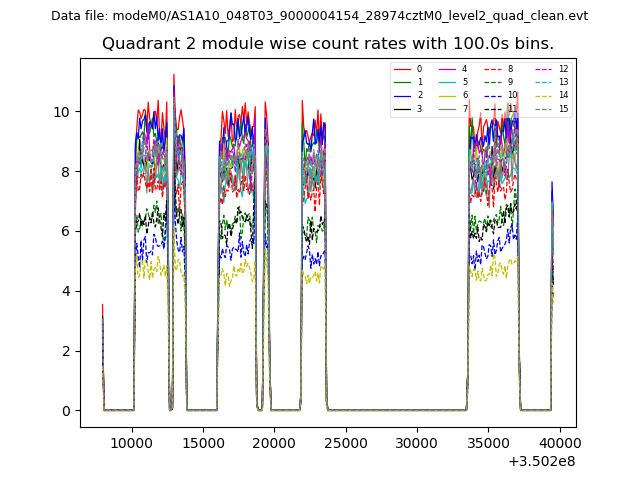
| Module-wise count rates for Quadrant B Data is divided into 100 sec bins |
 |
 |
| Module-wise count rates for Quadrant C Data is divided into 100 sec bins |
 |
 |
| Module-wise count rates for Quadrant D Data is divided into 100 sec bins |
 |
 |
| Parameter | Plot |
|---|---|
| CZT HV Monitor | 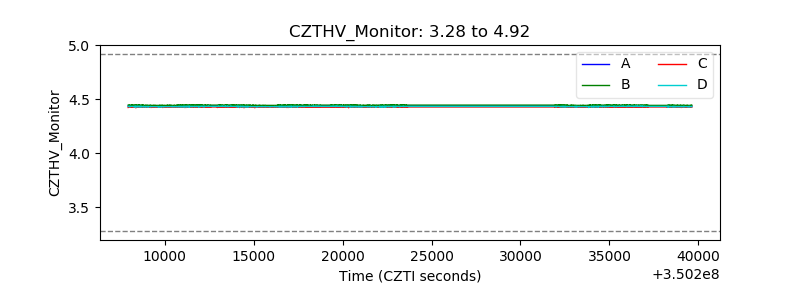 |
| D_VDD | 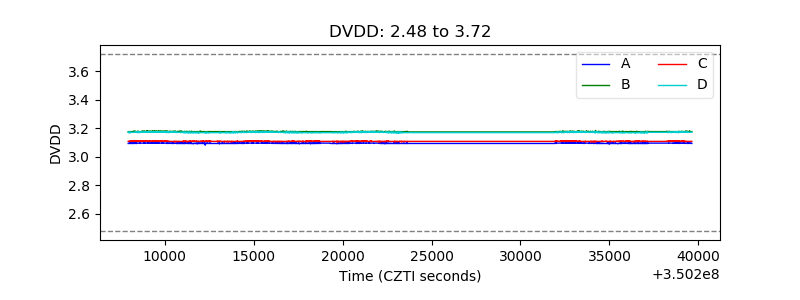 |
| Temperature 1 | 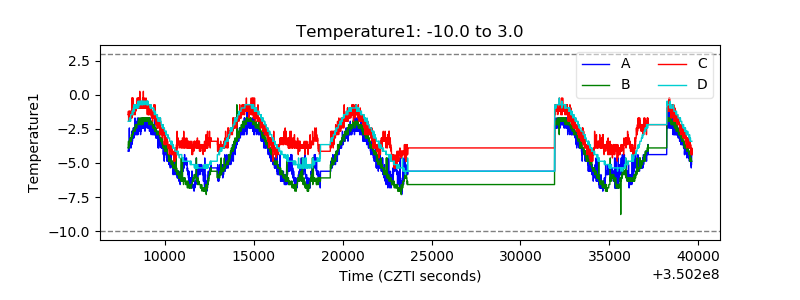 |
| Veto HV Monitor | 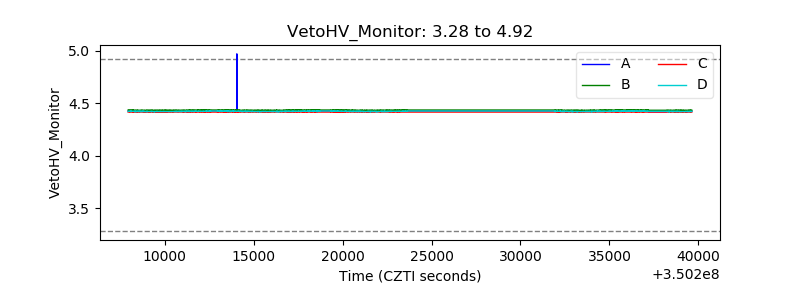 |
| Veto LLD | 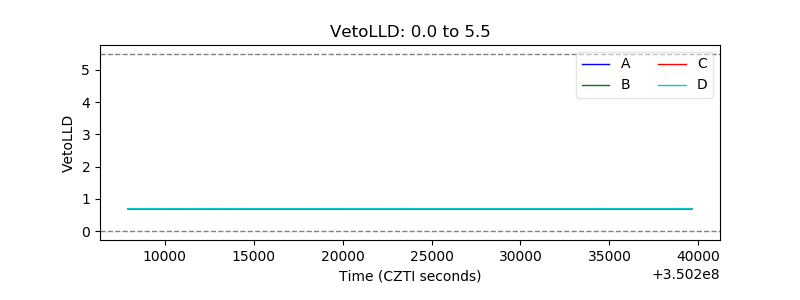 |
| Alpha Counter | 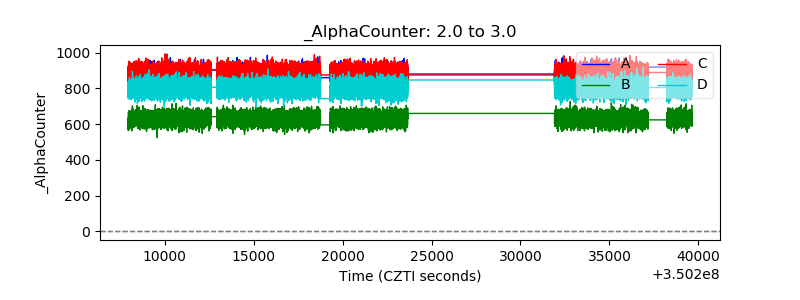 |
| _CPM_Rate | 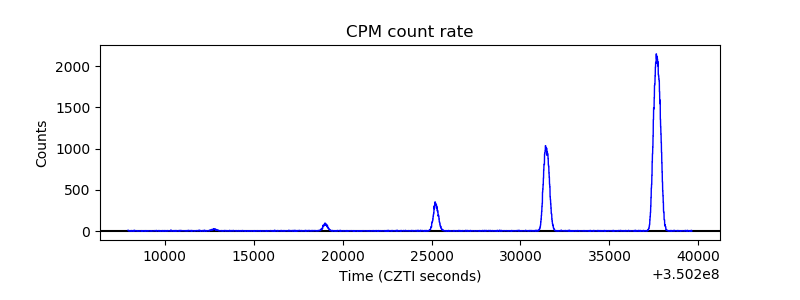 |
| CZT Counter | 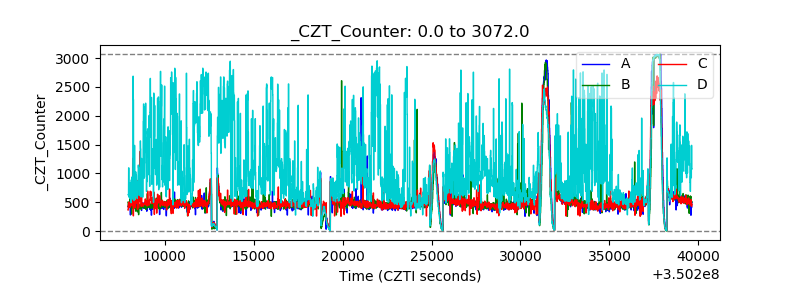 |
| +2.5 Volts monitor |  |
| +5 Volts monitor |  |
| _ROLL_ROT | 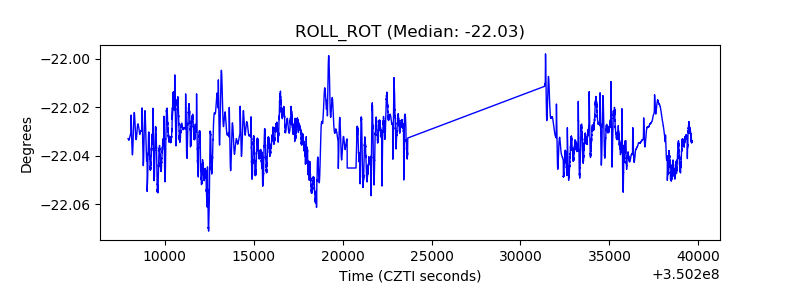 |
| _Roll_DEC | 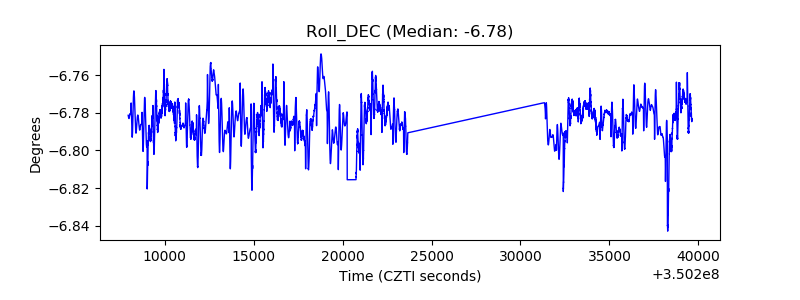 |
| _Roll_RA | 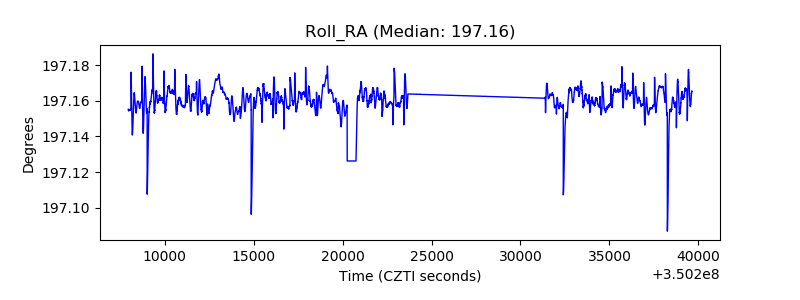 |
| Veto Counter | 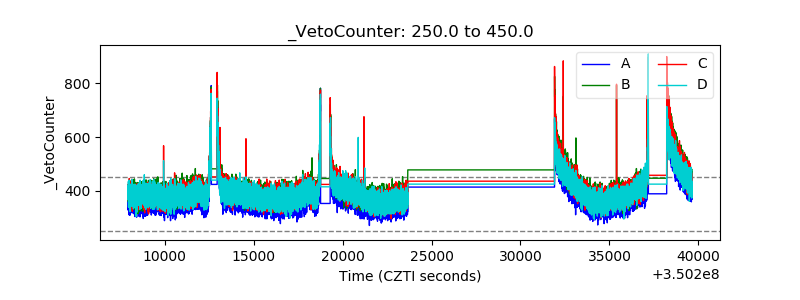 |