| Param | Original file | Final file |
|---|---|---|
| Filename | modeM0/AS1A10_048T03_9000004154_28976cztM0_level2.evt | modeM0/AS1A10_048T03_9000004154_28976cztM0_level2_quad_clean.evt |
| Size (bytes) | 2,057,644,800 | 320,192,640 |
| Size | 1.9 GB | 305.4 MB |
| Events in quadrant A | 11,958,092 | 2,046,320 |
| Events in quadrant B | 12,659,723 | 2,076,737 |
| Events in quadrant C | 12,082,822 | 2,004,201 |
| Events in quadrant D | 23,966,244 | 1,886,559 |
| Mode M9 | |||
|---|---|---|---|
| Quadrant | BADHDUFLAG | Total packets | Discarded packets |
| A | 0 | 44 | 0 |
| B | 0 | 44 | 0 |
| C | 0 | 44 | 0 |
| D | 0 | 44 | 0 |
| Mode M0 | |||
|---|---|---|---|
| Quadrant | BADHDUFLAG | Total packets | Discarded packets |
| A | 0 | 51584 | 11 |
| B | 0 | 53375 | 11 |
| C | 0 | 51316 | 15 |
| D | 0 | 88183 | 5 |
| Mode SS | |||
|---|---|---|---|
| Quadrant | BADHDUFLAG | Total packets | Discarded packets |
| A | 0 | 500 | 0 |
| B | 0 | 500 | 0 |
| C | 0 | 500 | 0 |
| D | 0 | 500 | 0 |
| Quadrant | Total seconds | Saturated seconds | Saturation percentage |
|---|---|---|---|
| A | 24474 | 248 | 1.013320% |
| B | 24475 | 360 | 1.470889% |
| C | 24473 | 368 | 1.503698% |
| D | 24478 | 2322 | 9.486069% |
Noise dominated data is calculated using 1-second bins in cleaned event files. If a bin has >2000 counts, and if more than 50% of those come from <1% of pixels, then it is considered to be noise-dominated and hence unusable.
| Quadrant | # 1 sec bins | Bins with >0 counts | Bins with >2000 counts | High rate bins dominated by noise | Noise dominated (total time) | Noise dominated (detector-on time) | Marked lightcurve |
|---|---|---|---|---|---|---|---|
| A | 28833 | 24474 | 31 | 31 | 0.11% | 0.13% | 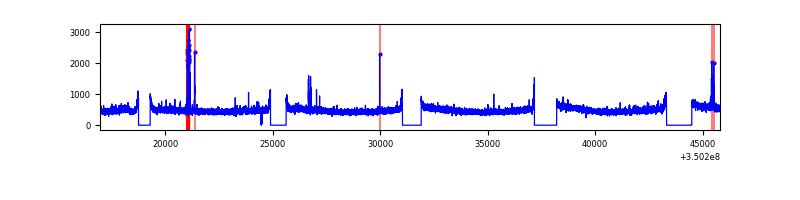 |
| B | 28834 | 24475 | 88 | 88 | 0.31% | 0.36% | 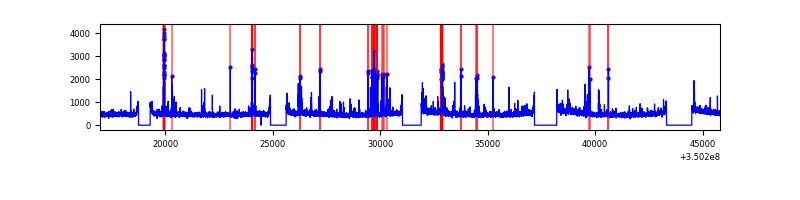 |
| C | 28834 | 24476 | 4 | 4 | 0.01% | 0.02% | 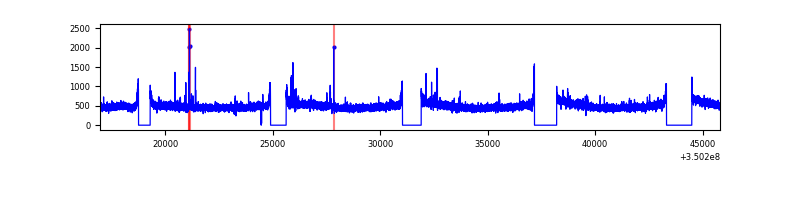 |
| D | 28834 | 24476 | 1895 | 1895 | 6.57% | 7.74% | 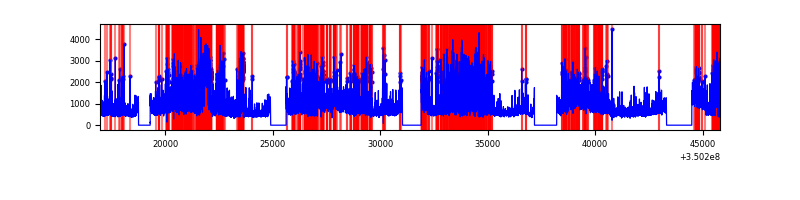 |
Top three noisy pixels from each quadrant. If the there are fewer than three noisy pixels in the level2.evt file, extra rows are filled as -1
| Pixel properties | Quadrant properties | ||||||
|---|---|---|---|---|---|---|---|
| Quadrant | DetID | PixID | Counts | Sigma | Mean | Median | Sigma |
| A | 12 | 210 | 188967 | 305.97 | 3027 | 2958 | 607.9 |
| A | 13 | 6 | 53218 | 82.67 | 3027 | 2958 | 607.9 |
| A | 13 | 254 | 44573 | 68.45 | 3027 | 2958 | 607.9 |
| B | 10 | 245 | 421865 | 726.58 | 3010 | 2931 | 576.6 |
| B | 10 | 246 | 331489 | 569.83 | 3010 | 2931 | 576.6 |
| B | 12 | 111 | 72385 | 120.46 | 3010 | 2931 | 576.6 |
| C | 14 | 238 | 468176 | 677.49 | 2922 | 2945 | 686.7 |
| C | 3 | 233 | 111636 | 158.28 | 2922 | 2945 | 686.7 |
| C | 0 | 207 | 60559 | 83.9 | 2922 | 2945 | 686.7 |
| D | 8 | 195 | 5476012 | 8189.49 | 2828 | 2757 | 668.3 |
| D | 1 | 52 | 3464769 | 5180.12 | 2828 | 2757 | 668.3 |
| D | 7 | 80 | 2595510 | 3879.47 | 2828 | 2757 | 668.3 |
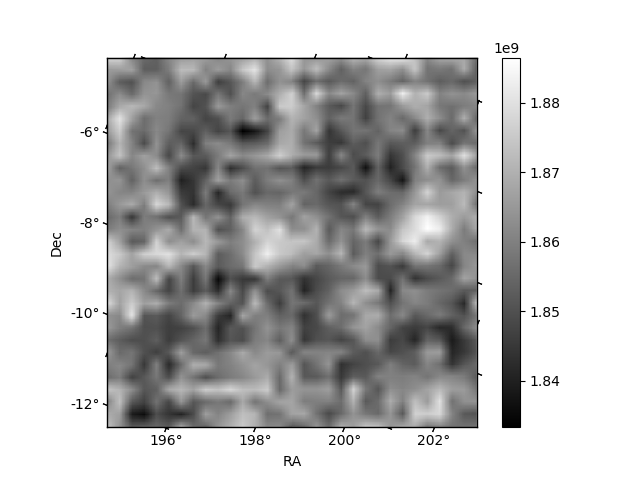
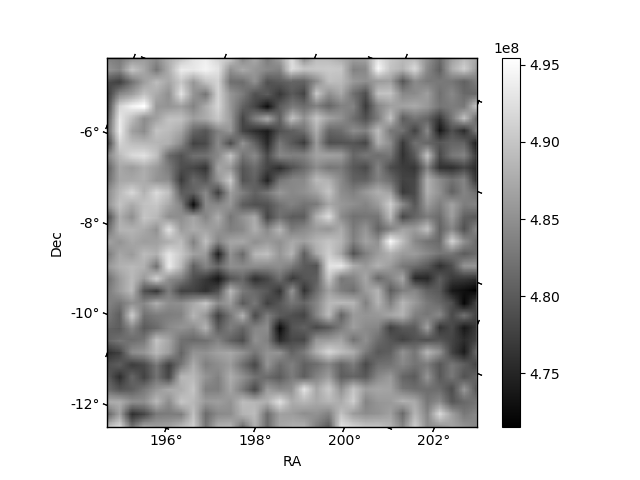
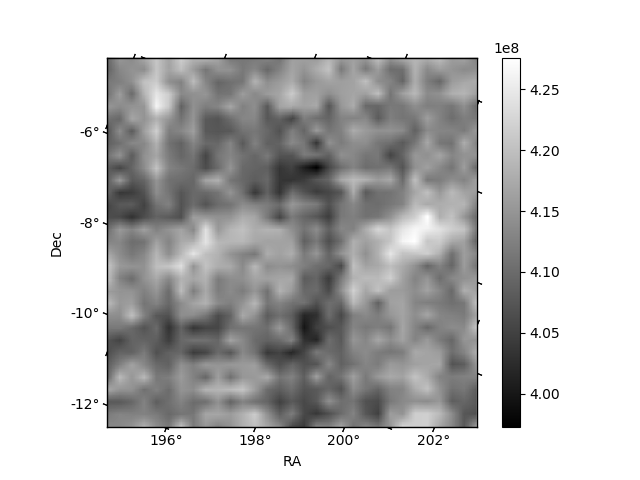
Histogram calculated using DETX and DETY for each event in the final _common_clean file
| Quadrant A | 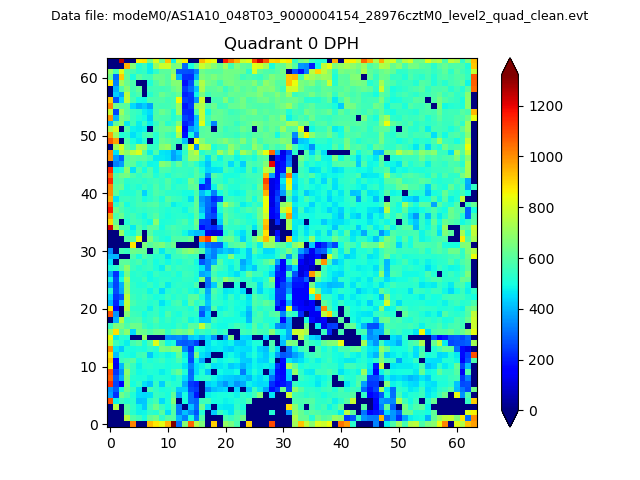 |
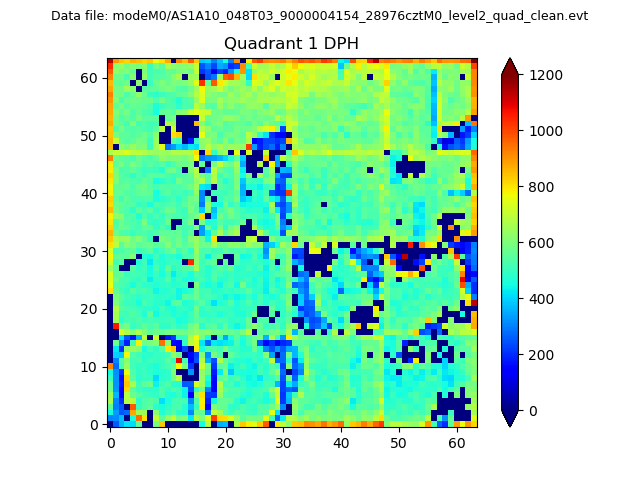 |
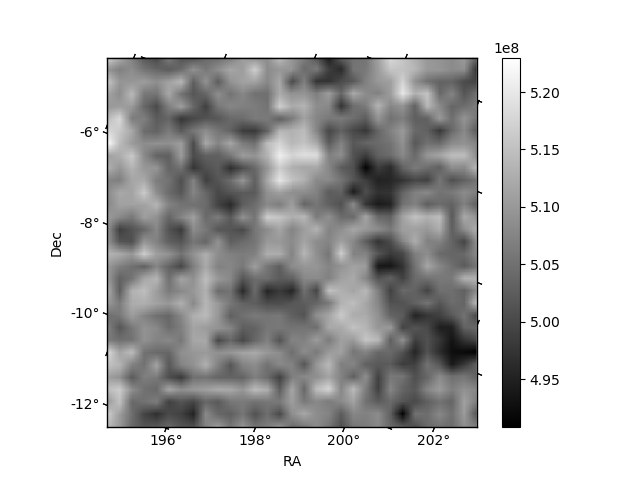
Quadrant B |
|---|---|---|---|
| Quadrant D | 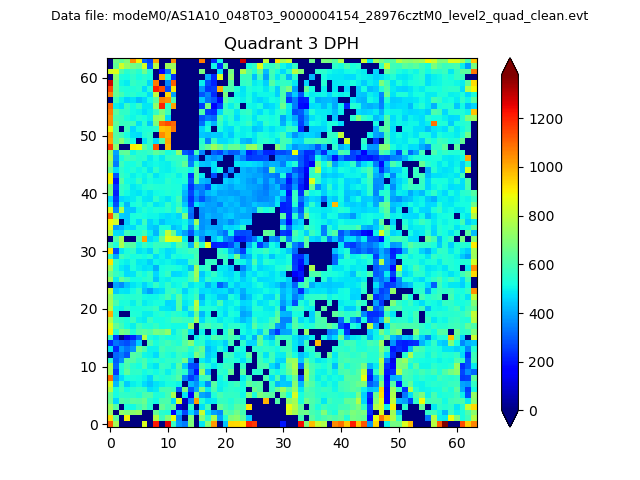 |
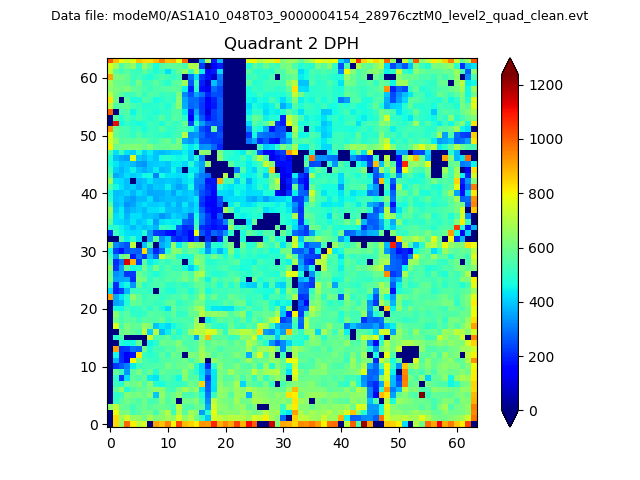 |
Quadrant C |
| Plot type | Count rate plots | Images |
|---|---|---|
| Comparison with Poisson distribution Blue bars denote a histogram of data divided into 1 sec bins. Red curve is a Poisson curve with rate = median count rate of data. |
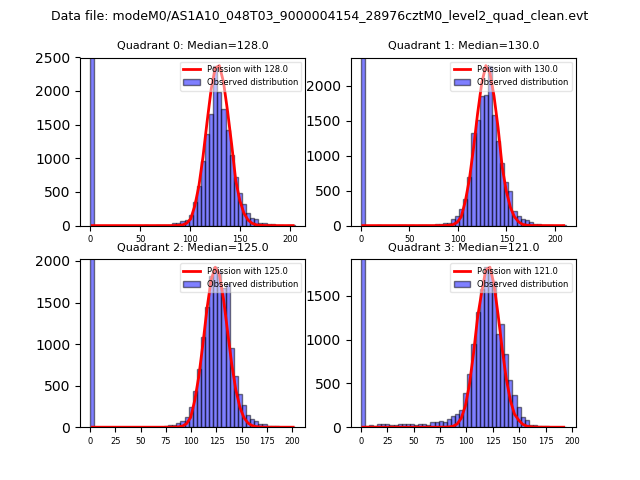 |
 |
| Quadrant-wise count rates Data is divided into 100 sec bins |
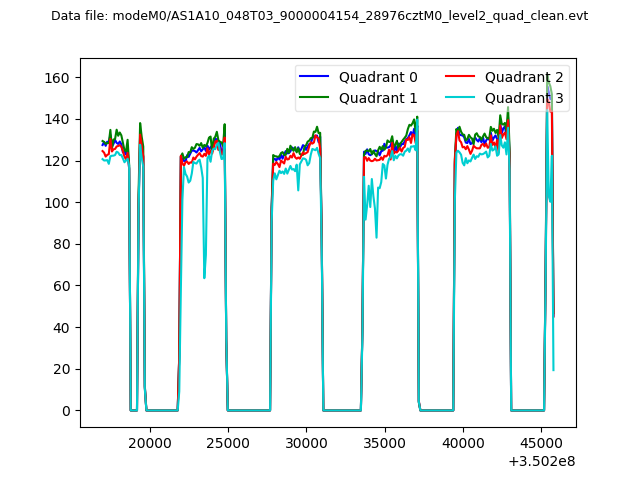 |
|
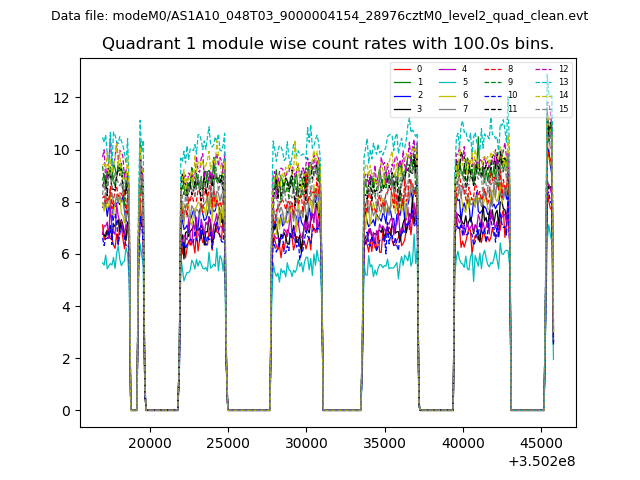
| Module-wise count rates for Quadrant A Data is divided into 100 sec bins |
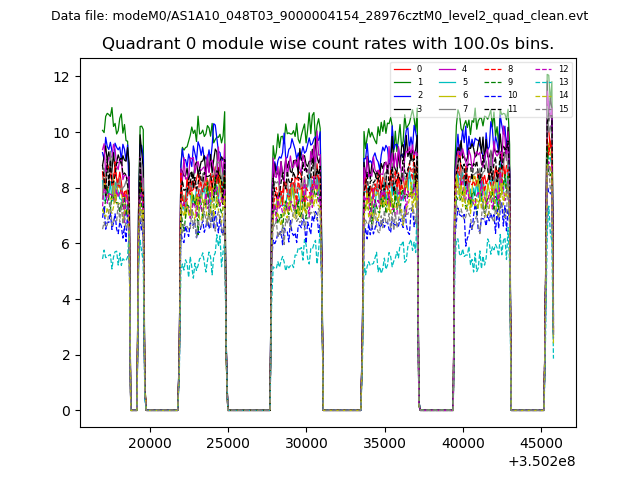 |
 |
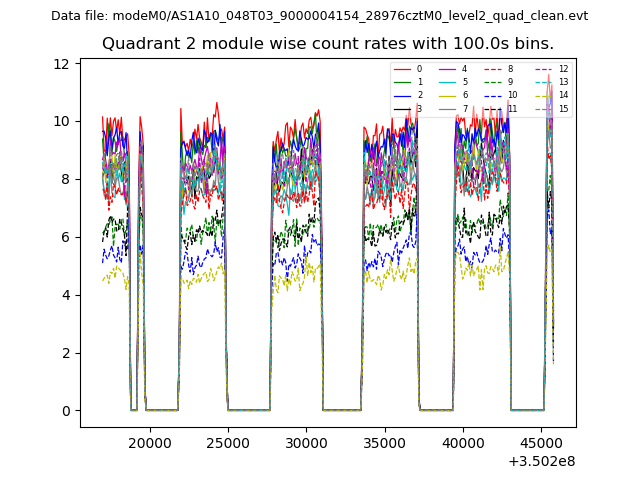
| Module-wise count rates for Quadrant B Data is divided into 100 sec bins |
 |
 |
| Module-wise count rates for Quadrant C Data is divided into 100 sec bins |
 |
 |
| Module-wise count rates for Quadrant D Data is divided into 100 sec bins |
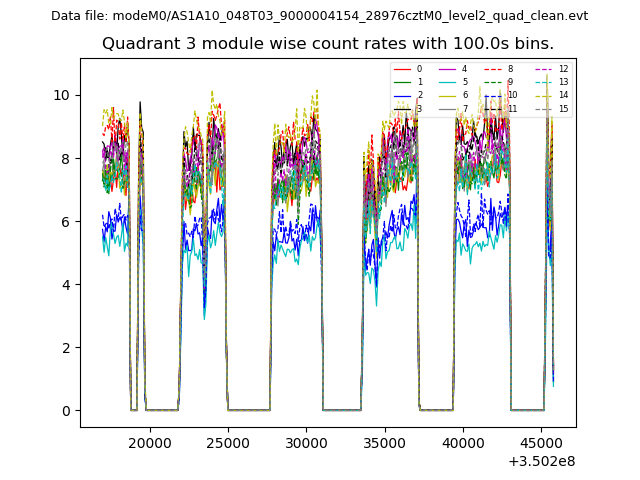 |
 |
| Parameter | Plot |
|---|---|
| CZT HV Monitor | 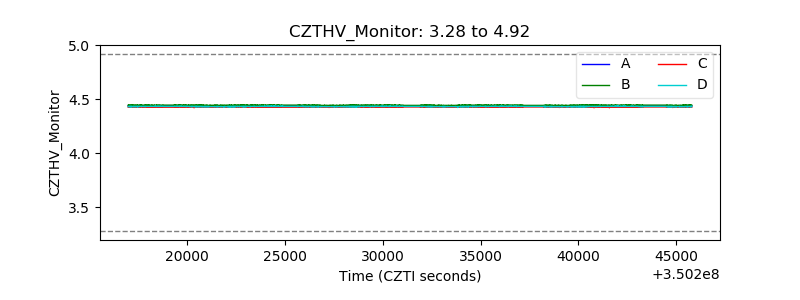 |
| D_VDD | 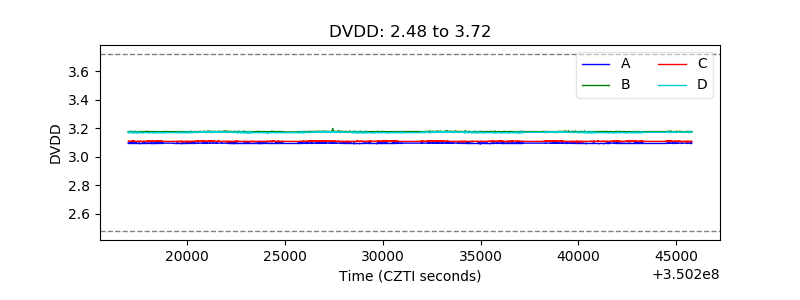 |
| Temperature 1 |  |
| Veto HV Monitor | 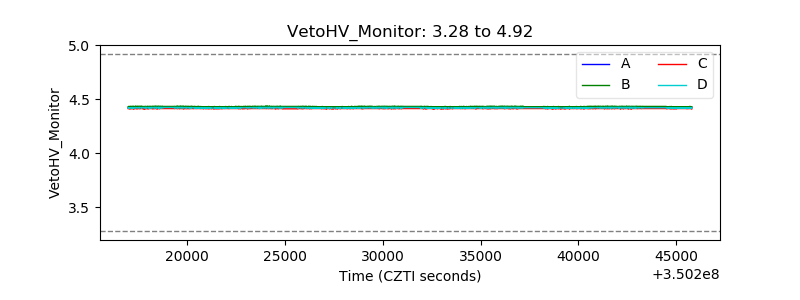 |
| Veto LLD | 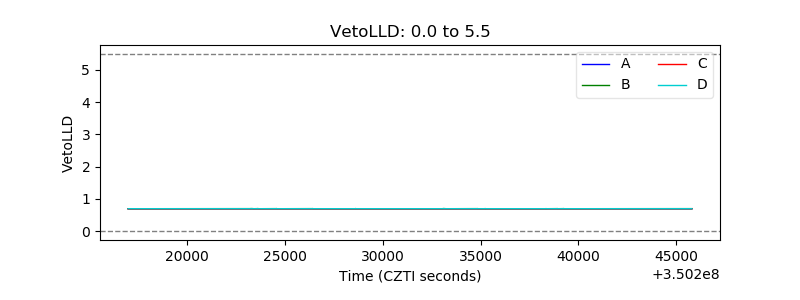 |
| Alpha Counter | 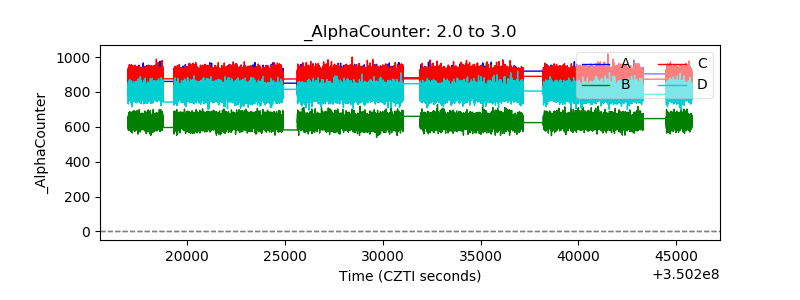 |
| _CPM_Rate | 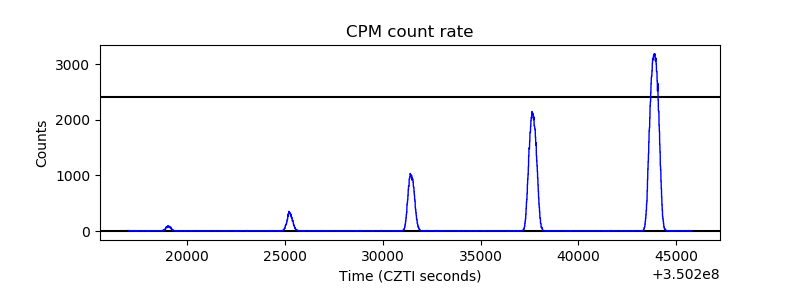 |
| CZT Counter | 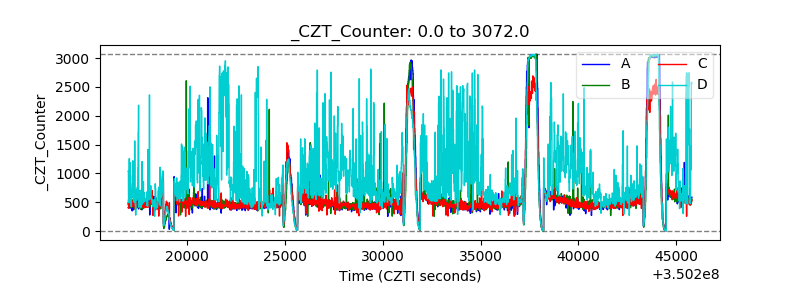 |
| +2.5 Volts monitor |  |
| +5 Volts monitor |  |
| _ROLL_ROT | 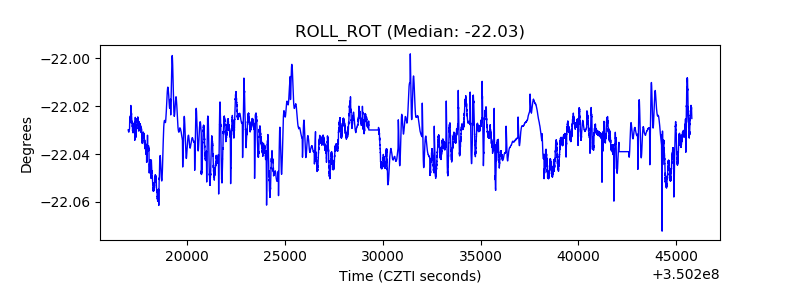 |
| _Roll_DEC | 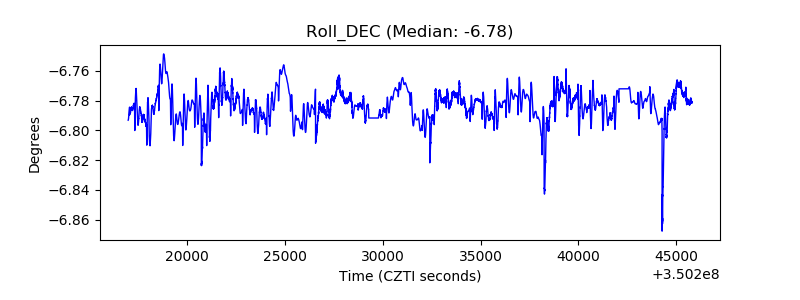 |
| _Roll_RA | 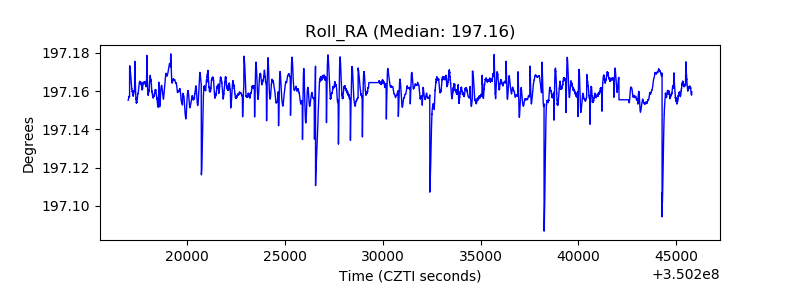 |
| Veto Counter | 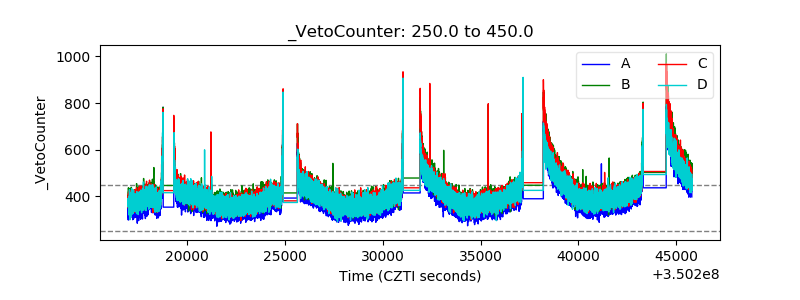 |