| Param | Original file | Final file |
|---|---|---|
| Filename | modeM0/AS1A10_048T03_9000004154_28978cztM0_level2.evt | modeM0/AS1A10_048T03_9000004154_28978cztM0_level2_quad_clean.evt |
| Size (bytes) | 542,266,560 | 107,112,960 |
| Size | 517.1 MB | 102.2 MB |
| Events in quadrant A | 3,285,498 | 721,989 |
| Events in quadrant B | 3,344,547 | 752,116 |
| Events in quadrant C | 3,301,685 | 700,712 |
| Events in quadrant D | 6,076,797 | 642,328 |
| Mode M9 | |||
|---|---|---|---|
| Quadrant | BADHDUFLAG | Total packets | Discarded packets |
| A | 0 | 14 | 0 |
| B | 0 | 15 | 0 |
| C | 0 | 15 | 0 |
| D | 0 | 15 | 0 |
| Mode M0 | |||
|---|---|---|---|
| Quadrant | BADHDUFLAG | Total packets | Discarded packets |
| A | 0 | 13663 | 2 |
| B | 0 | 13791 | 2 |
| C | 0 | 13578 | 2 |
| D | 0 | 22308 | 2 |
| Mode SS | |||
|---|---|---|---|
| Quadrant | BADHDUFLAG | Total packets | Discarded packets |
| A | 0 | 124 | 0 |
| B | 0 | 124 | 0 |
| C | 0 | 124 | 0 |
| D | 0 | 124 | 0 |
| Quadrant | Total seconds | Saturated seconds | Saturation percentage |
|---|---|---|---|
| A | 6116 | 52 | 0.850229% |
| B | 6116 | 77 | 1.258993% |
| C | 6116 | 111 | 1.814912% |
| D | 6116 | 578 | 9.450621% |
Noise dominated data is calculated using 1-second bins in cleaned event files. If a bin has >2000 counts, and if more than 50% of those come from <1% of pixels, then it is considered to be noise-dominated and hence unusable.
| Quadrant | # 1 sec bins | Bins with >0 counts | Bins with >2000 counts | High rate bins dominated by noise | Noise dominated (total time) | Noise dominated (detector-on time) | Marked lightcurve |
|---|---|---|---|---|---|---|---|
| A | 7451 | 6117 | 5 | 5 | 0.07% | 0.08% |  |
| B | 7451 | 6117 | 5 | 5 | 0.07% | 0.08% |  |
| C | 7451 | 6117 | 0 | 0 | 0.00% | 0.00% |  |
| D | 7451 | 6117 | 461 | 461 | 6.19% | 7.54% |  |
Top three noisy pixels from each quadrant. If the there are fewer than three noisy pixels in the level2.evt file, extra rows are filled as -1
| Pixel properties | Quadrant properties | ||||||
|---|---|---|---|---|---|---|---|
| Quadrant | DetID | PixID | Counts | Sigma | Mean | Median | Sigma |
| A | 12 | 96 | 45796 | 271.06 | 833 | 820 | 165.9 |
| A | 1 | 113 | 18656 | 107.49 | 833 | 820 | 165.9 |
| A | 13 | 254 | 11345 | 63.43 | 833 | 820 | 165.9 |
| B | 10 | 245 | 22828 | 140.24 | 838 | 819 | 156.9 |
| B | 10 | 247 | 20756 | 127.03 | 838 | 819 | 156.9 |
| B | 12 | 111 | 18758 | 114.3 | 838 | 819 | 156.9 |
| C | 14 | 238 | 133041 | 709.76 | 798 | 805 | 186.3 |
| C | 3 | 233 | 36523 | 191.71 | 798 | 805 | 186.3 |
| C | 2 | 114 | 14555 | 73.8 | 798 | 805 | 186.3 |
| D | 8 | 195 | 1484267 | 8130.15 | 767 | 747 | 182.5 |
| D | 7 | 80 | 1344014 | 7361.52 | 767 | 747 | 182.5 |
| D | 1 | 52 | 258265 | 1411.28 | 767 | 747 | 182.5 |
Histogram calculated using DETX and DETY for each event in the final _common_clean file
| Quadrant A |  |
 |
Quadrant B |
|---|---|---|---|
| Quadrant D |  |
 |
Quadrant C |
| Plot type | Count rate plots | Images |
|---|---|---|
| Comparison with Poisson distribution Blue bars denote a histogram of data divided into 1 sec bins. Red curve is a Poisson curve with rate = median count rate of data. |
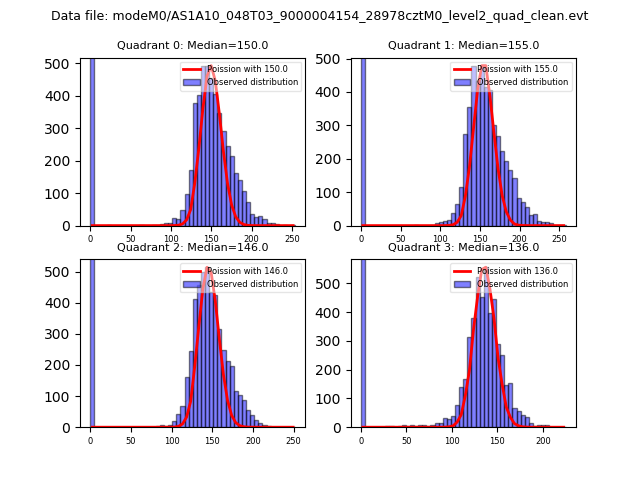 |
 |
| Quadrant-wise count rates Data is divided into 100 sec bins |
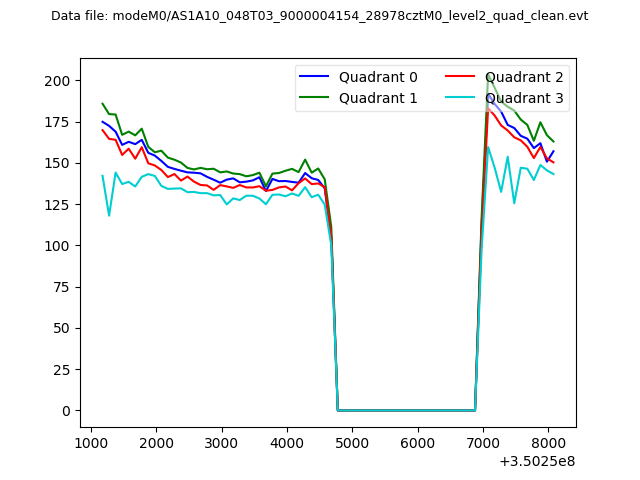 |
|
| Module-wise count rates for Quadrant A Data is divided into 100 sec bins |
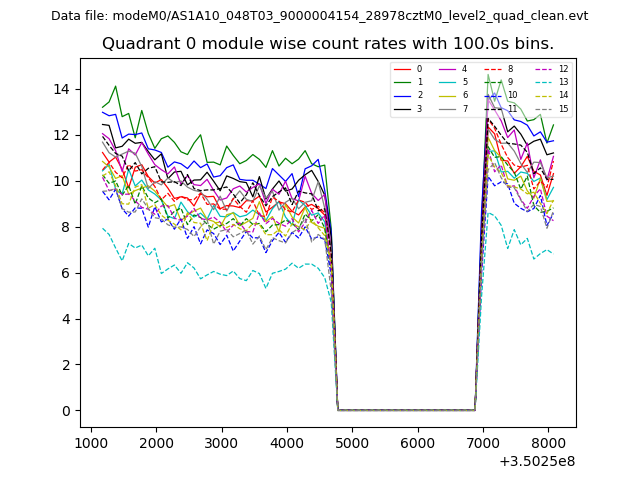 |
 |
| Module-wise count rates for Quadrant B Data is divided into 100 sec bins |
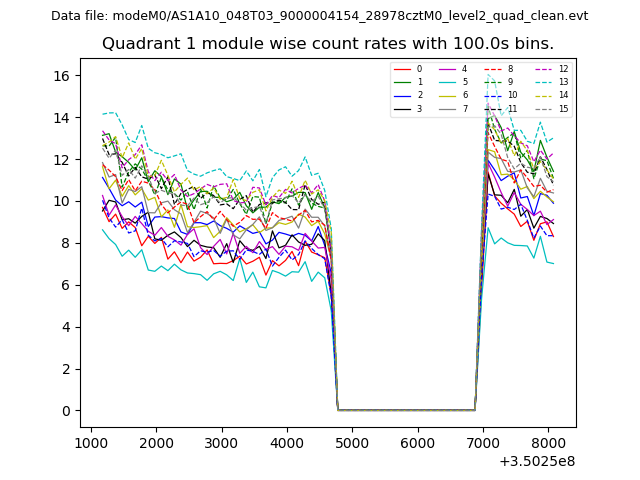 |
 |
| Module-wise count rates for Quadrant C Data is divided into 100 sec bins |
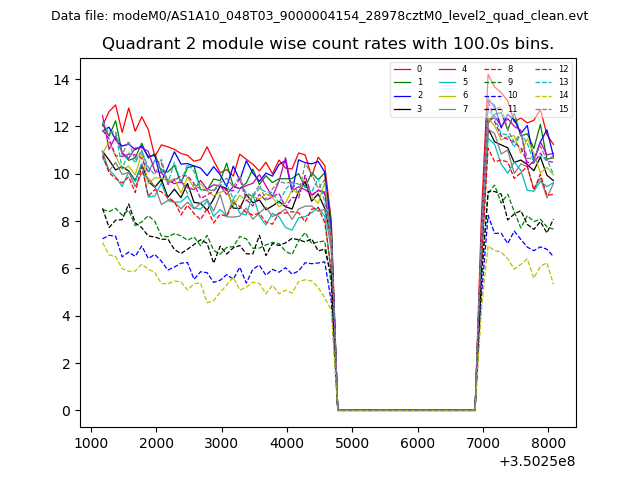 |
 |
| Module-wise count rates for Quadrant D Data is divided into 100 sec bins |
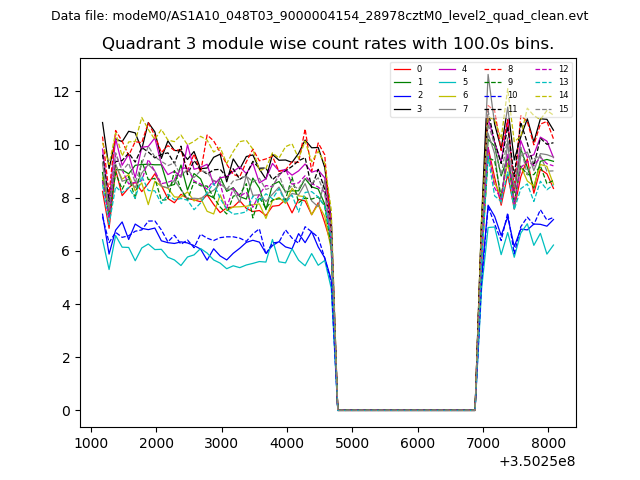 |
 |
| Parameter | Plot |
|---|---|
| CZT HV Monitor | 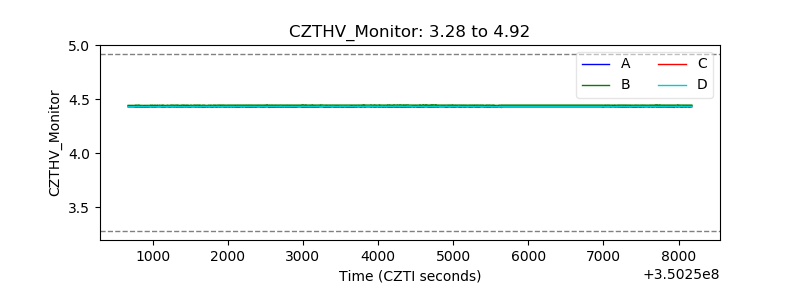 |
| D_VDD |  |
| Temperature 1 |  |
| Veto HV Monitor |  |
| Veto LLD |  |
| Alpha Counter | 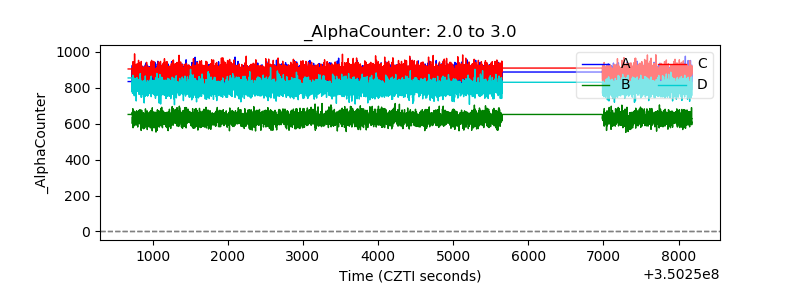 |
| _CPM_Rate | 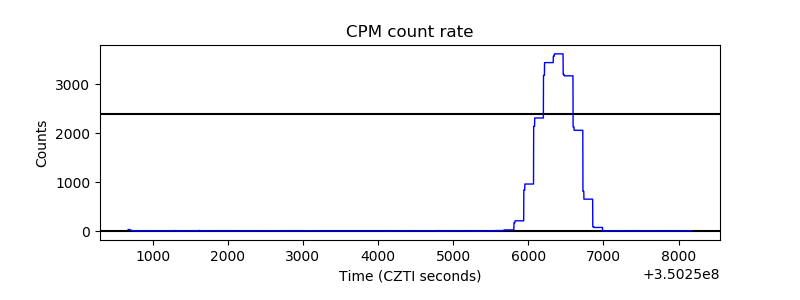 |
| CZT Counter |  |
| +2.5 Volts monitor |  |
| +5 Volts monitor |  |
| _ROLL_ROT | 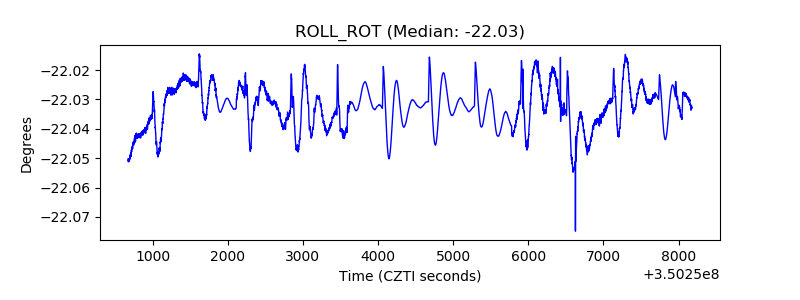 |
| _Roll_DEC | 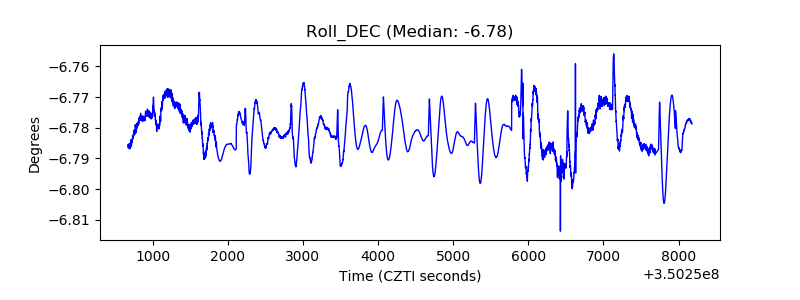 |
| _Roll_RA |  |
| Veto Counter | 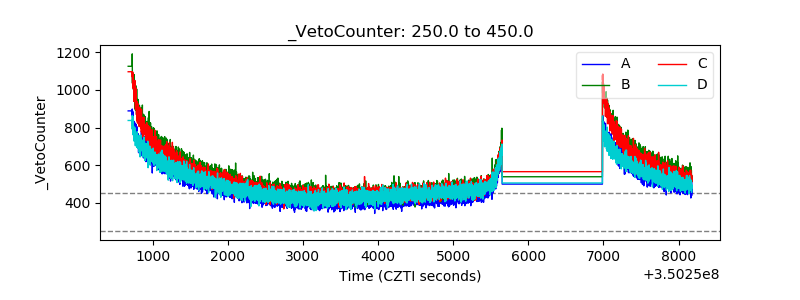 |