| Param | Original file | Final file |
|---|---|---|
| Filename | modeM0/AS1A10_048T03_9000004154_28979cztM0_level2.evt | modeM0/AS1A10_048T03_9000004154_28979cztM0_level2_quad_clean.evt |
| Size (bytes) | 551,361,600 | 108,910,080 |
| Size | 525.8 MB | 103.9 MB |
| Events in quadrant A | 3,410,575 | 736,271 |
| Events in quadrant B | 3,285,872 | 773,718 |
| Events in quadrant C | 3,243,403 | 720,287 |
| Events in quadrant D | 6,344,662 | 641,782 |
| Mode M9 | |||
|---|---|---|---|
| Quadrant | BADHDUFLAG | Total packets | Discarded packets |
| A | 0 | 18 | 0 |
| B | 0 | 19 | 0 |
| C | 0 | 19 | 0 |
| D | 0 | 19 | 0 |
| Mode M0 | |||
|---|---|---|---|
| Quadrant | BADHDUFLAG | Total packets | Discarded packets |
| A | 0 | 13914 | 2 |
| B | 0 | 13471 | 2 |
| C | 0 | 13268 | 2 |
| D | 0 | 23018 | 2 |
| Mode SS | |||
|---|---|---|---|
| Quadrant | BADHDUFLAG | Total packets | Discarded packets |
| A | 0 | 122 | 0 |
| B | 0 | 122 | 0 |
| C | 0 | 122 | 0 |
| D | 0 | 122 | 0 |
| Quadrant | Total seconds | Saturated seconds | Saturation percentage |
|---|---|---|---|
| A | 6112 | 73 | 1.194372% |
| B | 6112 | 45 | 0.736257% |
| C | 6112 | 79 | 1.292539% |
| D | 6112 | 889 | 14.545157% |
Noise dominated data is calculated using 1-second bins in cleaned event files. If a bin has >2000 counts, and if more than 50% of those come from <1% of pixels, then it is considered to be noise-dominated and hence unusable.
| Quadrant | # 1 sec bins | Bins with >0 counts | Bins with >2000 counts | High rate bins dominated by noise | Noise dominated (total time) | Noise dominated (detector-on time) | Marked lightcurve |
|---|---|---|---|---|---|---|---|
| A | 7462 | 6113 | 47 | 47 | 0.63% | 0.77% | 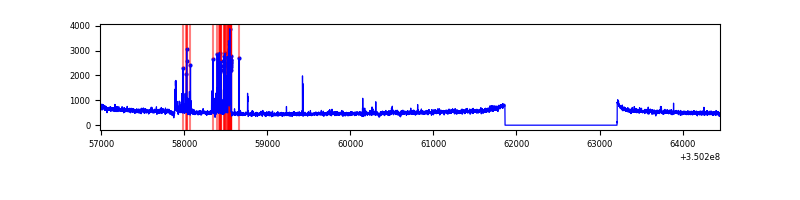 |
| B | 7462 | 6113 | 1 | 1 | 0.01% | 0.02% | 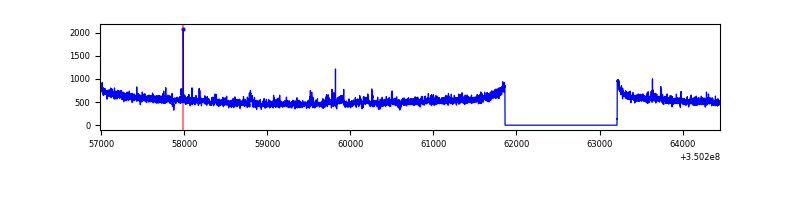 |
| C | 7462 | 6113 | 0 | 0 | 0.00% | 0.00% | 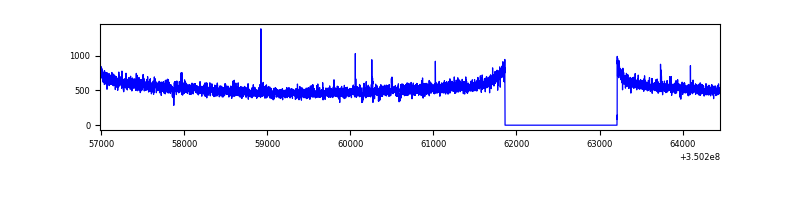 |
| D | 7462 | 6113 | 690 | 690 | 9.25% | 11.29% | 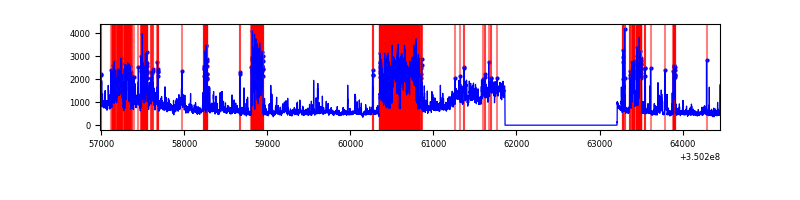 |
Top three noisy pixels from each quadrant. If the there are fewer than three noisy pixels in the level2.evt file, extra rows are filled as -1
| Pixel properties | Quadrant properties | ||||||
|---|---|---|---|---|---|---|---|
| Quadrant | DetID | PixID | Counts | Sigma | Mean | Median | Sigma |
| A | 12 | 96 | 240771 | 1483.31 | 814 | 800 | 161.8 |
| A | 1 | 113 | 21183 | 125.99 | 814 | 800 | 161.8 |
| A | 13 | 254 | 11137 | 63.9 | 814 | 800 | 161.8 |
| B | 10 | 245 | 37513 | 236.69 | 825 | 806 | 155.1 |
| B | 12 | 111 | 18637 | 114.97 | 825 | 806 | 155.1 |
| B | 11 | 111 | 16742 | 102.75 | 825 | 806 | 155.1 |
| C | 14 | 238 | 129622 | 696.05 | 788 | 795 | 185.1 |
| C | 3 | 233 | 21045 | 109.41 | 788 | 795 | 185.1 |
| C | 2 | 114 | 14460 | 73.83 | 788 | 795 | 185.1 |
| D | 7 | 80 | 1918398 | 10837.56 | 735 | 716 | 176.9 |
| D | 8 | 195 | 1484797 | 8387.12 | 735 | 716 | 176.9 |
| D | 1 | 52 | 96351 | 540.47 | 735 | 716 | 176.9 |
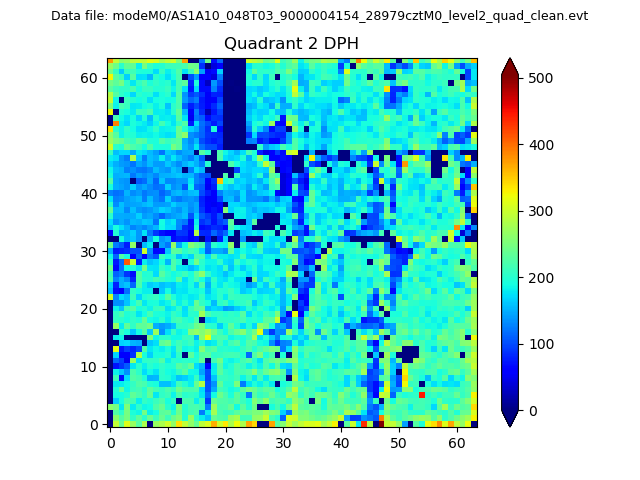
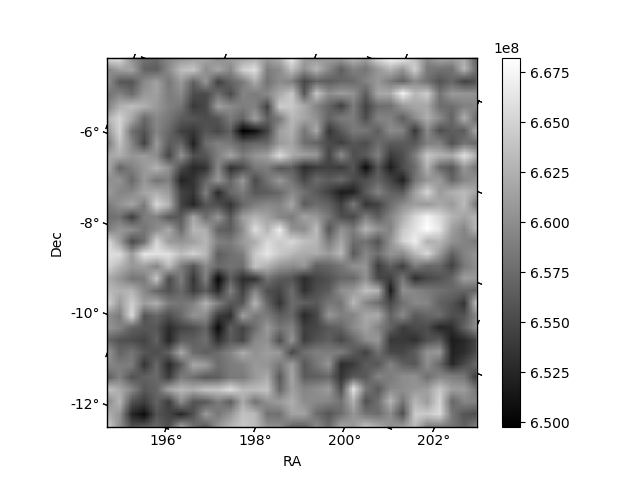
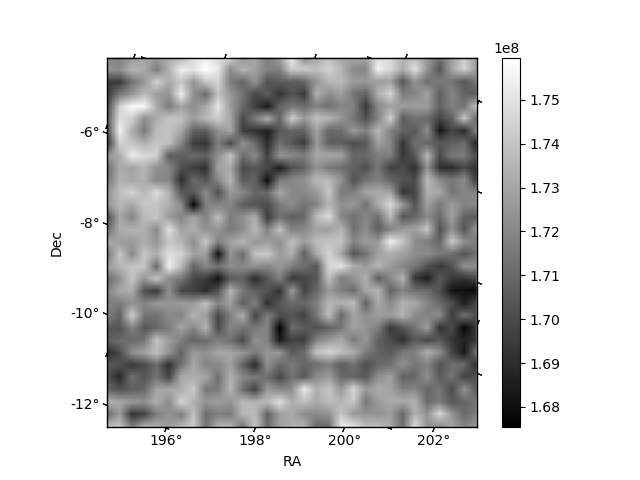
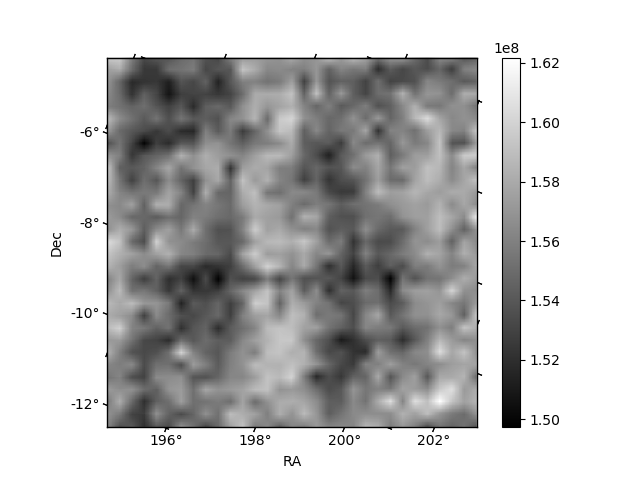
Histogram calculated using DETX and DETY for each event in the final _common_clean file
| Quadrant A | 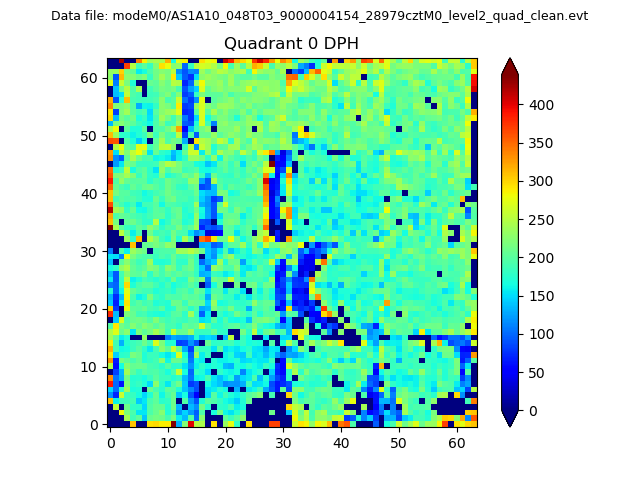 |
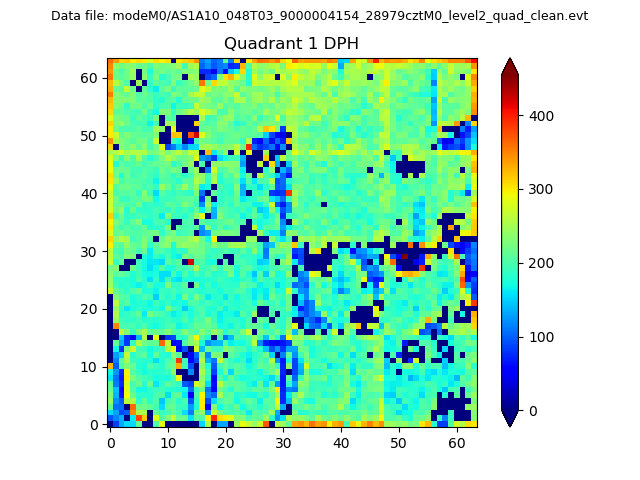 |
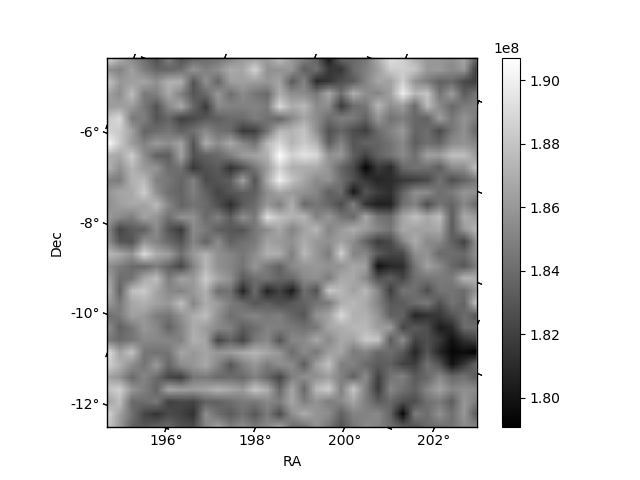
Quadrant B |
|---|---|---|---|
| Quadrant D | 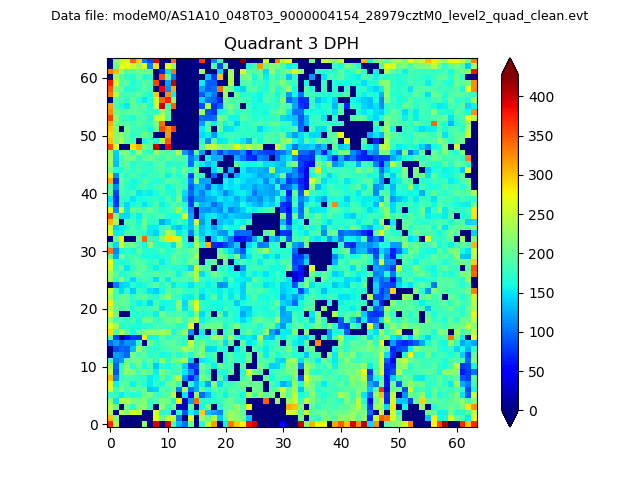 |
 |
Quadrant C |
| Plot type | Count rate plots | Images |
|---|---|---|
| Comparison with Poisson distribution Blue bars denote a histogram of data divided into 1 sec bins. Red curve is a Poisson curve with rate = median count rate of data. |
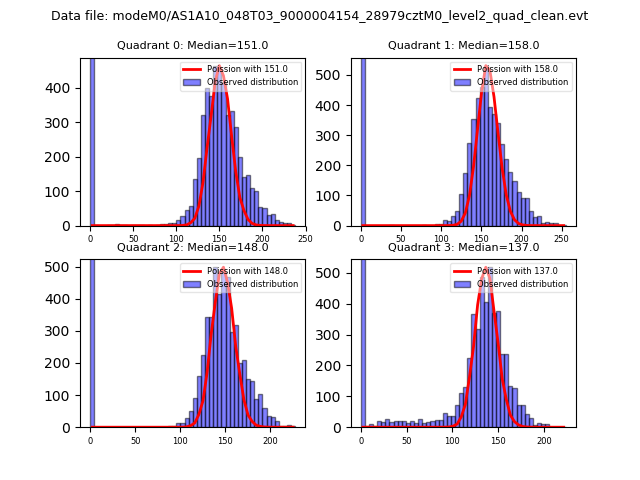 |
 |
| Quadrant-wise count rates Data is divided into 100 sec bins |
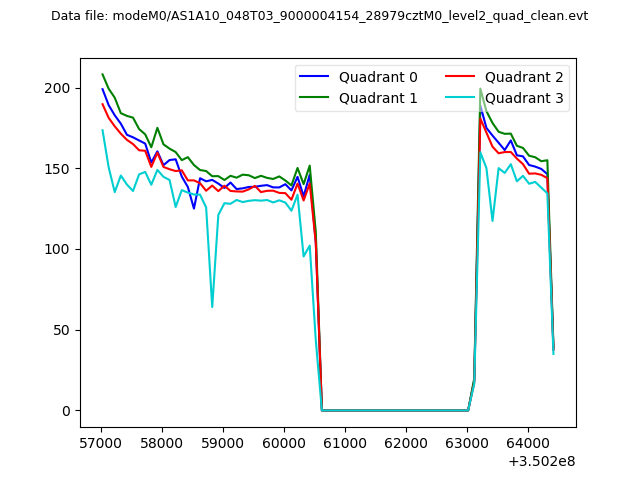 |
|
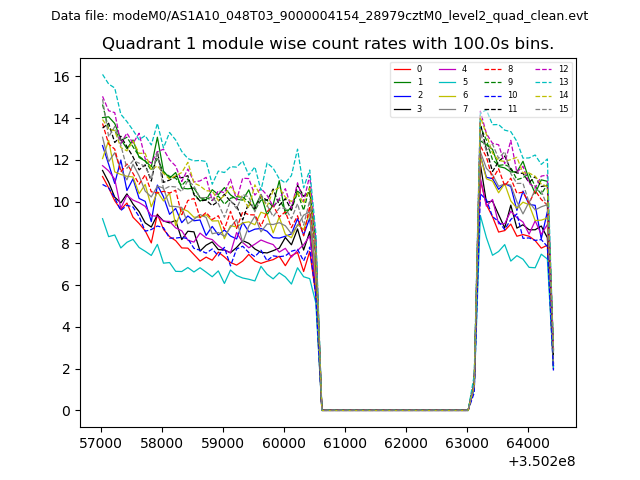
| Module-wise count rates for Quadrant A Data is divided into 100 sec bins |
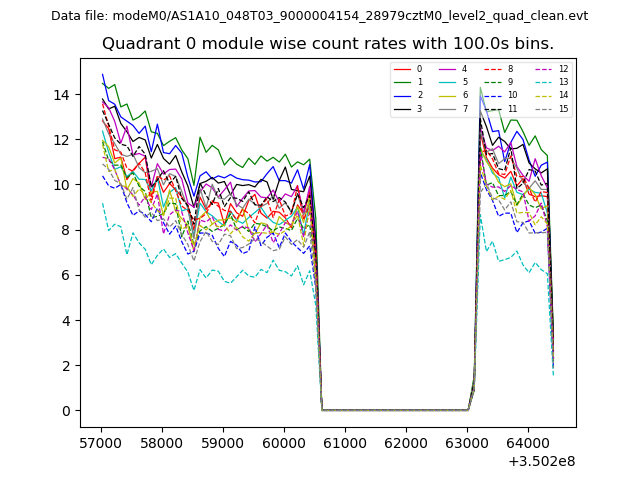 |
 |
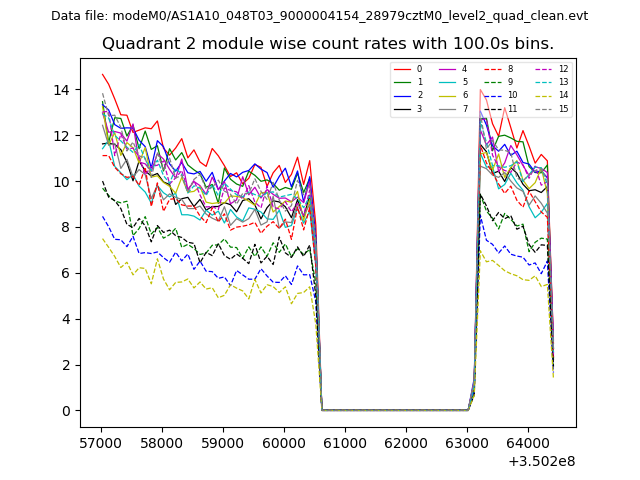
| Module-wise count rates for Quadrant B Data is divided into 100 sec bins |
 |
 |
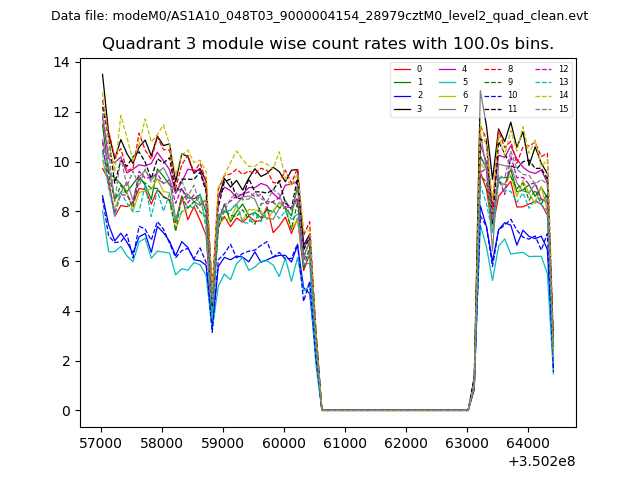
| Module-wise count rates for Quadrant C Data is divided into 100 sec bins |
 |
 |
| Module-wise count rates for Quadrant D Data is divided into 100 sec bins |
 |
 |
| Parameter | Plot |
|---|---|
| CZT HV Monitor | 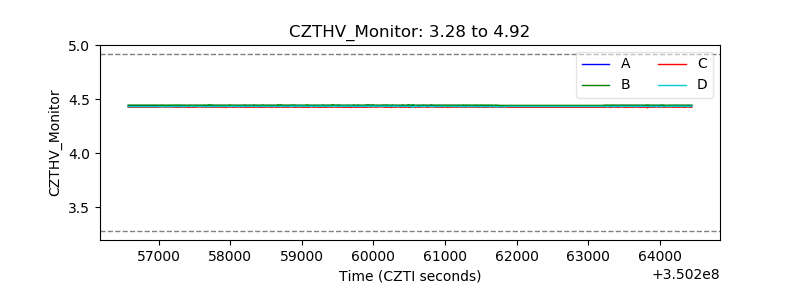 |
| D_VDD | 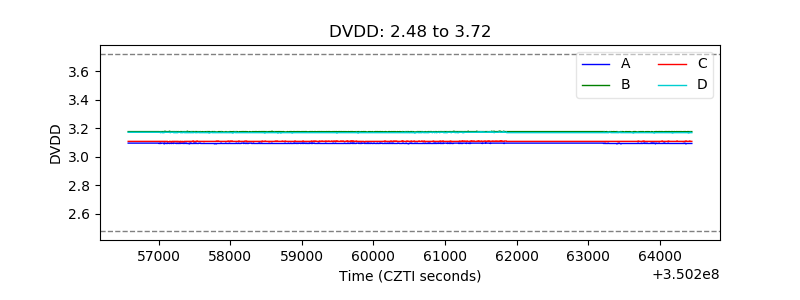 |
| Temperature 1 | 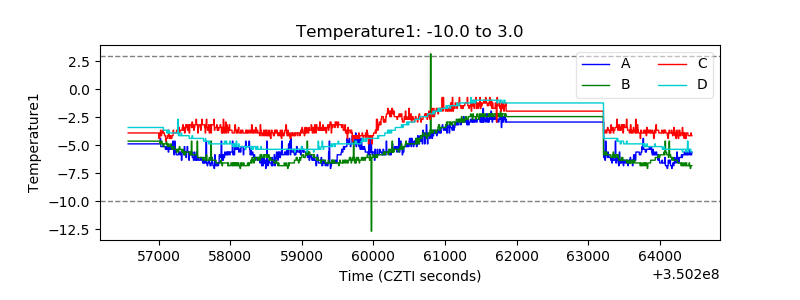 |
| Veto HV Monitor | 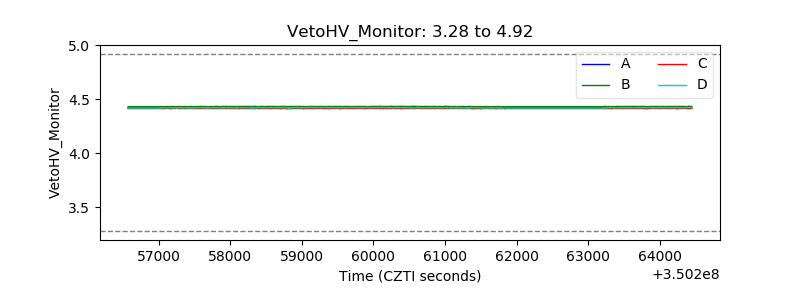 |
| Veto LLD | 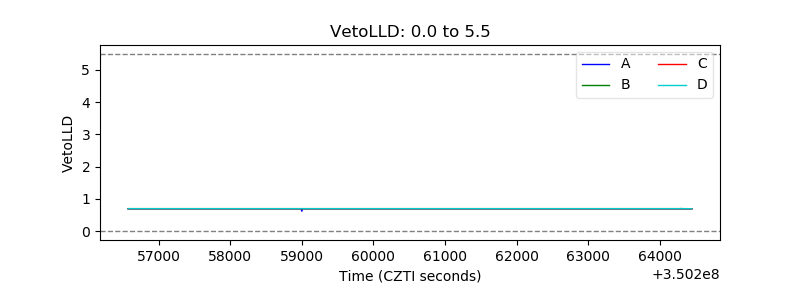 |
| Alpha Counter | 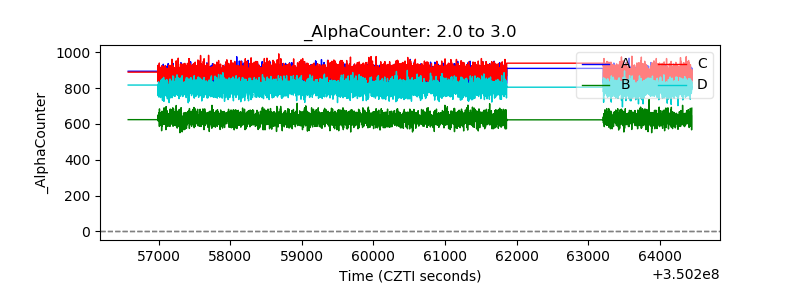 |
| _CPM_Rate | 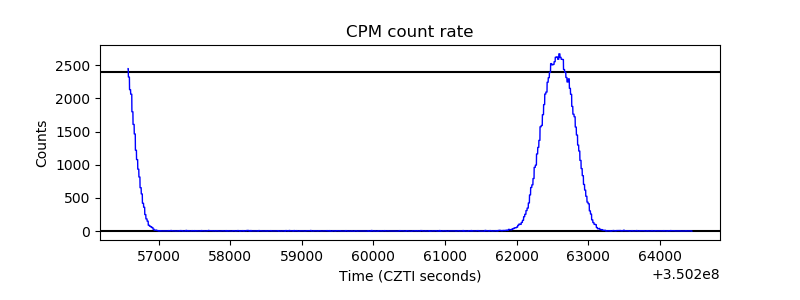 |
| CZT Counter | 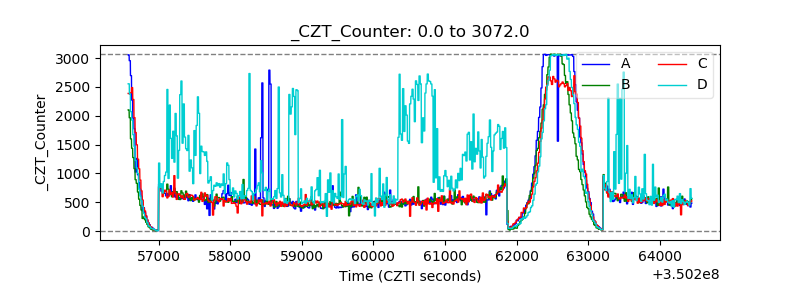 |
| +2.5 Volts monitor |  |
| +5 Volts monitor |  |
| _ROLL_ROT | 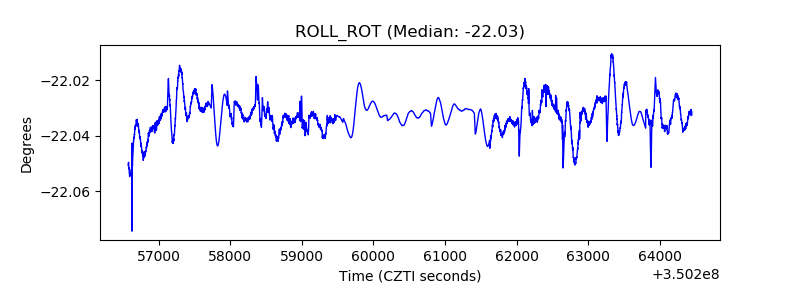 |
| _Roll_DEC | 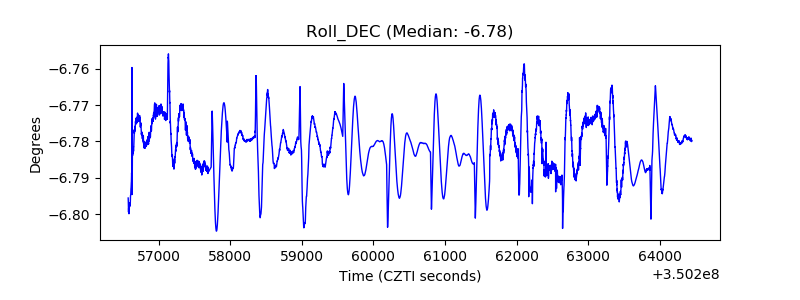 |
| _Roll_RA | 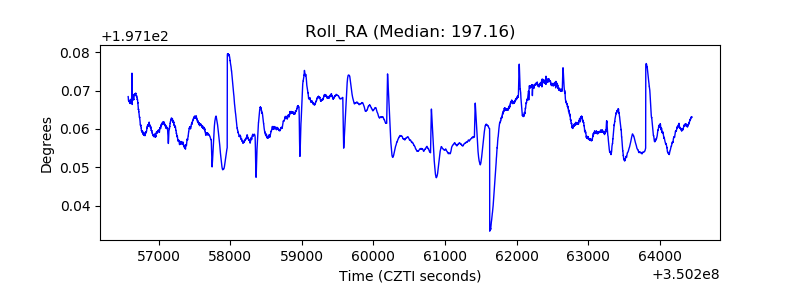 |
| Veto Counter | 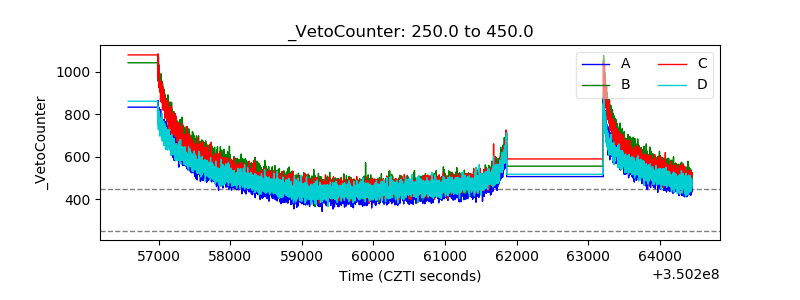 |