| Param | Original file | Final file |
|---|---|---|
| Filename | modeM0/AS1A10_048T03_9000004154_28981cztM0_level2.evt | modeM0/AS1A10_048T03_9000004154_28981cztM0_level2_quad_clean.evt |
| Size (bytes) | 561,061,440 | 97,634,880 |
| Size | 535.1 MB | 93.1 MB |
| Events in quadrant A | 3,395,786 | 629,948 |
| Events in quadrant B | 3,692,811 | 649,437 |
| Events in quadrant C | 3,477,459 | 618,255 |
| Events in quadrant D | 5,957,541 | 577,406 |
| Mode M9 | |||
|---|---|---|---|
| Quadrant | BADHDUFLAG | Total packets | Discarded packets |
| A | 0 | 16 | 0 |
| B | 0 | 17 | 0 |
| C | 0 | 17 | 0 |
| D | 0 | 17 | 0 |
| Mode M0 | |||
|---|---|---|---|
| Quadrant | BADHDUFLAG | Total packets | Discarded packets |
| A | 0 | 14443 | 2 |
| B | 0 | 15196 | 2 |
| C | 0 | 14541 | 2 |
| D | 0 | 22530 | 2 |
| Mode SS | |||
|---|---|---|---|
| Quadrant | BADHDUFLAG | Total packets | Discarded packets |
| A | 0 | 140 | 0 |
| B | 0 | 140 | 0 |
| C | 0 | 140 | 0 |
| D | 0 | 140 | 0 |
| Quadrant | Total seconds | Saturated seconds | Saturation percentage |
|---|---|---|---|
| A | 6912 | 45 | 0.651042% |
| B | 6912 | 82 | 1.186343% |
| C | 6912 | 78 | 1.128472% |
| D | 6911 | 354 | 5.122269% |
Noise dominated data is calculated using 1-second bins in cleaned event files. If a bin has >2000 counts, and if more than 50% of those come from <1% of pixels, then it is considered to be noise-dominated and hence unusable.
| Quadrant | # 1 sec bins | Bins with >0 counts | Bins with >2000 counts | High rate bins dominated by noise | Noise dominated (total time) | Noise dominated (detector-on time) | Marked lightcurve |
|---|---|---|---|---|---|---|---|
| A | 7936 | 6917 | 1 | 1 | 0.01% | 0.01% | 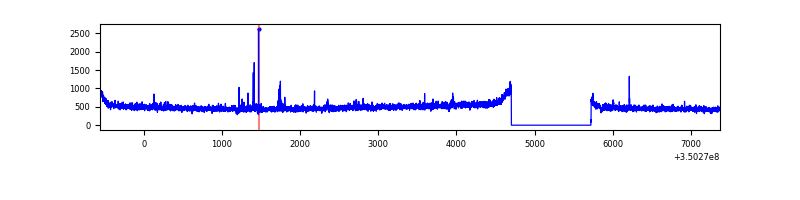 |
| B | 7936 | 6917 | 2 | 2 | 0.03% | 0.03% | 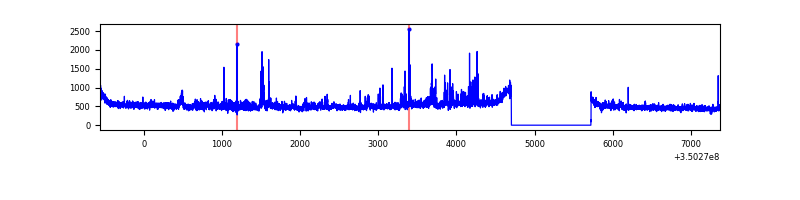 |
| C | 7936 | 6917 | 0 | 0 | 0.00% | 0.00% |  |
| D | 7935 | 6916 | 341 | 341 | 4.30% | 4.93% | 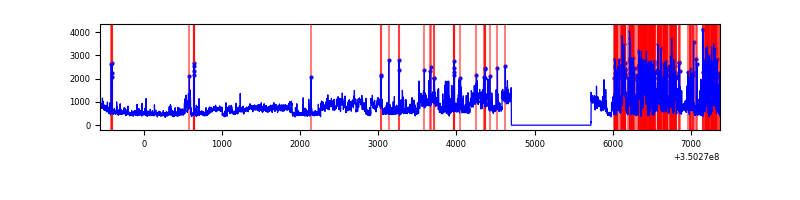 |
Top three noisy pixels from each quadrant. If the there are fewer than three noisy pixels in the level2.evt file, extra rows are filled as -1
| Pixel properties | Quadrant properties | ||||||
|---|---|---|---|---|---|---|---|
| Quadrant | DetID | PixID | Counts | Sigma | Mean | Median | Sigma |
| A | 15 | 192 | 26299 | 146.83 | 866 | 849 | 173.3 |
| A | 13 | 254 | 12636 | 68.0 | 866 | 849 | 173.3 |
| A | 13 | 6 | 10832 | 57.59 | 866 | 849 | 173.3 |
| B | 10 | 245 | 239901 | 1426.71 | 865 | 845 | 167.6 |
| B | 10 | 246 | 28126 | 162.82 | 865 | 845 | 167.6 |
| B | 12 | 111 | 20598 | 117.89 | 865 | 845 | 167.6 |
| C | 14 | 238 | 134459 | 682.79 | 834 | 842 | 195.7 |
| C | 3 | 233 | 80977 | 409.49 | 834 | 842 | 195.7 |
| C | 2 | 114 | 15837 | 76.62 | 834 | 842 | 195.7 |
| D | 8 | 195 | 1484813 | 7571.74 | 820 | 799 | 196.0 |
| D | 7 | 80 | 1246806 | 6357.38 | 820 | 799 | 196.0 |
| D | 1 | 52 | 56130 | 282.31 | 820 | 799 | 196.0 |
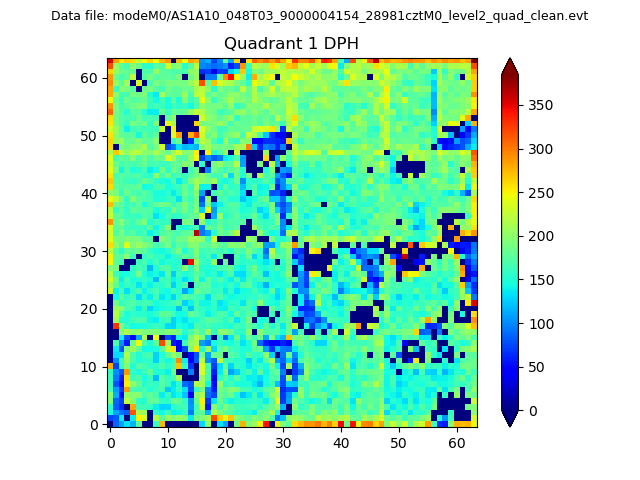
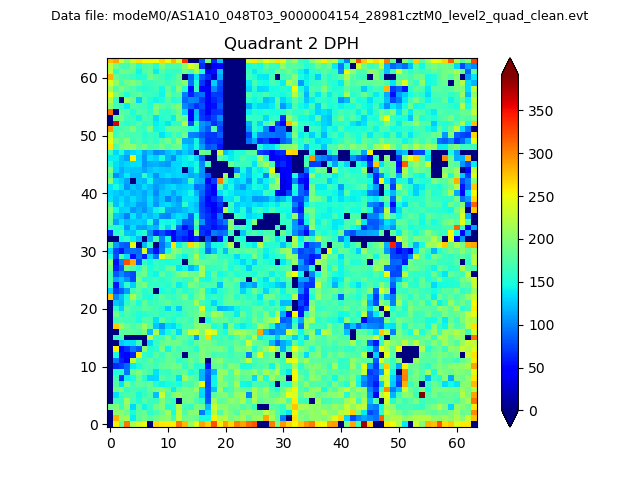
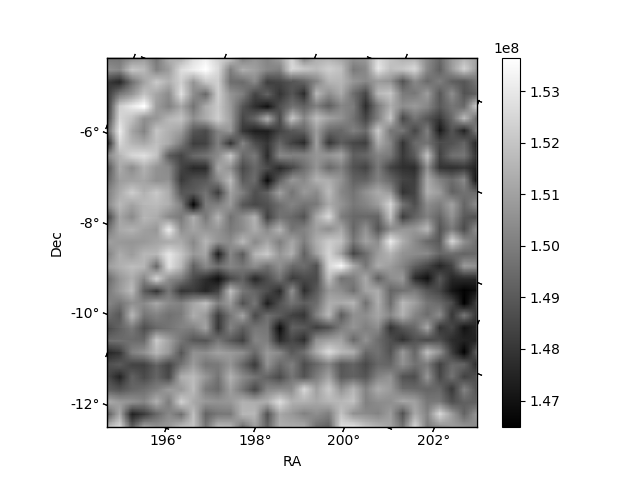
Histogram calculated using DETX and DETY for each event in the final _common_clean file
| Quadrant A |  |
 |
Quadrant B |
|---|---|---|---|
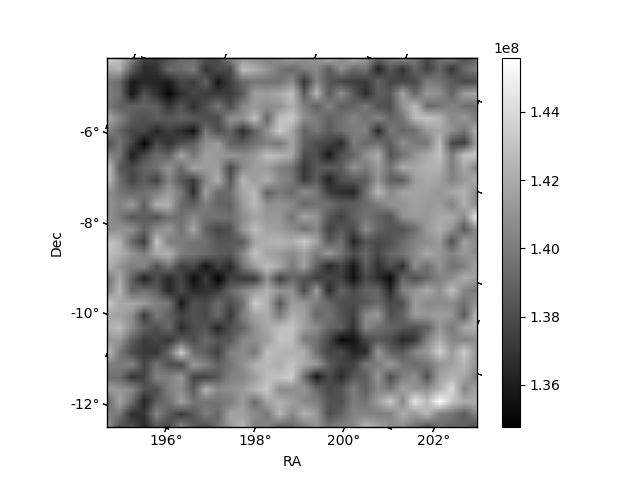
| Quadrant D | 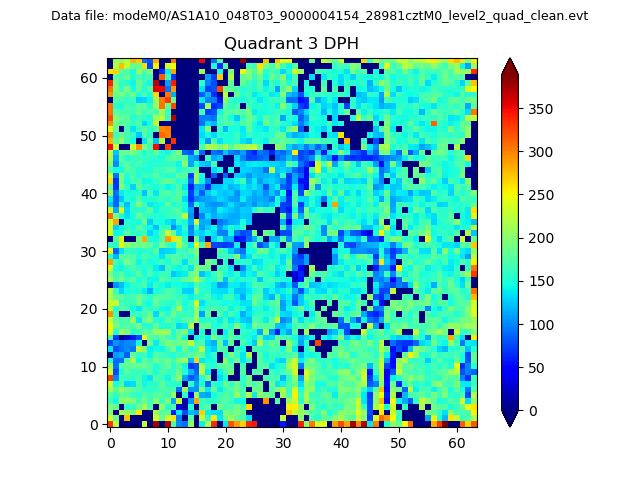 |
 |
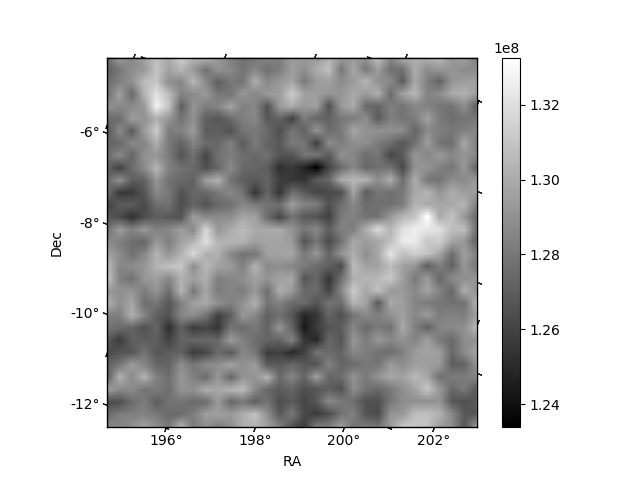
Quadrant C |
| Plot type | Count rate plots | Images |
|---|---|---|
| Comparison with Poisson distribution Blue bars denote a histogram of data divided into 1 sec bins. Red curve is a Poisson curve with rate = median count rate of data. |
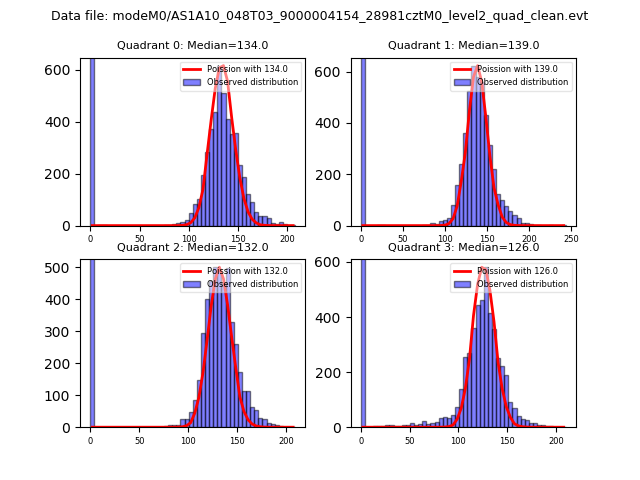 |
 |
| Quadrant-wise count rates Data is divided into 100 sec bins |
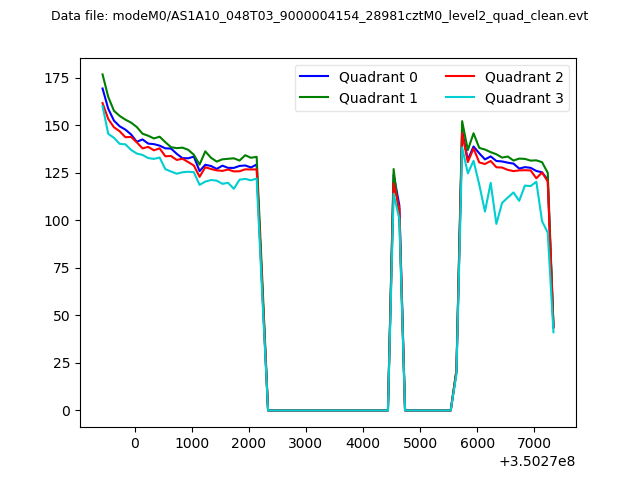 |
|
| Module-wise count rates for Quadrant A Data is divided into 100 sec bins |
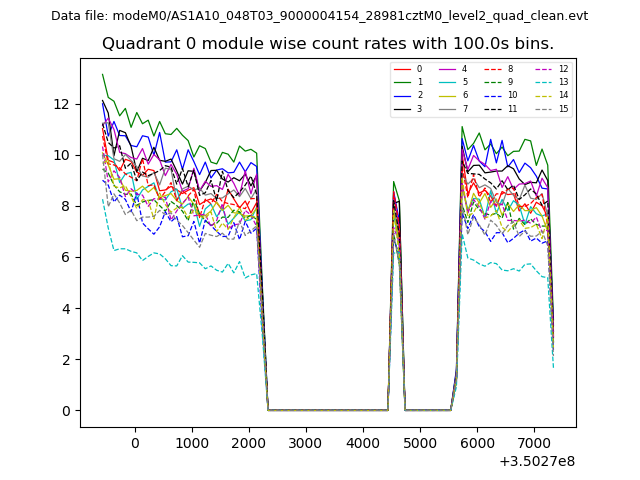 |
 |
| Module-wise count rates for Quadrant B Data is divided into 100 sec bins |
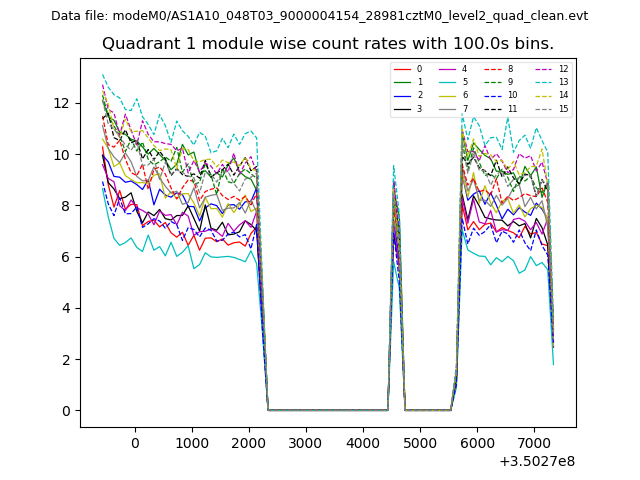 |
 |
| Module-wise count rates for Quadrant C Data is divided into 100 sec bins |
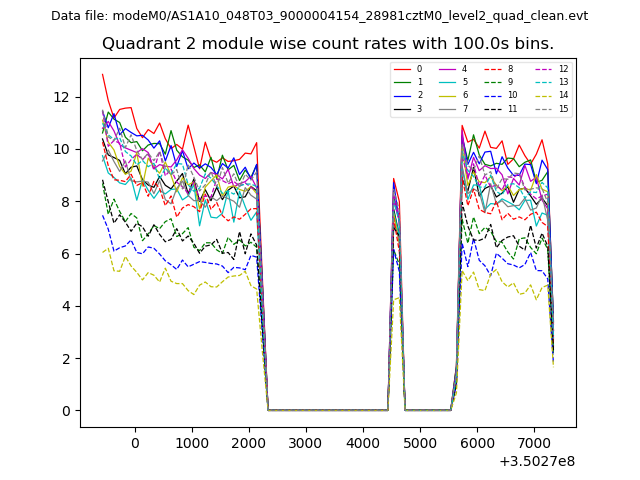 |
 |
| Module-wise count rates for Quadrant D Data is divided into 100 sec bins |
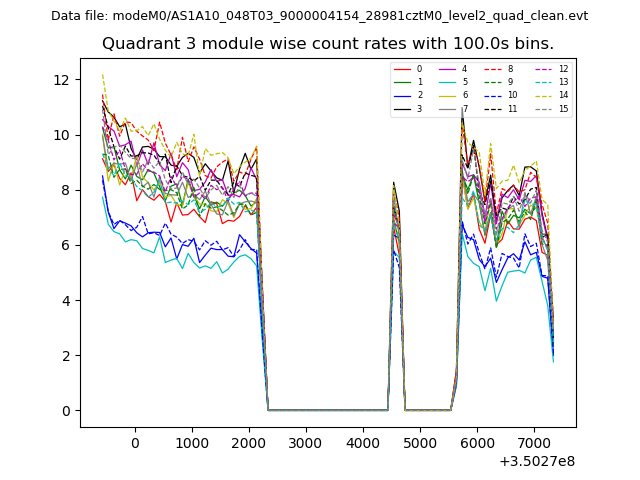 |
 |
| Parameter | Plot |
|---|---|
| CZT HV Monitor | 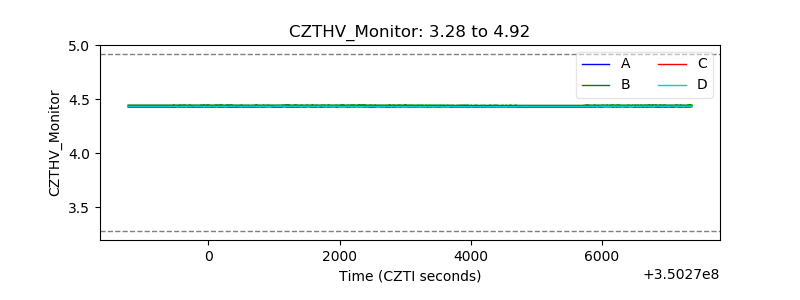 |
| D_VDD | 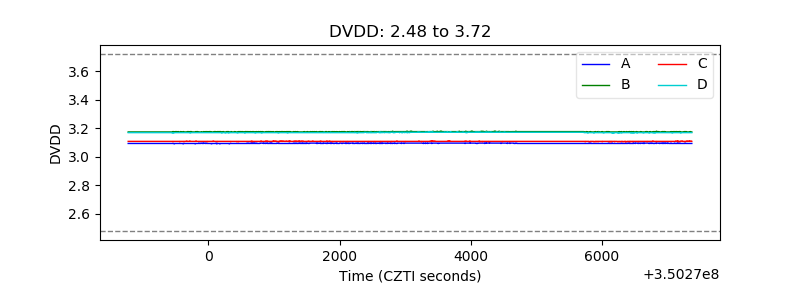 |
| Temperature 1 | 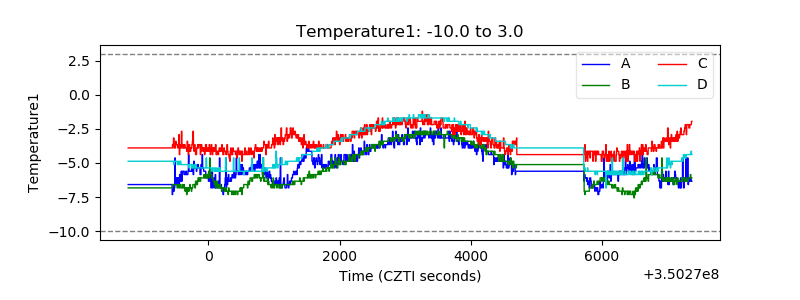 |
| Veto HV Monitor | 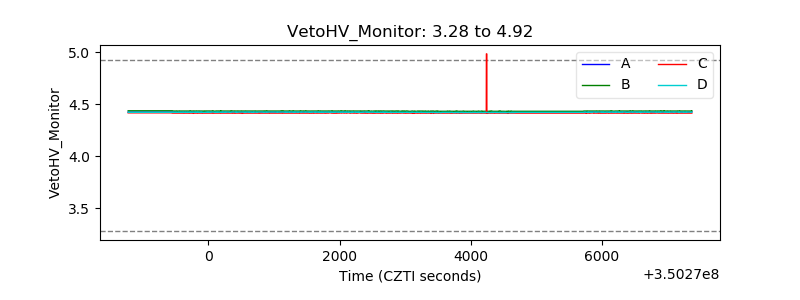 |
| Veto LLD | 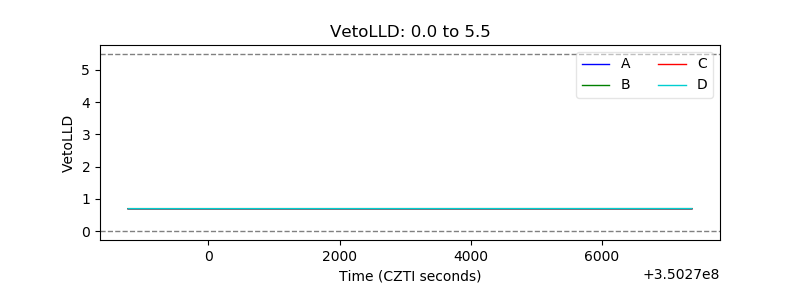 |
| Alpha Counter | 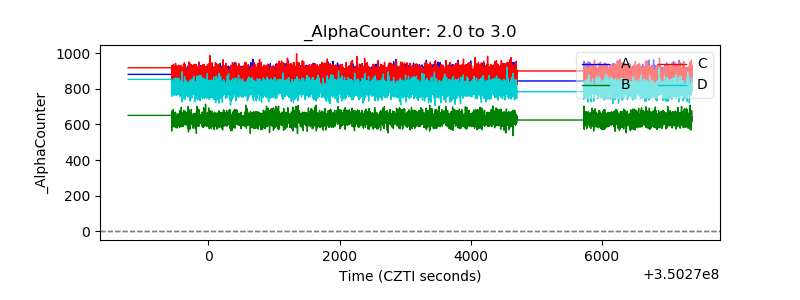 |
| _CPM_Rate | 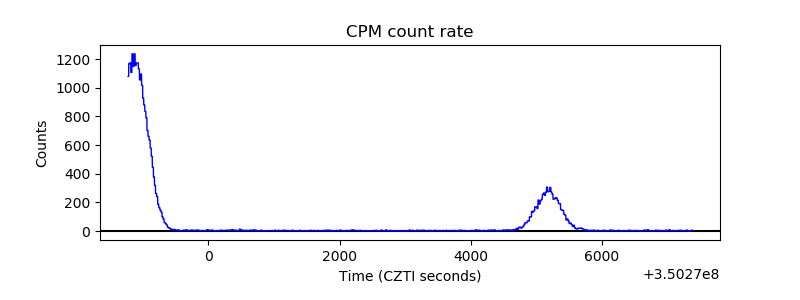 |
| CZT Counter | 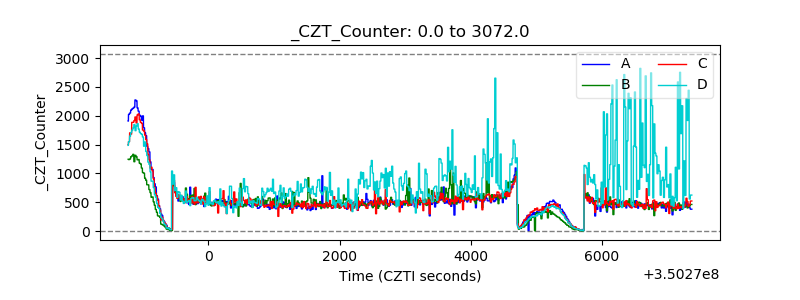 |
| +2.5 Volts monitor |  |
| +5 Volts monitor |  |
| _ROLL_ROT | 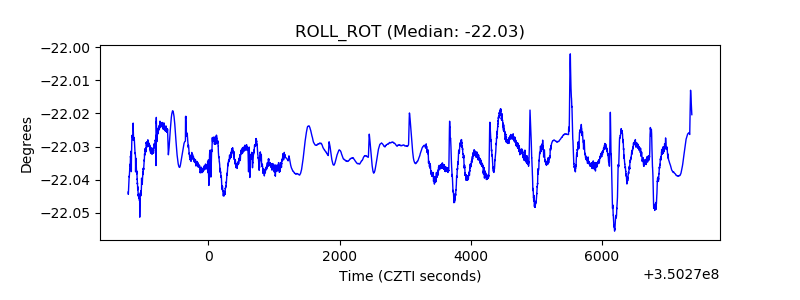 |
| _Roll_DEC | 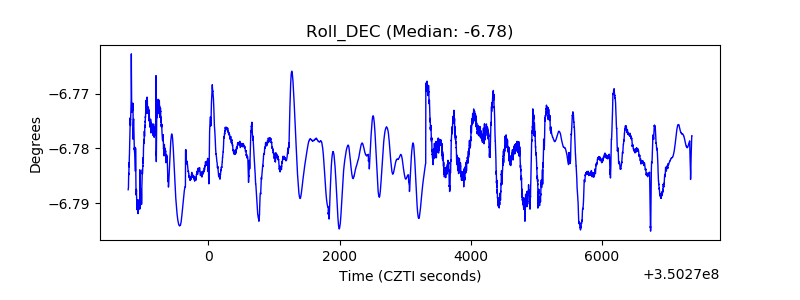 |
| _Roll_RA | 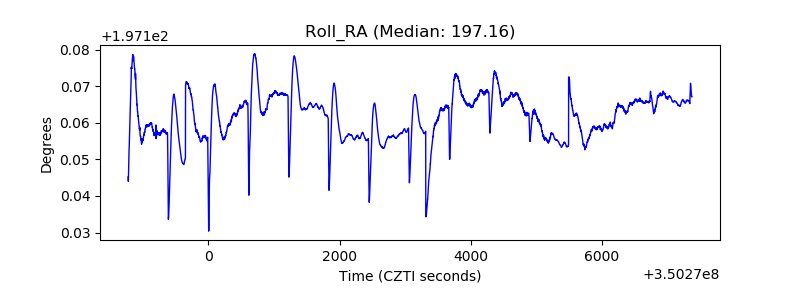 |
| Veto Counter | 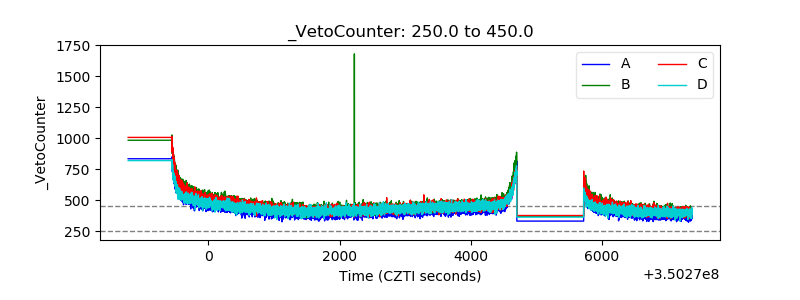 |