| Param | Original file | Final file |
|---|---|---|
| Filename | modeM0/AS1A10_048T03_9000004154_28983cztM0_level2.evt | modeM0/AS1A10_048T03_9000004154_28983cztM0_level2_quad_clean.evt |
| Size (bytes) | 403,479,360 | 58,069,440 |
| Size | 384.8 MB | 55.4 MB |
| Events in quadrant A | 2,553,837 | 357,919 |
| Events in quadrant B | 2,556,872 | 370,727 |
| Events in quadrant C | 2,411,536 | 353,521 |
| Events in quadrant D | 4,351,852 | 319,787 |
| Mode M9 | |||
|---|---|---|---|
| Quadrant | BADHDUFLAG | Total packets | Discarded packets |
| A | 0 | 2 | 0 |
| B | 0 | 3 | 0 |
| C | 0 | 3 | 0 |
| D | 0 | 3 | 0 |
| Mode M0 | |||
|---|---|---|---|
| Quadrant | BADHDUFLAG | Total packets | Discarded packets |
| A | 0 | 10881 | 1 |
| B | 0 | 10789 | 1 |
| C | 0 | 10332 | 1 |
| D | 0 | 16439 | 1 |
| Mode SS | |||
|---|---|---|---|
| Quadrant | BADHDUFLAG | Total packets | Discarded packets |
| A | 0 | 100 | 0 |
| B | 0 | 100 | 0 |
| C | 0 | 100 | 0 |
| D | 0 | 100 | 0 |
| Quadrant | Total seconds | Saturated seconds | Saturation percentage |
|---|---|---|---|
| A | 5083 | 20 | 0.393468% |
| B | 5083 | 24 | 0.472162% |
| C | 5083 | 49 | 0.963998% |
| D | 5083 | 454 | 8.931733% |
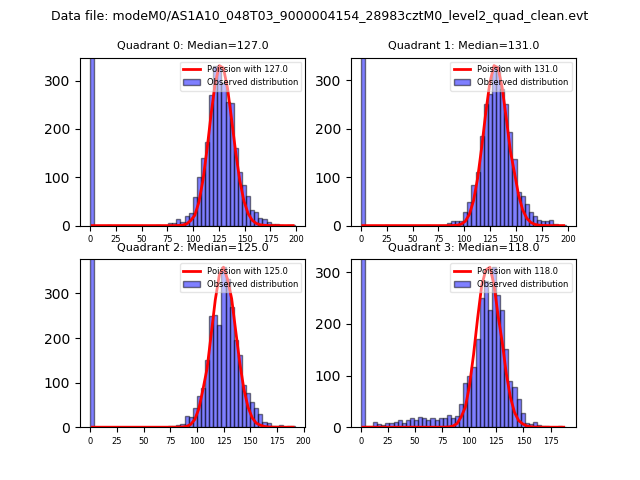
Noise dominated data is calculated using 1-second bins in cleaned event files. If a bin has >2000 counts, and if more than 50% of those come from <1% of pixels, then it is considered to be noise-dominated and hence unusable.
| Quadrant | # 1 sec bins | Bins with >0 counts | Bins with >2000 counts | High rate bins dominated by noise | Noise dominated (total time) | Noise dominated (detector-on time) | Marked lightcurve |
|---|---|---|---|---|---|---|---|
| A | 5084 | 5084 | 10 | 10 | 0.20% | 0.20% | 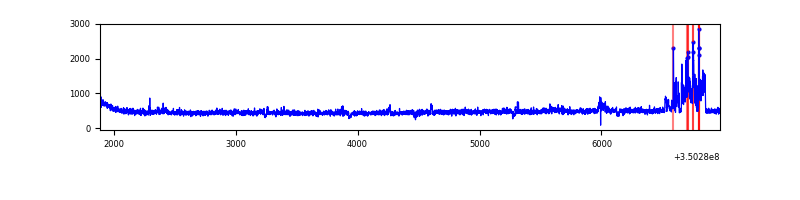 |
| B | 5084 | 5084 | 3 | 3 | 0.06% | 0.06% |  |
| C | 5084 | 5084 | 0 | 0 | 0.00% | 0.00% | 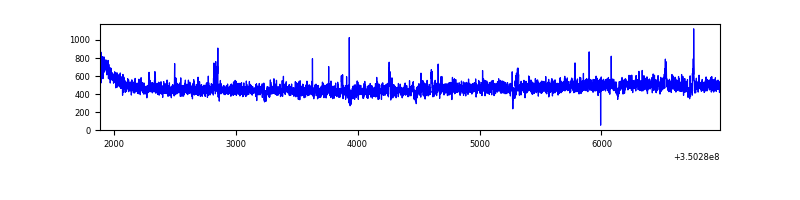 |
| D | 5084 | 5084 | 386 | 386 | 7.59% | 7.59% | 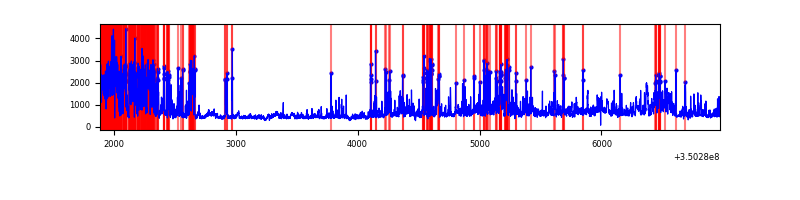 |
Top three noisy pixels from each quadrant. If the there are fewer than three noisy pixels in the level2.evt file, extra rows are filled as -1
| Pixel properties | Quadrant properties | ||||||
|---|---|---|---|---|---|---|---|
| Quadrant | DetID | PixID | Counts | Sigma | Mean | Median | Sigma |
| A | 15 | 174 | 168309 | 1358.46 | 606 | 591 | 123.5 |
| A | 6 | 16 | 14841 | 115.42 | 606 | 591 | 123.5 |
| A | 13 | 6 | 11638 | 89.48 | 606 | 591 | 123.5 |
| B | 10 | 245 | 158762 | 1351.47 | 604 | 589 | 117.0 |
| B | 10 | 246 | 18585 | 153.76 | 604 | 589 | 117.0 |
| B | 12 | 111 | 14243 | 116.66 | 604 | 589 | 117.0 |
| C | 14 | 238 | 96217 | 681.08 | 587 | 591 | 140.4 |
| C | 2 | 114 | 12001 | 81.27 | 587 | 591 | 140.4 |
| C | 3 | 233 | 9478 | 63.3 | 587 | 591 | 140.4 |
| D | 7 | 80 | 1273599 | 9284.65 | 566 | 550 | 137.1 |
| D | 8 | 195 | 542673 | 3953.83 | 566 | 550 | 137.1 |
| D | 5 | 233 | 155526 | 1130.28 | 566 | 550 | 137.1 |
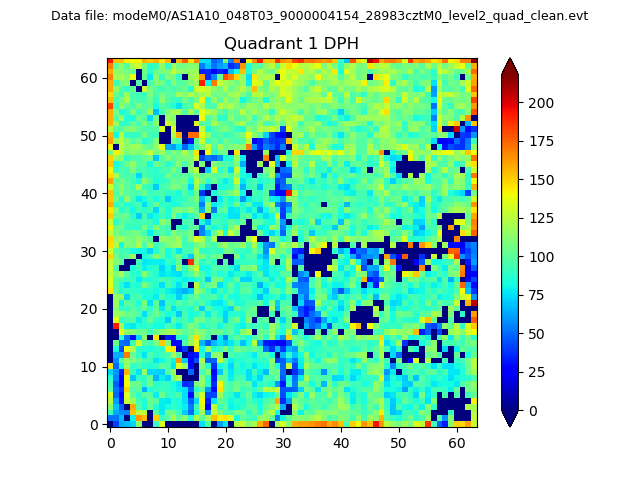
Histogram calculated using DETX and DETY for each event in the final _common_clean file
| Quadrant A | 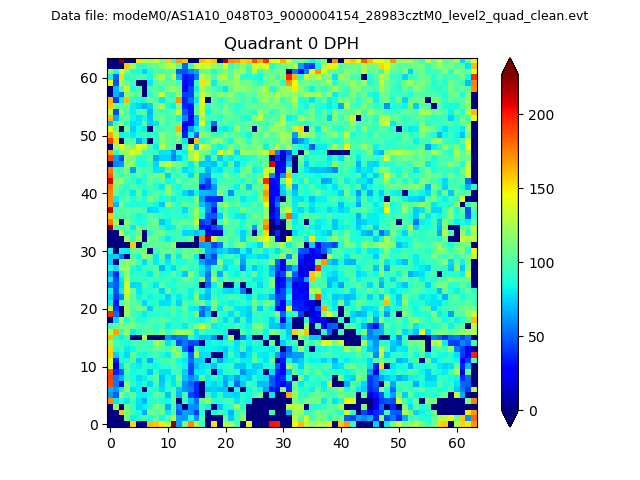 |
 |
Quadrant B |
|---|---|---|---|
| Quadrant D | 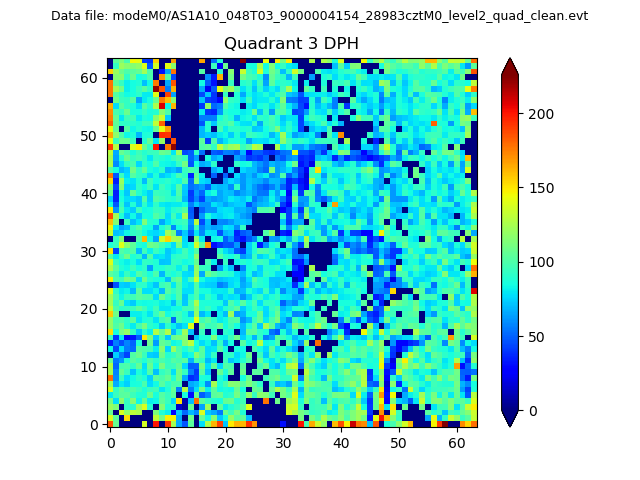 |
 |
Quadrant C |
| Plot type | Count rate plots | Images |
|---|---|---|
| Comparison with Poisson distribution Blue bars denote a histogram of data divided into 1 sec bins. Red curve is a Poisson curve with rate = median count rate of data. |
 |
 |
| Quadrant-wise count rates Data is divided into 100 sec bins |
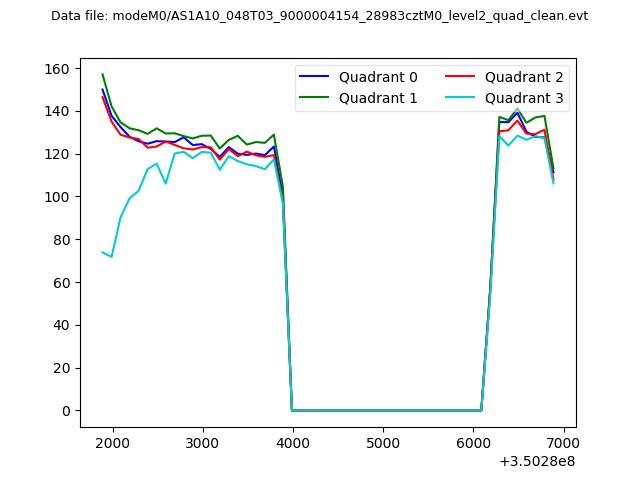 |
|
| Module-wise count rates for Quadrant A Data is divided into 100 sec bins |
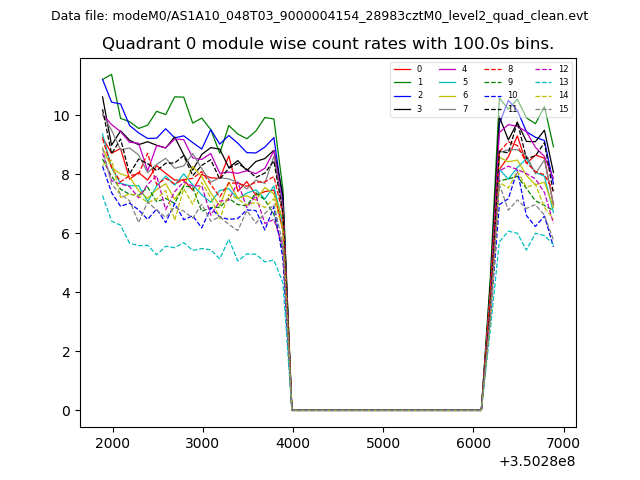 |
 |
| Module-wise count rates for Quadrant B Data is divided into 100 sec bins |
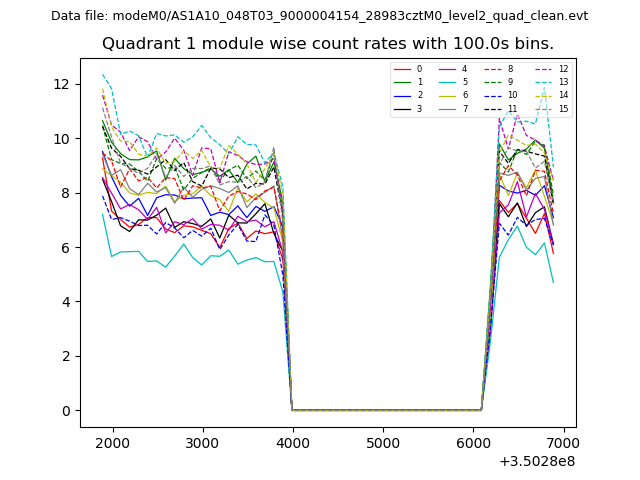 |
 |
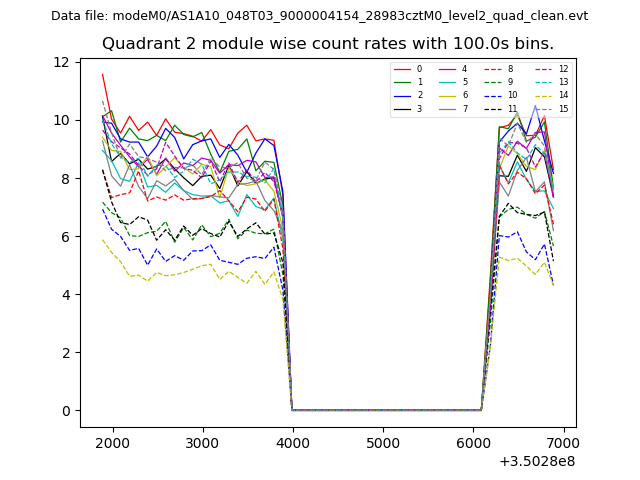
| Module-wise count rates for Quadrant C Data is divided into 100 sec bins |
 |
 |
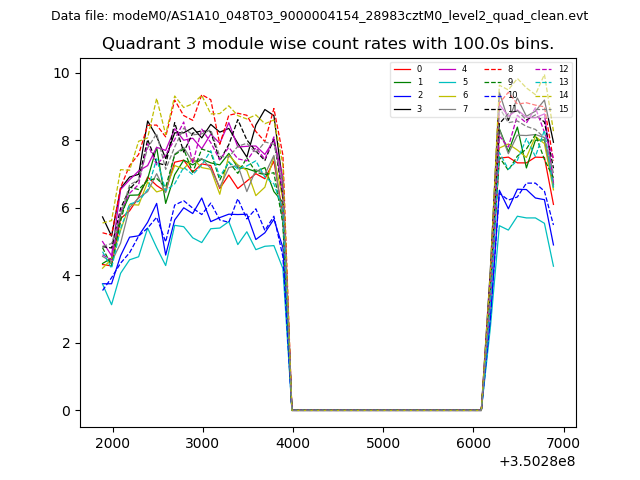
| Module-wise count rates for Quadrant D Data is divided into 100 sec bins |
 |
 |
| Parameter | Plot |
|---|---|
| CZT HV Monitor | 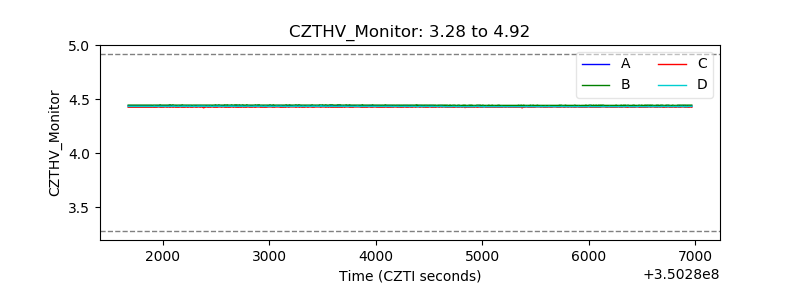 |
| D_VDD | 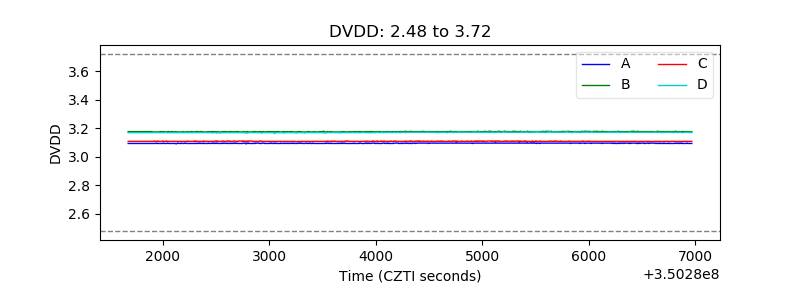 |
| Temperature 1 | 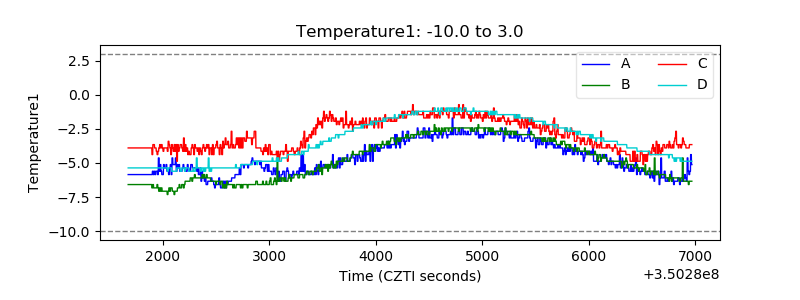 |
| Veto HV Monitor | 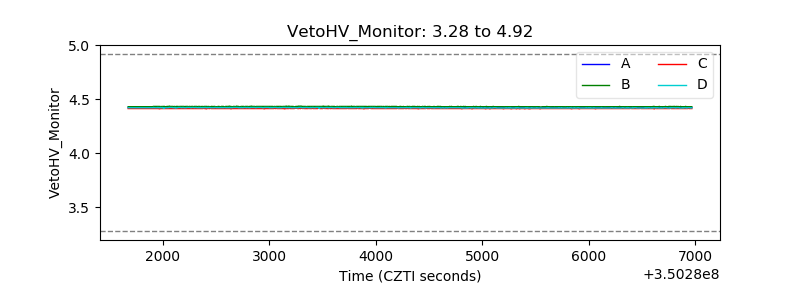 |
| Veto LLD | 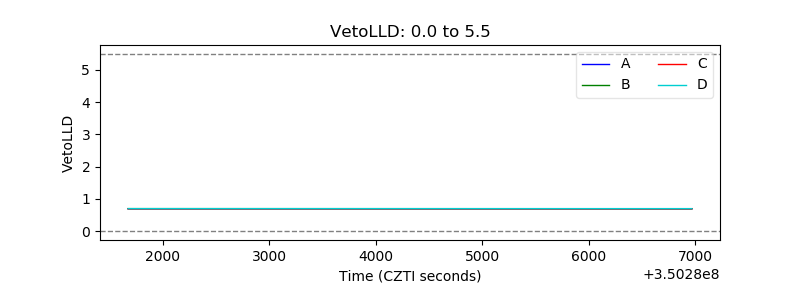 |
| Alpha Counter | 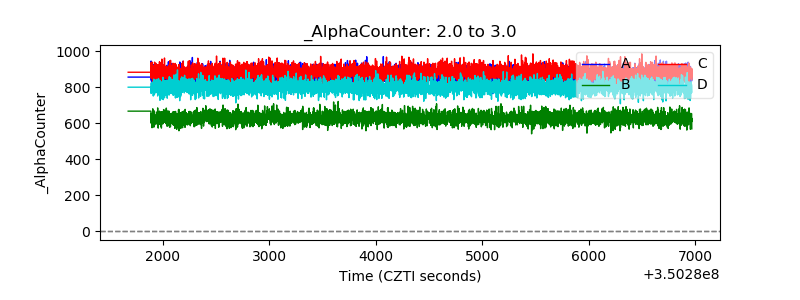 |
| _CPM_Rate | 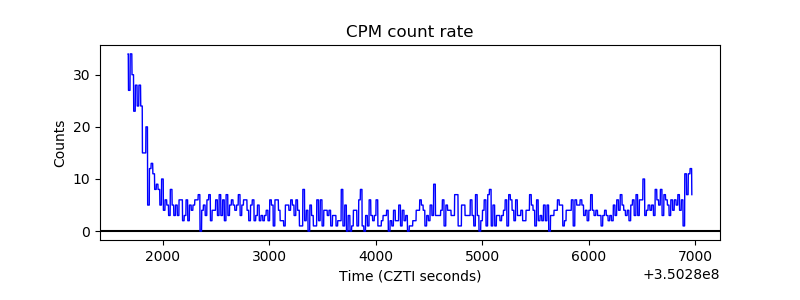 |
| CZT Counter | 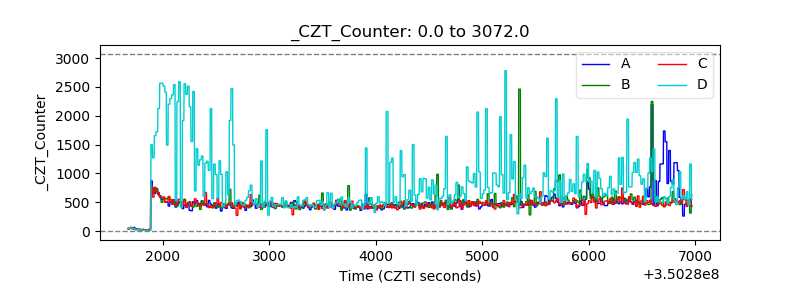 |
| +2.5 Volts monitor |  |
| +5 Volts monitor |  |
| _ROLL_ROT | 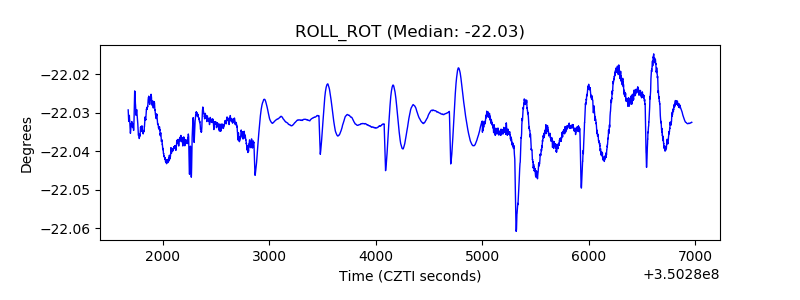 |
| _Roll_DEC | 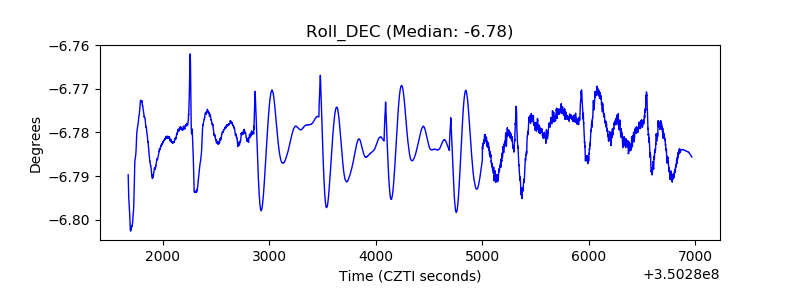 |
| _Roll_RA |  |
| Veto Counter | 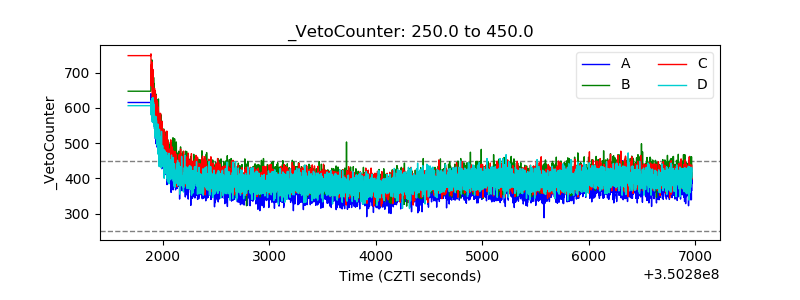 |