| Param | Original file | Final file |
|---|---|---|
| Filename | modeM0/AS1A10_073T06_9000004156_28984cztM0_level2.evt | modeM0/AS1A10_073T06_9000004156_28984cztM0_level2_quad_clean.evt |
| Size (bytes) | 587,396,160 | 79,977,600 |
| Size | 560.2 MB | 76.3 MB |
| Events in quadrant A | 4,006,904 | 474,584 |
| Events in quadrant B | 4,047,697 | 486,246 |
| Events in quadrant C | 3,933,002 | 457,539 |
| Events in quadrant D | 5,250,578 | 439,040 |
| Mode M9 | |||
|---|---|---|---|
| Quadrant | BADHDUFLAG | Total packets | Discarded packets |
| A | 0 | 6 | 0 |
| B | 0 | 6 | 0 |
| C | 0 | 6 | 0 |
| D | 0 | 6 | 0 |
| Mode SS | |||
|---|---|---|---|
| Quadrant | BADHDUFLAG | Total packets | Discarded packets |
| A | 0 | 166 | 0 |
| B | 0 | 166 | 0 |
| C | 0 | 166 | 0 |
| D | 0 | 166 | 0 |
| Mode M0 | |||
|---|---|---|---|
| Quadrant | BADHDUFLAG | Total packets | Discarded packets |
| A | 0 | 17027 | 2 |
| B | 0 | 17265 | 2 |
| C | 0 | 16951 | 2 |
| D | 0 | 20996 | 2 |
| Quadrant | Total seconds | Saturated seconds | Saturation percentage |
|---|---|---|---|
| A | 8135 | 282 | 3.466503% |
| B | 8135 | 356 | 4.376152% |
| C | 8136 | 288 | 3.539823% |
| D | 8136 | 342 | 4.203540% |
Noise dominated data is calculated using 1-second bins in cleaned event files. If a bin has >2000 counts, and if more than 50% of those come from <1% of pixels, then it is considered to be noise-dominated and hence unusable.
| Quadrant | # 1 sec bins | Bins with >0 counts | Bins with >2000 counts | High rate bins dominated by noise | Noise dominated (total time) | Noise dominated (detector-on time) | Marked lightcurve |
|---|---|---|---|---|---|---|---|
| A | 8530 | 8136 | 0 | 0 | 0.00% | 0.00% | 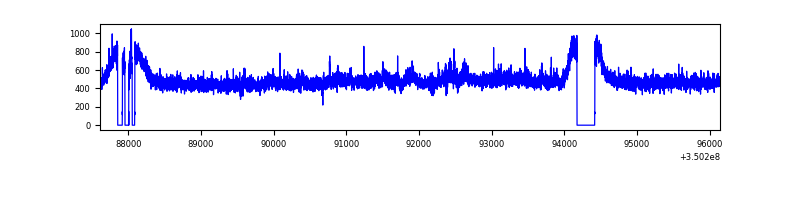 |
| B | 8530 | 8136 | 1 | 1 | 0.01% | 0.01% | 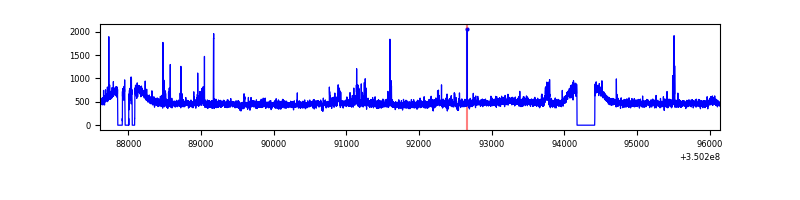 |
| C | 8531 | 8137 | 0 | 0 | 0.00% | 0.00% | 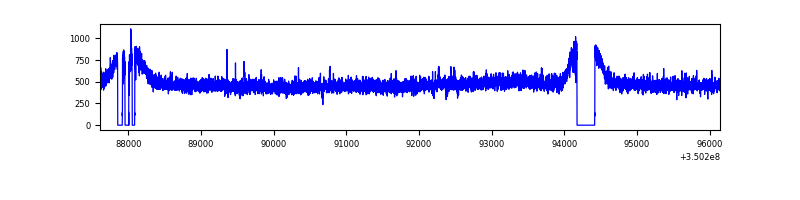 |
| D | 8531 | 8137 | 107 | 107 | 1.25% | 1.31% | 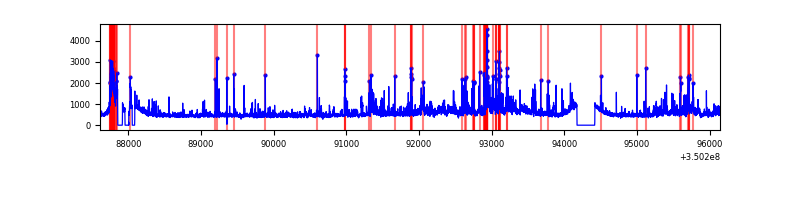 |
Top three noisy pixels from each quadrant. If the there are fewer than three noisy pixels in the level2.evt file, extra rows are filled as -1
| Pixel properties | Quadrant properties | ||||||
|---|---|---|---|---|---|---|---|
| Quadrant | DetID | PixID | Counts | Sigma | Mean | Median | Sigma |
| A | 6 | 16 | 121014 | 593.42 | 1000 | 977 | 202.3 |
| A | 13 | 254 | 13220 | 60.53 | 1000 | 977 | 202.3 |
| A | 13 | 6 | 11350 | 51.28 | 1000 | 977 | 202.3 |
| B | 10 | 245 | 108597 | 549.85 | 997 | 967 | 195.7 |
| B | 12 | 111 | 24900 | 122.27 | 997 | 967 | 195.7 |
| B | 11 | 111 | 22765 | 111.36 | 997 | 967 | 195.7 |
| C | 14 | 238 | 154018 | 669.09 | 964 | 965 | 228.7 |
| C | 2 | 114 | 19340 | 80.33 | 964 | 965 | 228.7 |
| C | 13 | 61 | 6580 | 24.55 | 964 | 965 | 228.7 |
| D | 7 | 80 | 557239 | 2423.23 | 956 | 927 | 229.6 |
| D | 8 | 195 | 542320 | 2358.24 | 956 | 927 | 229.6 |
| D | 1 | 52 | 334894 | 1454.72 | 956 | 927 | 229.6 |
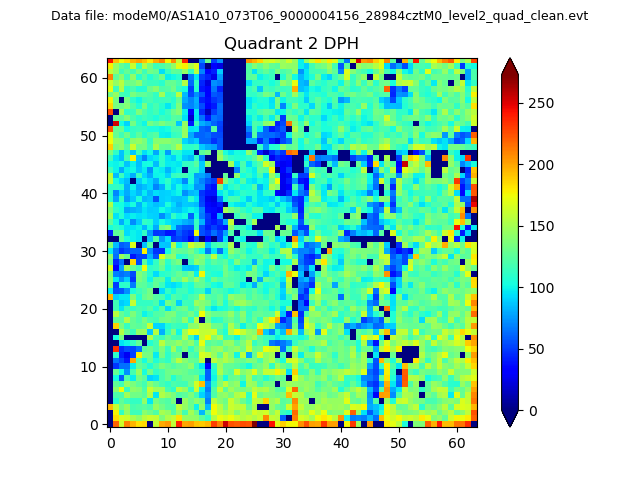
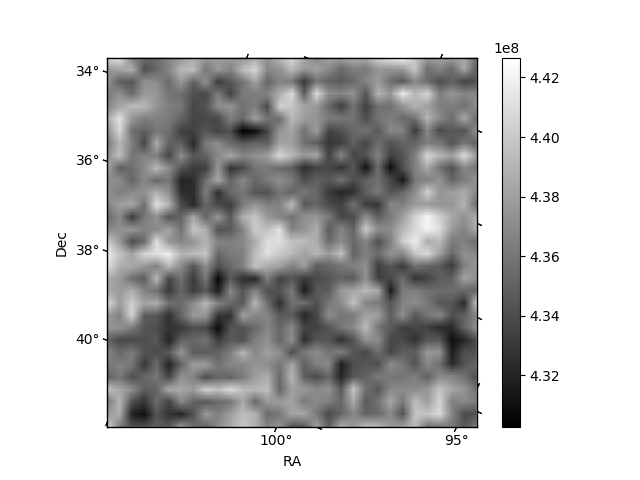
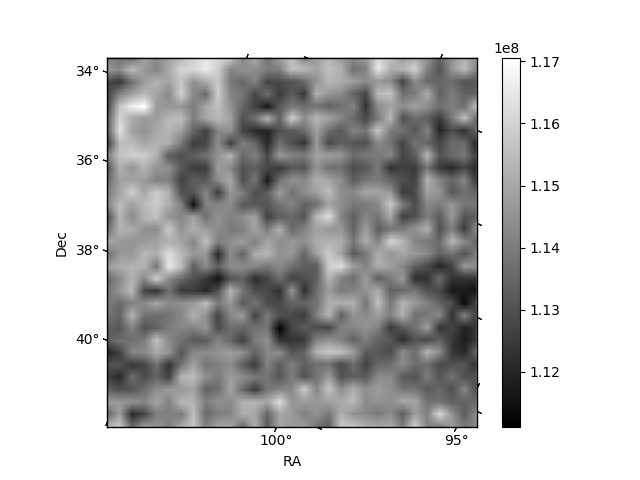
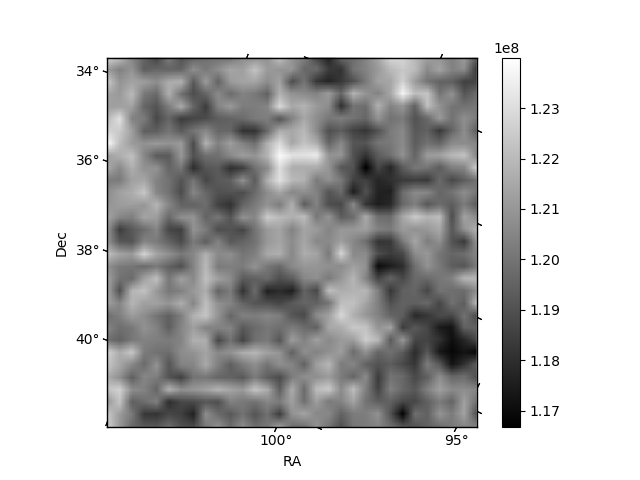
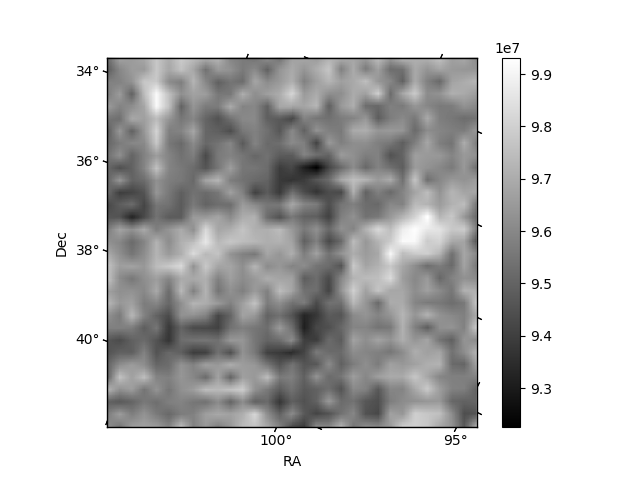
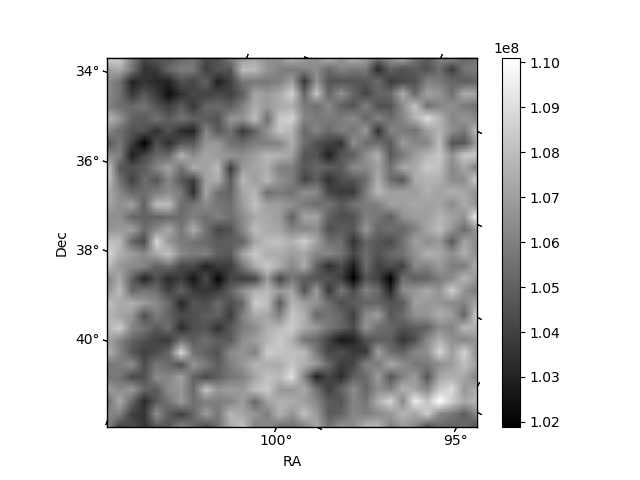
Histogram calculated using DETX and DETY for each event in the final _common_clean file
| Quadrant A | 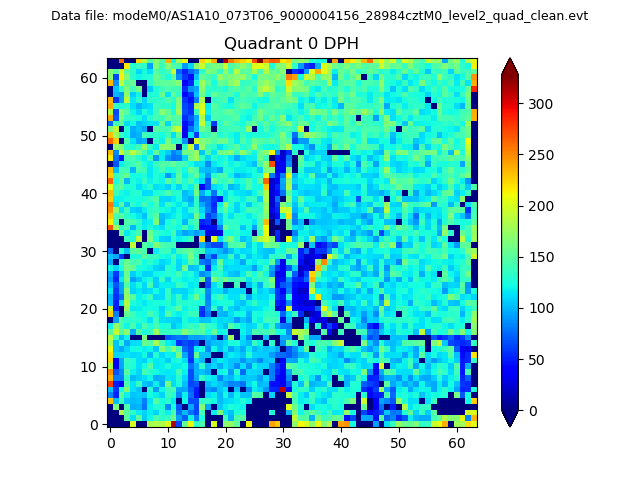 |
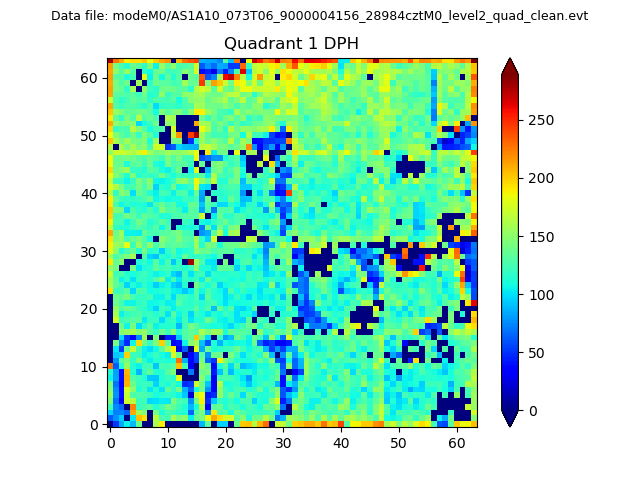 |
Quadrant B |
|---|---|---|---|
| Quadrant D | 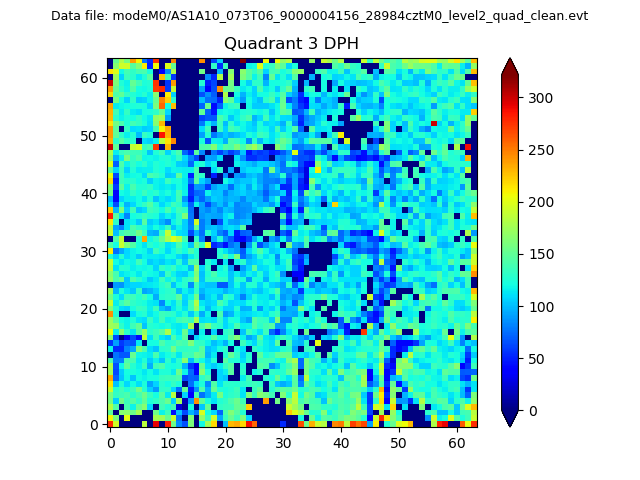 |
 |
Quadrant C |
| Plot type | Count rate plots | Images |
|---|---|---|
| Comparison with Poisson distribution Blue bars denote a histogram of data divided into 1 sec bins. Red curve is a Poisson curve with rate = median count rate of data. |
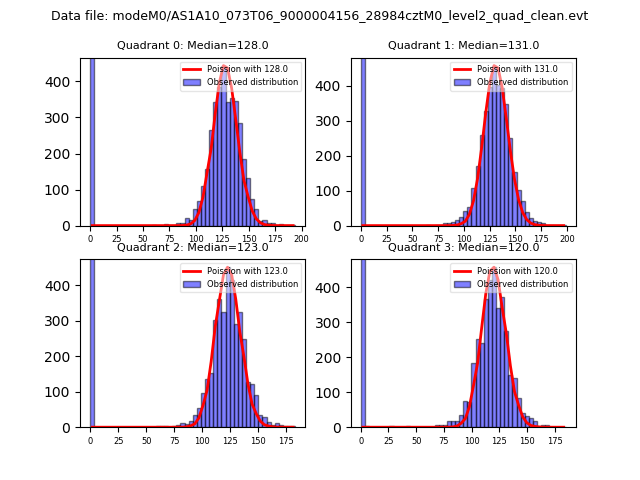 |
 |
| Quadrant-wise count rates Data is divided into 100 sec bins |
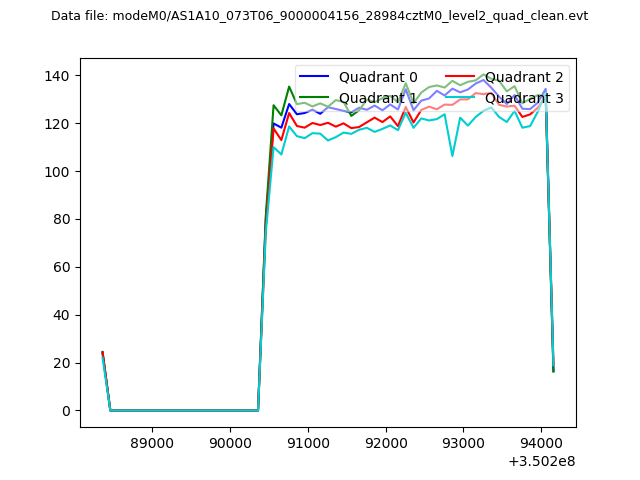 |
|
| Module-wise count rates for Quadrant A Data is divided into 100 sec bins |
 |
 |
| Module-wise count rates for Quadrant B Data is divided into 100 sec bins |
 |
 |
| Module-wise count rates for Quadrant C Data is divided into 100 sec bins |
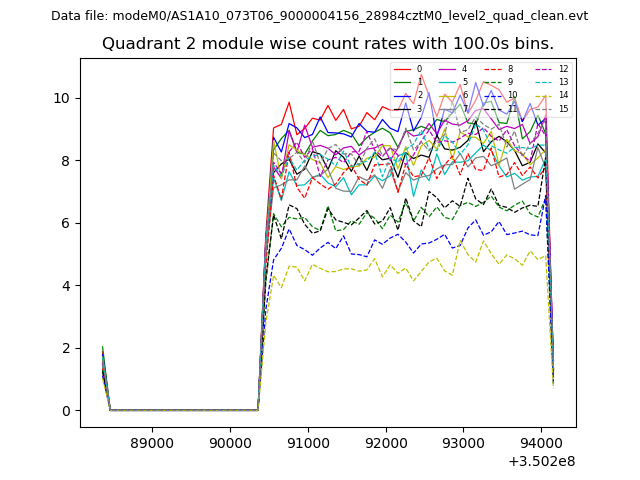 |
 |
| Module-wise count rates for Quadrant D Data is divided into 100 sec bins |
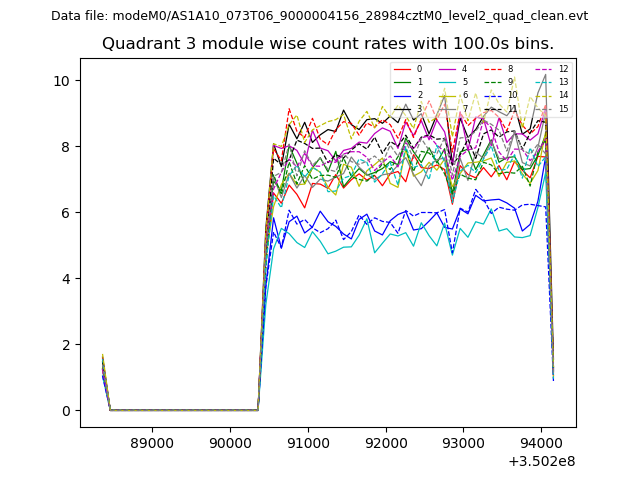 |
 |
| Parameter | Plot |
|---|---|
| CZT HV Monitor | 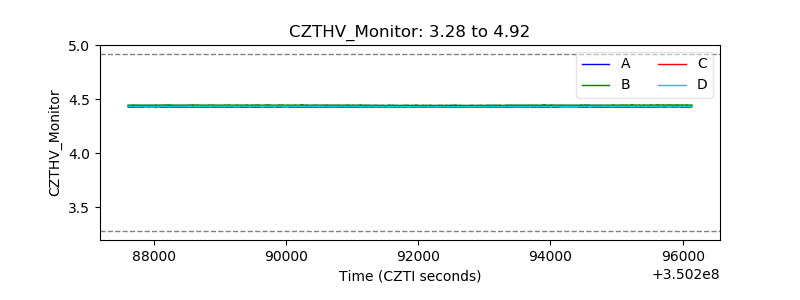 |
| D_VDD | 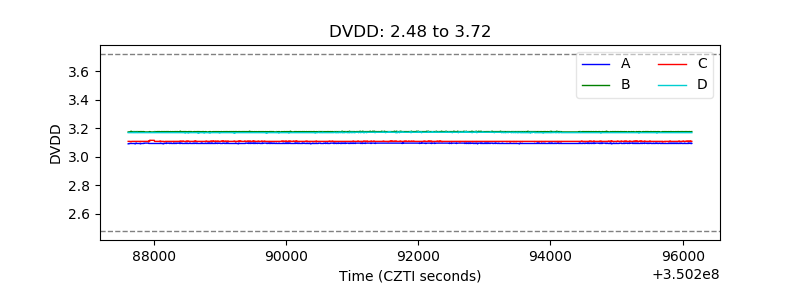 |
| Temperature 1 | 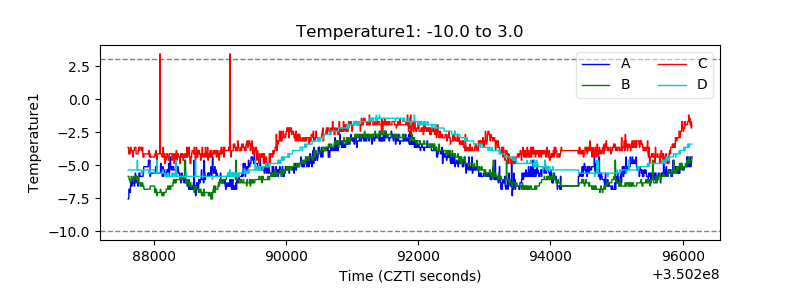 |
| Veto HV Monitor | 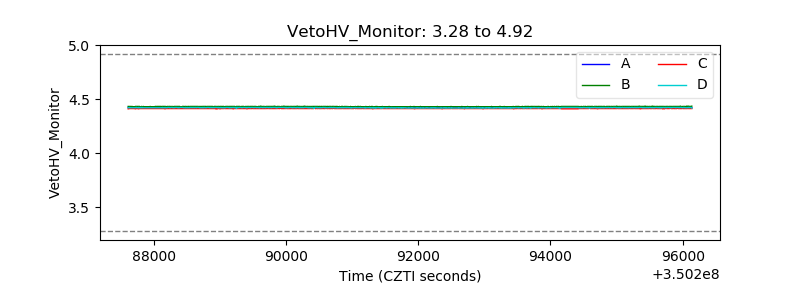 |
| Veto LLD | 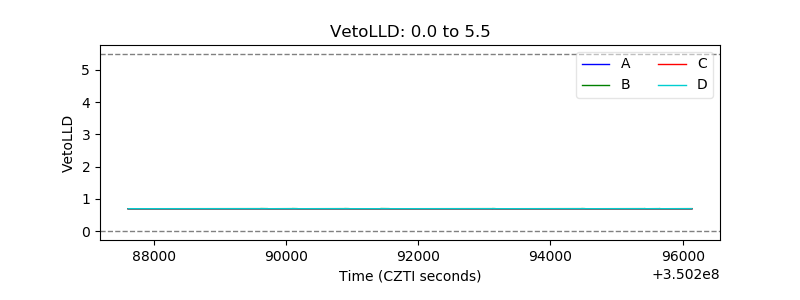 |
| Alpha Counter | 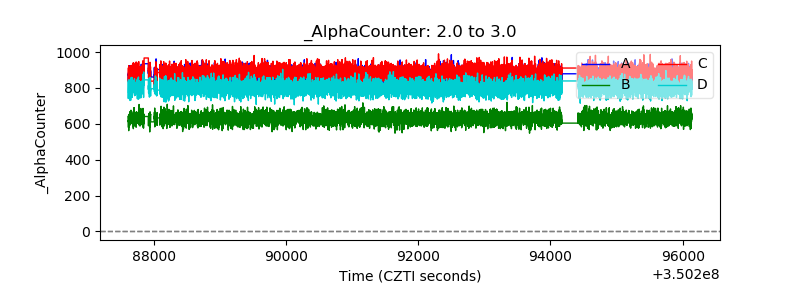 |
| _CPM_Rate | 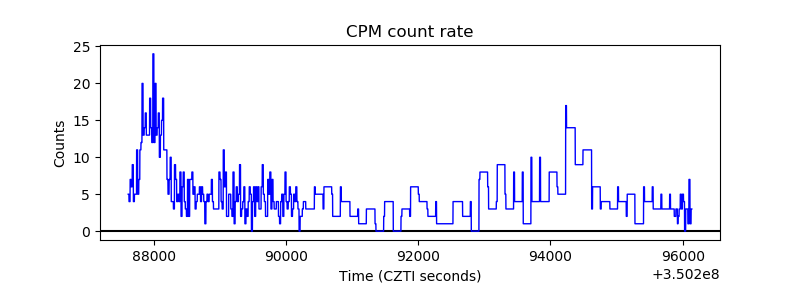 |
| CZT Counter | 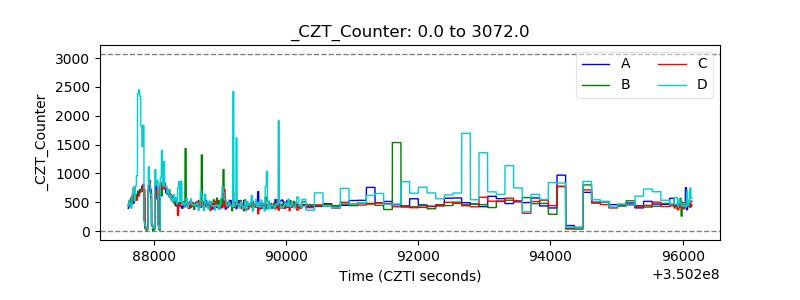 |
| +2.5 Volts monitor |  |
| +5 Volts monitor |  |
| _ROLL_ROT | 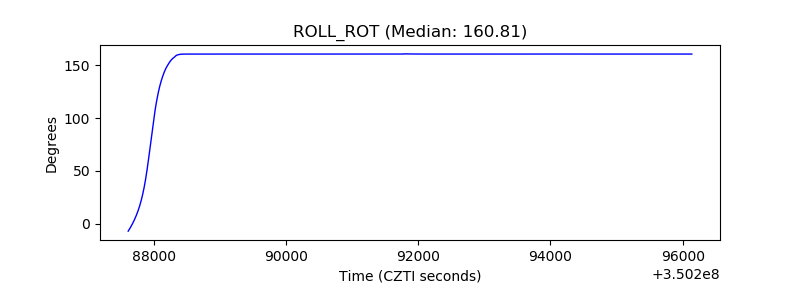 |
| _Roll_DEC | 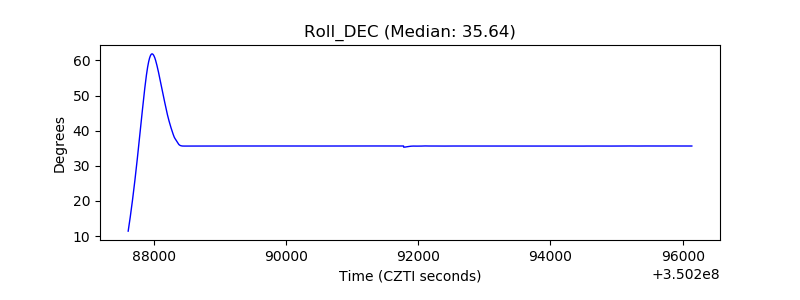 |
| _Roll_RA | 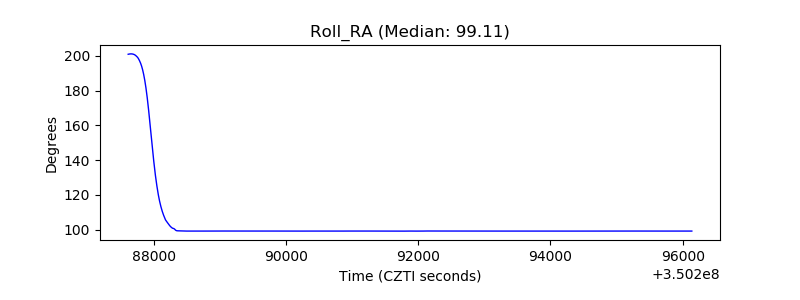 |
| Veto Counter |  |