| Param | Original file | Final file |
|---|---|---|
| Filename | modeM0/AS1A10_073T06_9000004156_28987cztM0_level2.evt | modeM0/AS1A10_073T06_9000004156_28987cztM0_level2_quad_clean.evt |
| Size (bytes) | 1,424,119,680 | 223,557,120 |
| Size | 1.3 GB | 213.2 MB |
| Events in quadrant A | 8,396,481 | 1,440,062 |
| Events in quadrant B | 13,297,130 | 1,388,874 |
| Events in quadrant C | 8,452,250 | 1,386,872 |
| Events in quadrant D | 11,776,114 | 1,321,542 |
| Mode M9 | |||
|---|---|---|---|
| Quadrant | BADHDUFLAG | Total packets | Discarded packets |
| A | 0 | 21 | 0 |
| B | 0 | 21 | 0 |
| C | 0 | 21 | 0 |
| D | 0 | 21 | 0 |
| Mode SS | |||
|---|---|---|---|
| Quadrant | BADHDUFLAG | Total packets | Discarded packets |
| A | 0 | 364 | 0 |
| B | 0 | 364 | 0 |
| C | 0 | 364 | 0 |
| D | 0 | 364 | 0 |
| Mode M0 | |||
|---|---|---|---|
| Quadrant | BADHDUFLAG | Total packets | Discarded packets |
| A | 0 | 36578 | 4 |
| B | 0 | 51024 | 4 |
| C | 0 | 36573 | 4 |
| D | 0 | 46559 | 4 |
| Quadrant | Total seconds | Saturated seconds | Saturation percentage |
|---|---|---|---|
| A | 17893 | 310 | 1.732521% |
| B | 17894 | 1628 | 9.098022% |
| C | 17894 | 364 | 2.034201% |
| D | 17894 | 542 | 3.028948% |
Noise dominated data is calculated using 1-second bins in cleaned event files. If a bin has >2000 counts, and if more than 50% of those come from <1% of pixels, then it is considered to be noise-dominated and hence unusable.
| Quadrant | # 1 sec bins | Bins with >0 counts | Bins with >2000 counts | High rate bins dominated by noise | Noise dominated (total time) | Noise dominated (detector-on time) | Marked lightcurve |
|---|---|---|---|---|---|---|---|
| A | 19988 | 17897 | 0 | 0 | 0.00% | 0.00% |  |
| B | 19989 | 17898 | 1169 | 1169 | 5.85% | 6.53% |  |
| C | 19989 | 17898 | 1 | 1 | 0.01% | 0.01% |  |
| D | 19989 | 17898 | 341 | 341 | 1.71% | 1.91% |  |
Top three noisy pixels from each quadrant. If the there are fewer than three noisy pixels in the level2.evt file, extra rows are filled as -1
| Pixel properties | Quadrant properties | ||||||
|---|---|---|---|---|---|---|---|
| Quadrant | DetID | PixID | Counts | Sigma | Mean | Median | Sigma |
| A | 6 | 16 | 63178 | 141.41 | 2149 | 2100 | 431.9 |
| A | 13 | 254 | 31539 | 68.16 | 2149 | 2100 | 431.9 |
| A | 3 | 137 | 21844 | 45.71 | 2149 | 2100 | 431.9 |
| B | 10 | 245 | 4751404 | 11854.35 | 2093 | 2038 | 400.6 |
| B | 4 | 80 | 193268 | 477.31 | 2093 | 2038 | 400.6 |
| B | 12 | 111 | 50973 | 122.14 | 2093 | 2038 | 400.6 |
| C | 14 | 238 | 332195 | 679.58 | 2066 | 2073 | 485.8 |
| C | 2 | 114 | 41969 | 82.13 | 2066 | 2073 | 485.8 |
| C | 2 | 16 | 20376 | 37.68 | 2066 | 2073 | 485.8 |
| D | 8 | 195 | 1433610 | 2929.9 | 2060 | 1999 | 488.6 |
| D | 1 | 52 | 921630 | 1882.09 | 2060 | 1999 | 488.6 |
| D | 7 | 80 | 629905 | 1285.06 | 2060 | 1999 | 488.6 |
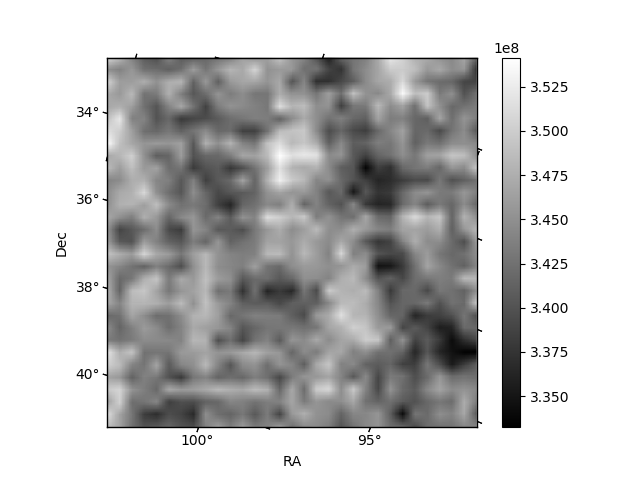
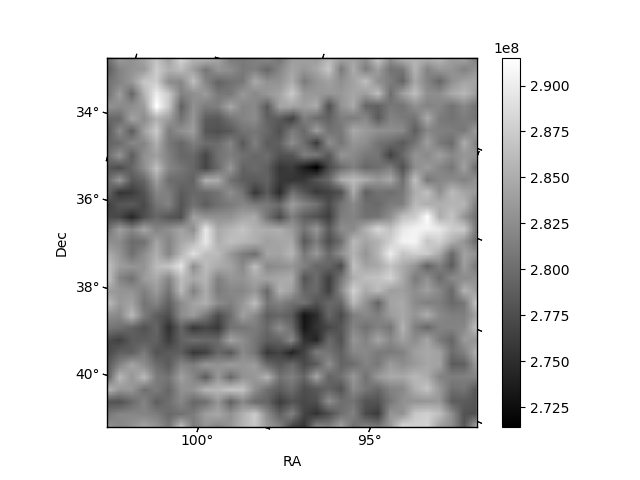
Histogram calculated using DETX and DETY for each event in the final _common_clean file
| Quadrant A | 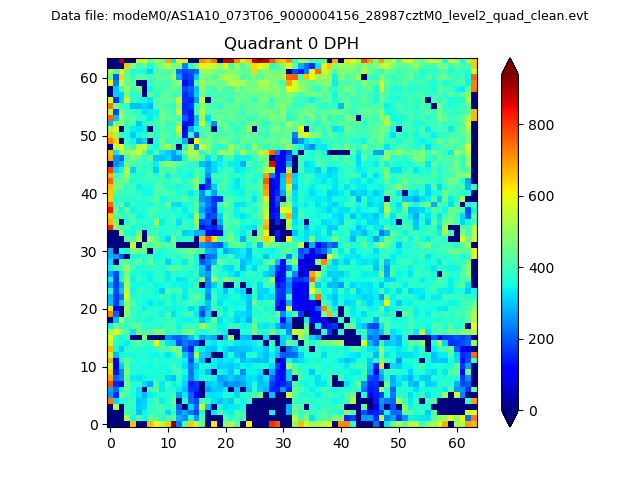 |
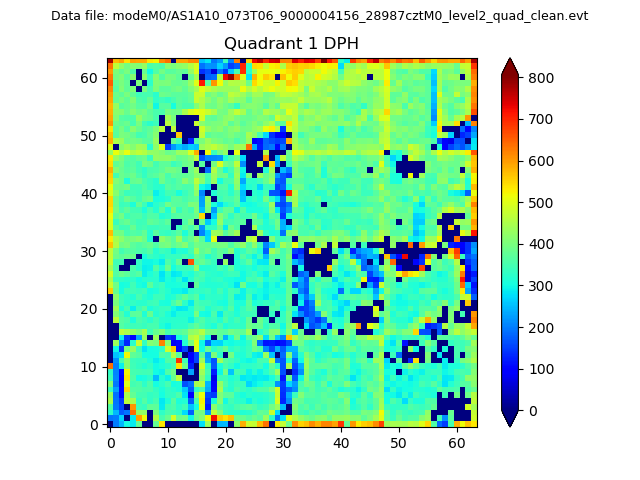 |
Quadrant B |
|---|---|---|---|
| Quadrant D | 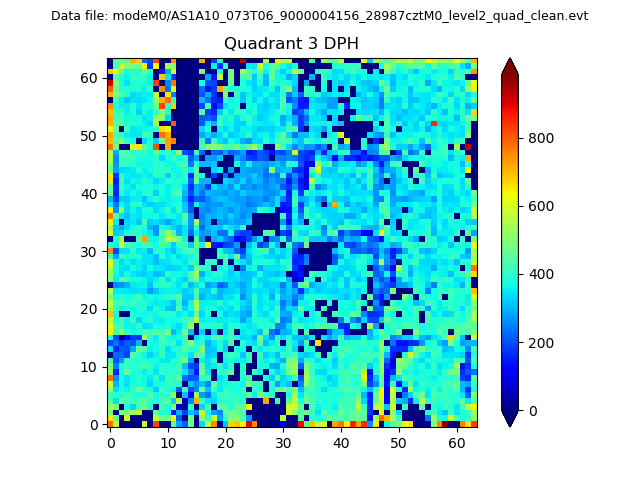 |
 |
Quadrant C |
| Plot type | Count rate plots | Images |
|---|---|---|
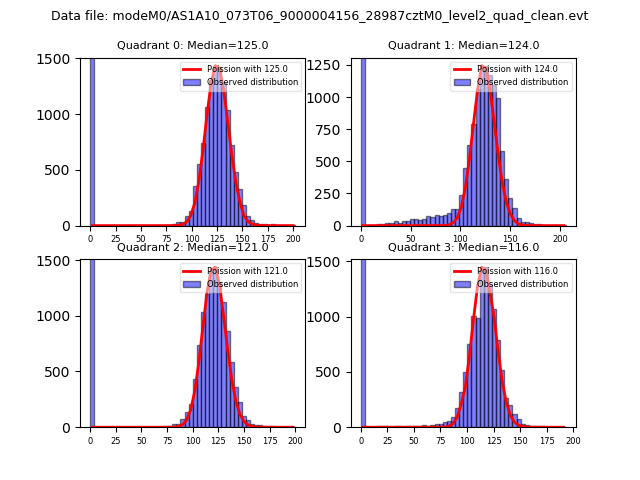
| Comparison with Poisson distribution Blue bars denote a histogram of data divided into 1 sec bins. Red curve is a Poisson curve with rate = median count rate of data. |
 |
 |
| Quadrant-wise count rates Data is divided into 100 sec bins |
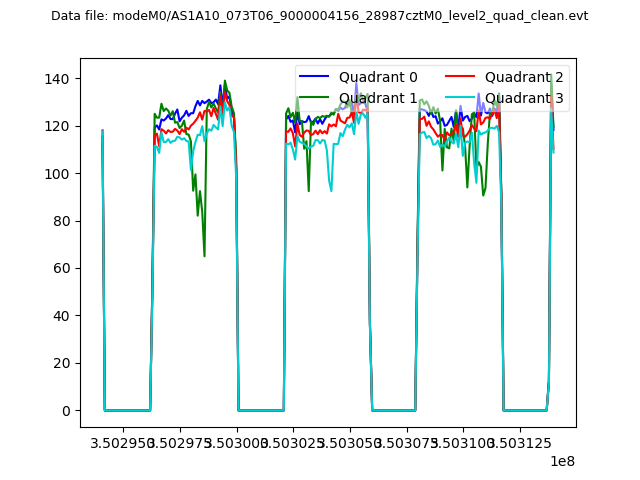 |
|
| Module-wise count rates for Quadrant A Data is divided into 100 sec bins |
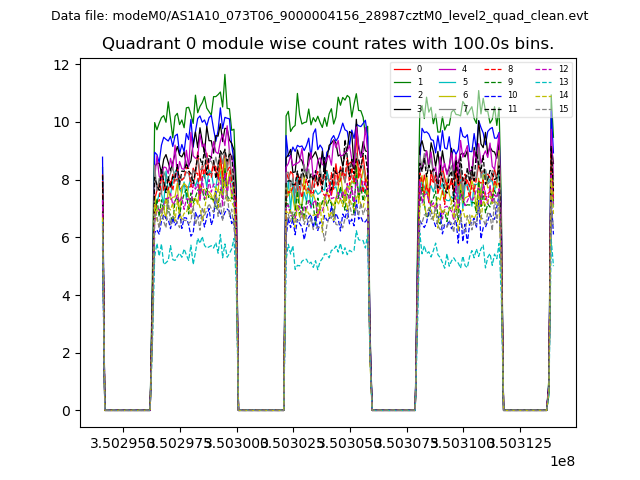 |
 |
| Module-wise count rates for Quadrant B Data is divided into 100 sec bins |
 |
 |
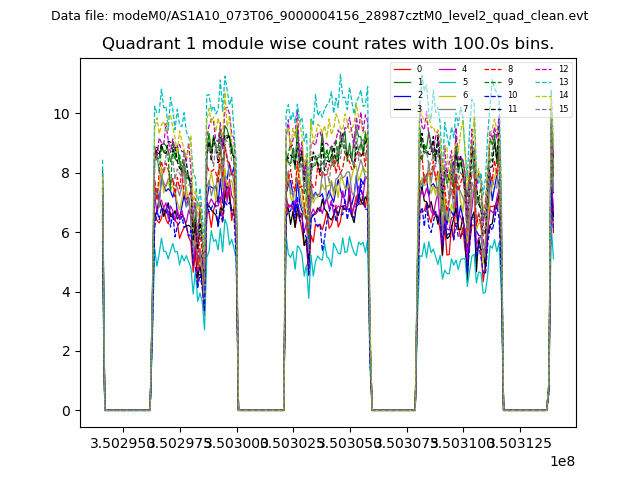
| Module-wise count rates for Quadrant C Data is divided into 100 sec bins |
 |
 |
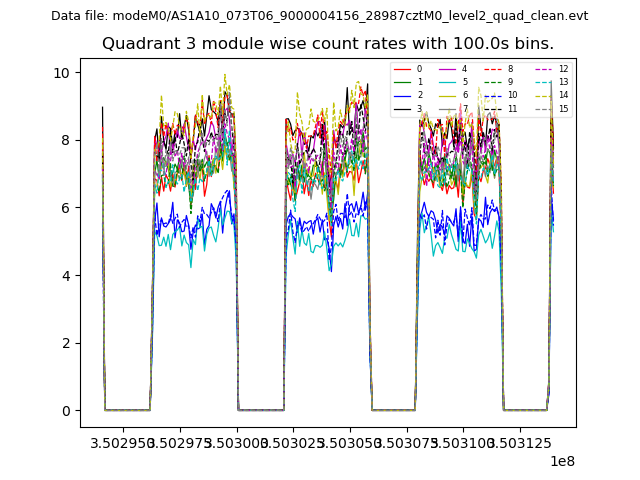
| Module-wise count rates for Quadrant D Data is divided into 100 sec bins |
 |
 |
| Parameter | Plot |
|---|---|
| CZT HV Monitor | 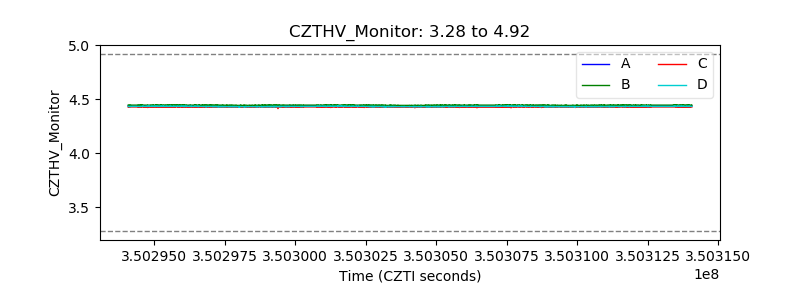 |
| D_VDD | 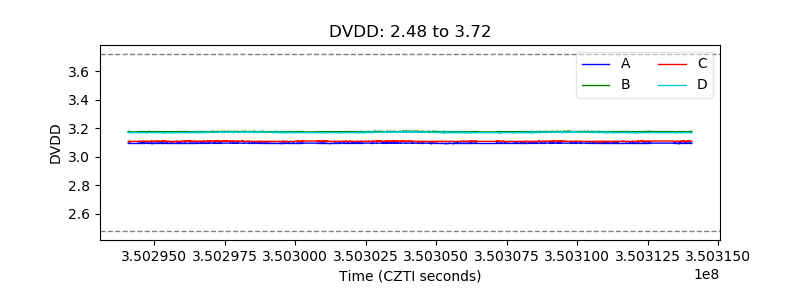 |
| Temperature 1 | 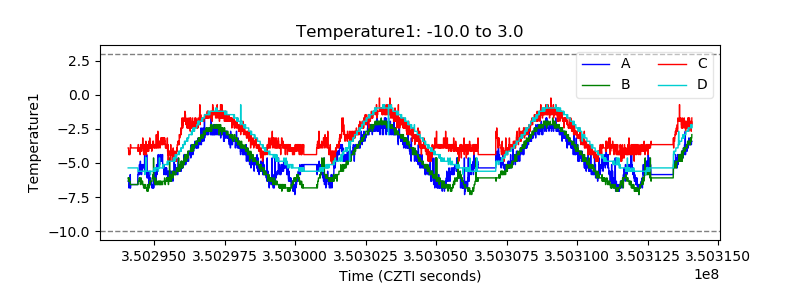 |
| Veto HV Monitor | 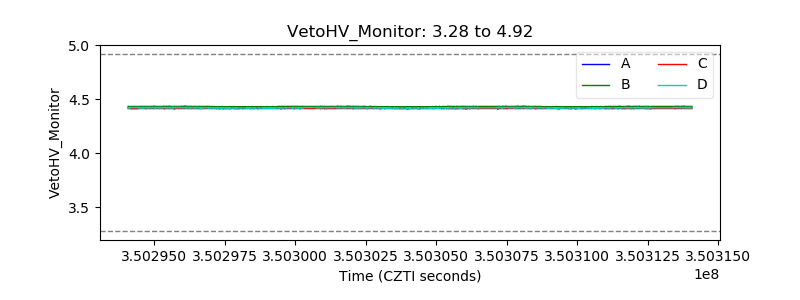 |
| Veto LLD | 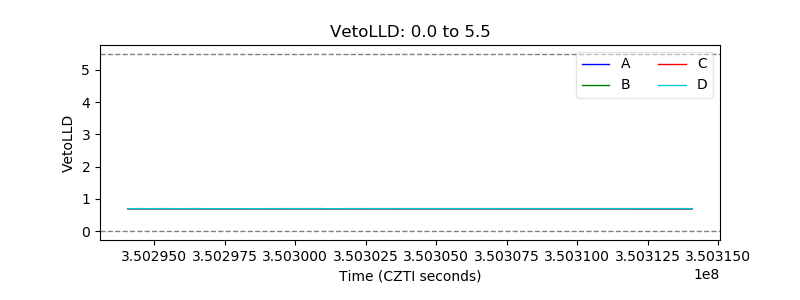 |
| Alpha Counter |  |
| _CPM_Rate | 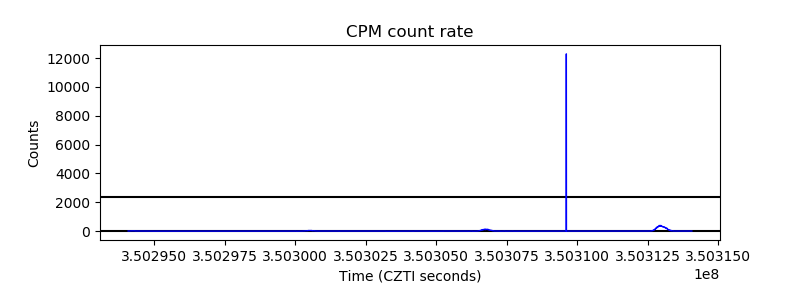 |
| CZT Counter | 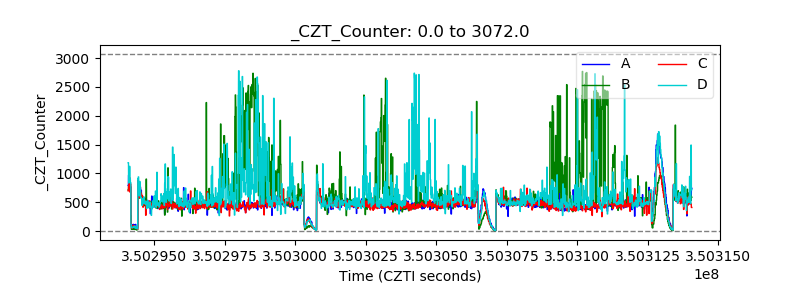 |
| +2.5 Volts monitor | 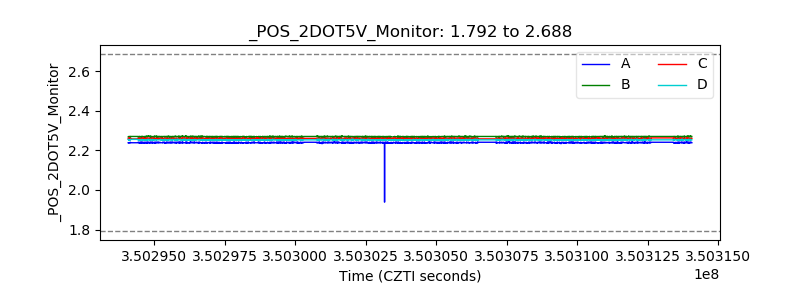 |
| +5 Volts monitor | 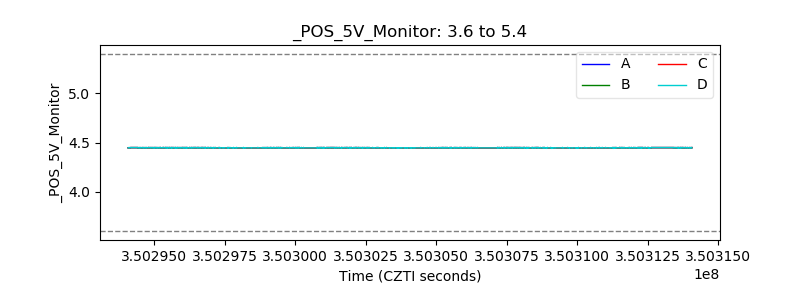 |
| _ROLL_ROT | 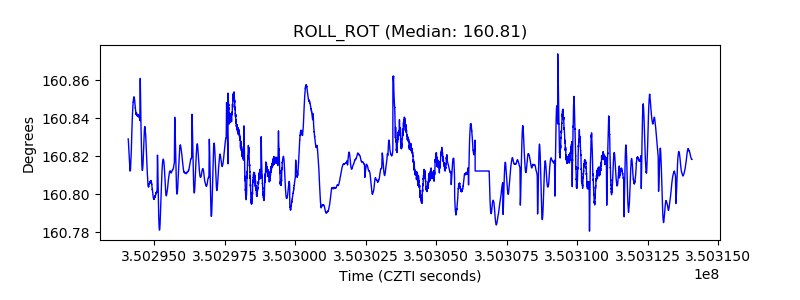 |
| _Roll_DEC | 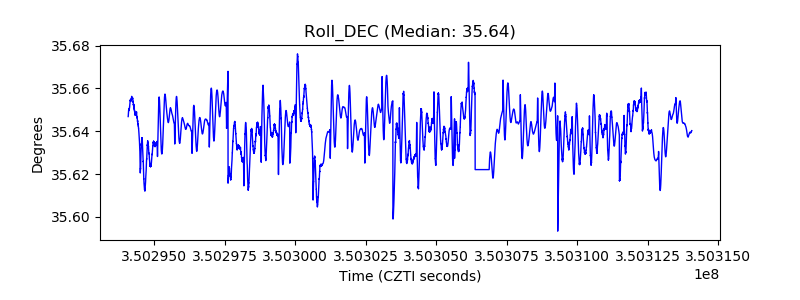 |
| _Roll_RA | 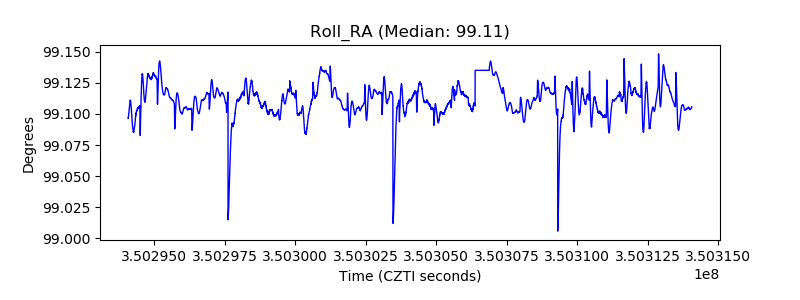 |
| Veto Counter | 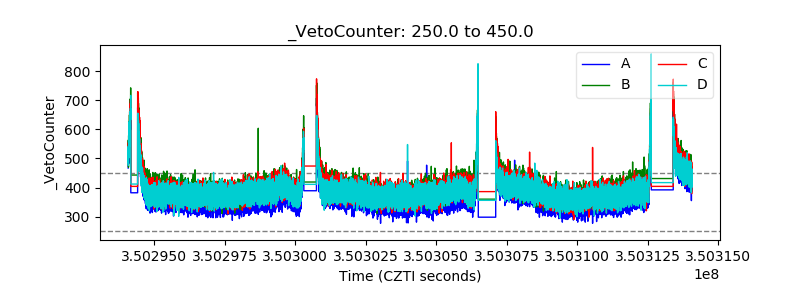 |