| Param | Original file | Final file |
|---|---|---|
| Filename | modeM0/AS1A10_073T06_9000004156_28988cztM0_level2.evt | modeM0/AS1A10_073T06_9000004156_28988cztM0_level2_quad_clean.evt |
| Size (bytes) | 443,911,680 | 99,109,440 |
| Size | 423.3 MB | 94.5 MB |
| Events in quadrant A | 3,022,781 | 660,924 |
| Events in quadrant B | 3,376,047 | 667,820 |
| Events in quadrant C | 2,928,087 | 631,564 |
| Events in quadrant D | 3,699,026 | 611,669 |
| Mode M9 | |||
|---|---|---|---|
| Quadrant | BADHDUFLAG | Total packets | Discarded packets |
| A | 0 | 10 | 0 |
| B | 0 | 10 | 0 |
| C | 0 | 10 | 0 |
| D | 0 | 10 | 0 |
| Mode SS | |||
|---|---|---|---|
| Quadrant | BADHDUFLAG | Total packets | Discarded packets |
| A | 0 | 124 | 0 |
| B | 0 | 124 | 0 |
| C | 0 | 124 | 0 |
| D | 0 | 124 | 0 |
| Mode M0 | |||
|---|---|---|---|
| Quadrant | BADHDUFLAG | Total packets | Discarded packets |
| A | 0 | 13134 | 1 |
| B | 0 | 13886 | 1 |
| C | 0 | 12657 | 1 |
| D | 0 | 15128 | 1 |
| Quadrant | Total seconds | Saturated seconds | Saturation percentage |
|---|---|---|---|
| A | 6156 | 52 | 0.844704% |
| B | 6157 | 103 | 1.672893% |
| C | 6157 | 80 | 1.299334% |
| D | 6157 | 84 | 1.364301% |
Noise dominated data is calculated using 1-second bins in cleaned event files. If a bin has >2000 counts, and if more than 50% of those come from <1% of pixels, then it is considered to be noise-dominated and hence unusable.
| Quadrant | # 1 sec bins | Bins with >0 counts | Bins with >2000 counts | High rate bins dominated by noise | Noise dominated (total time) | Noise dominated (detector-on time) | Marked lightcurve |
|---|---|---|---|---|---|---|---|
| A | 7106 | 6157 | 0 | 0 | 0.00% | 0.00% | 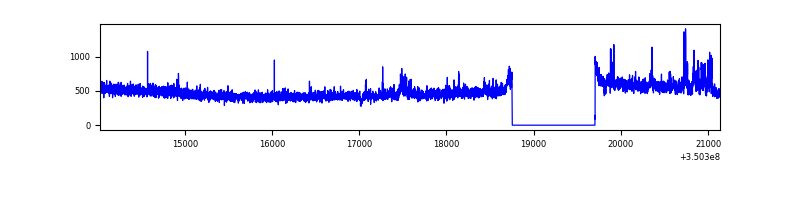 |
| B | 7107 | 6158 | 41 | 41 | 0.58% | 0.67% | 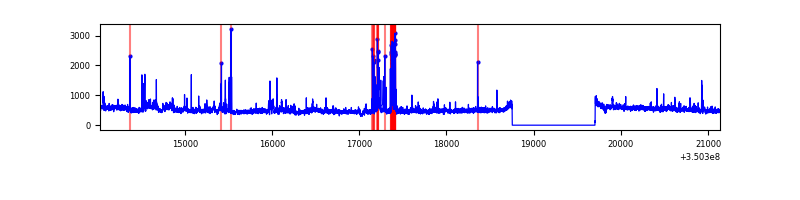 |
| C | 7107 | 6158 | 0 | 0 | 0.00% | 0.00% | 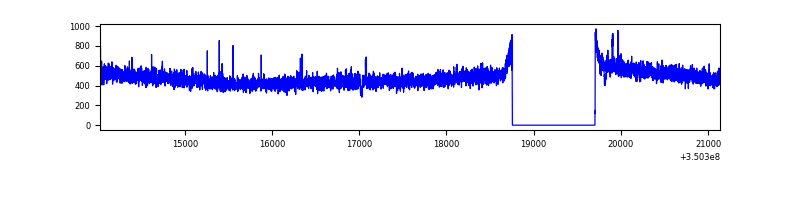 |
| D | 7107 | 6158 | 31 | 31 | 0.44% | 0.50% | 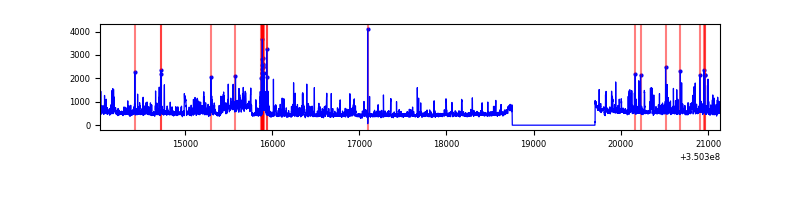 |
Top three noisy pixels from each quadrant. If the there are fewer than three noisy pixels in the level2.evt file, extra rows are filled as -1
| Pixel properties | Quadrant properties | ||||||
|---|---|---|---|---|---|---|---|
| Quadrant | DetID | PixID | Counts | Sigma | Mean | Median | Sigma |
| A | 0 | 13 | 97559 | 634.95 | 753 | 737 | 152.5 |
| A | 12 | 210 | 12069 | 74.31 | 753 | 737 | 152.5 |
| A | 13 | 254 | 11001 | 67.31 | 753 | 737 | 152.5 |
| B | 10 | 245 | 423387 | 2964.64 | 742 | 722 | 142.6 |
| B | 12 | 111 | 17495 | 117.65 | 742 | 722 | 142.6 |
| B | 15 | 32 | 16799 | 112.77 | 742 | 722 | 142.6 |
| C | 14 | 238 | 114839 | 678.24 | 717 | 722 | 168.3 |
| C | 2 | 114 | 14455 | 81.62 | 717 | 722 | 168.3 |
| C | 13 | 61 | 4868 | 24.64 | 717 | 722 | 168.3 |
| D | 8 | 195 | 532128 | 3085.34 | 725 | 707 | 172.2 |
| D | 1 | 52 | 195419 | 1130.46 | 725 | 707 | 172.2 |
| D | 5 | 233 | 96624 | 556.88 | 725 | 707 | 172.2 |
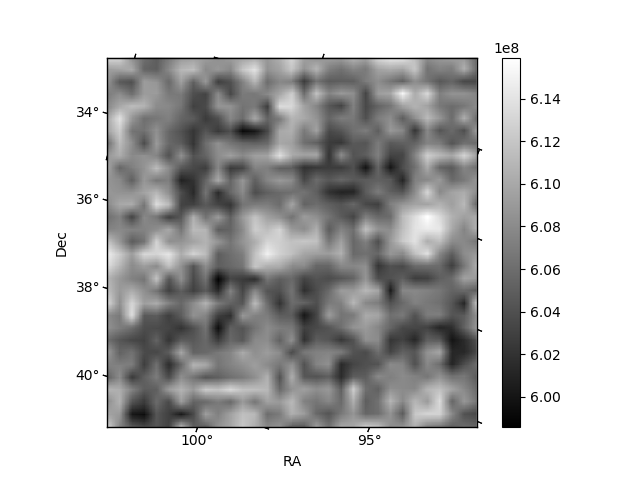
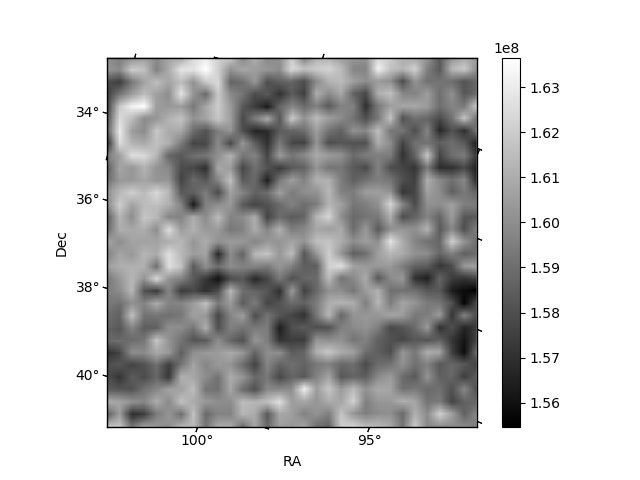
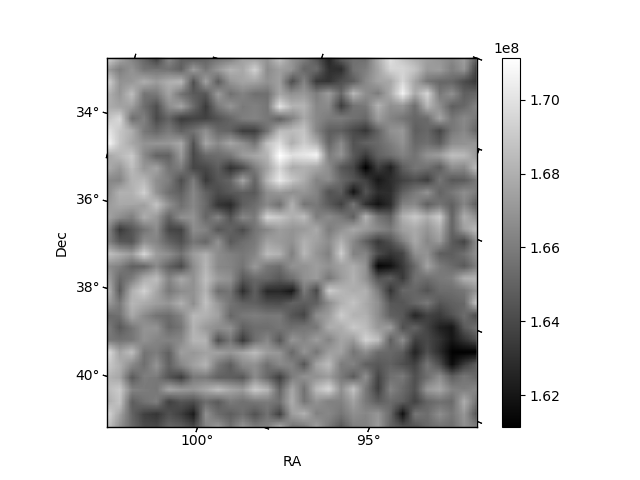
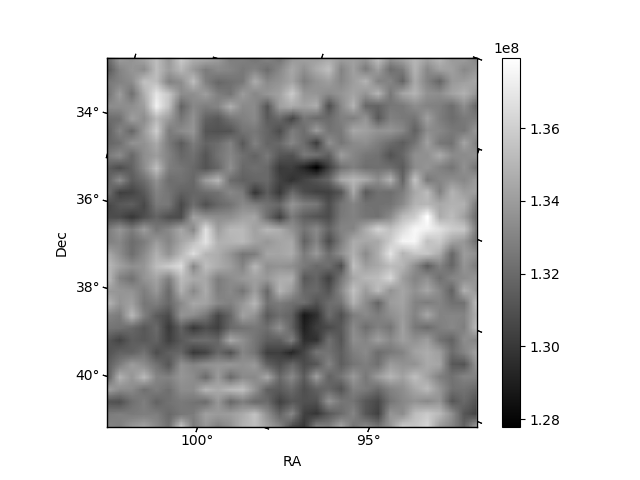
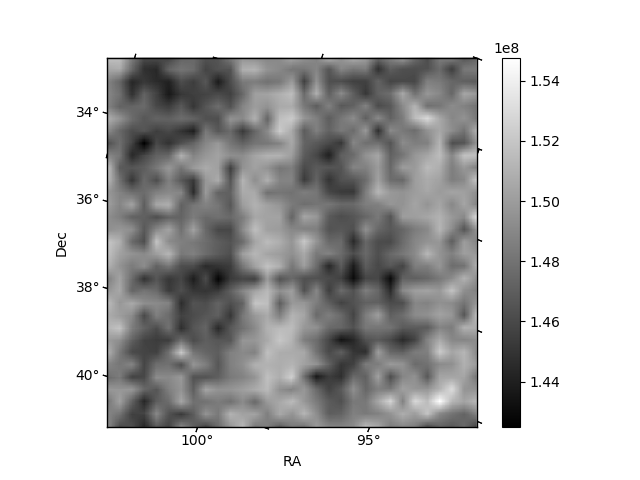
Histogram calculated using DETX and DETY for each event in the final _common_clean file
| Quadrant A | 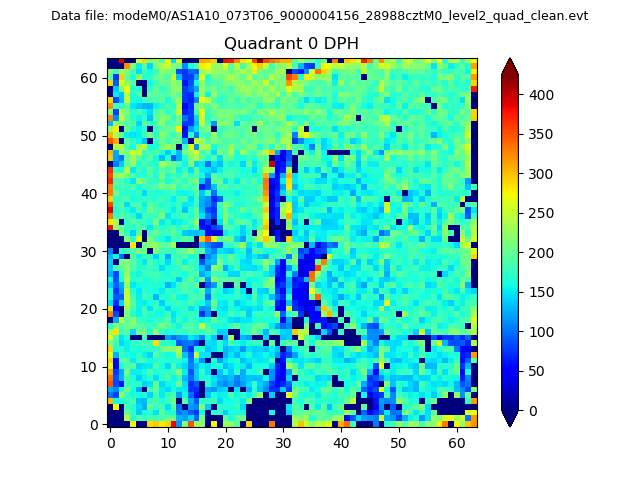 |
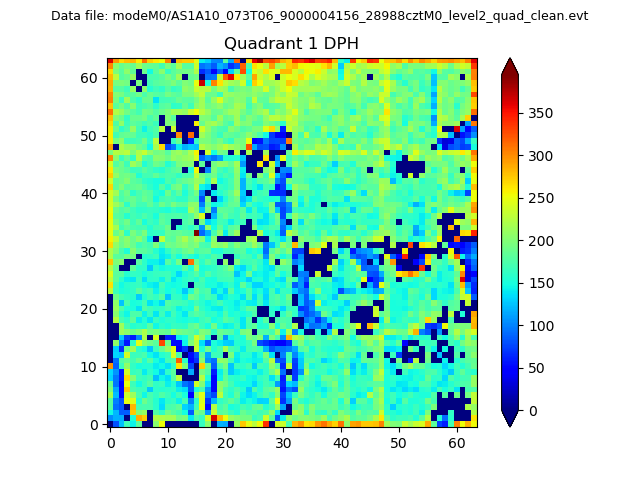 |
Quadrant B |
|---|---|---|---|
| Quadrant D |  |
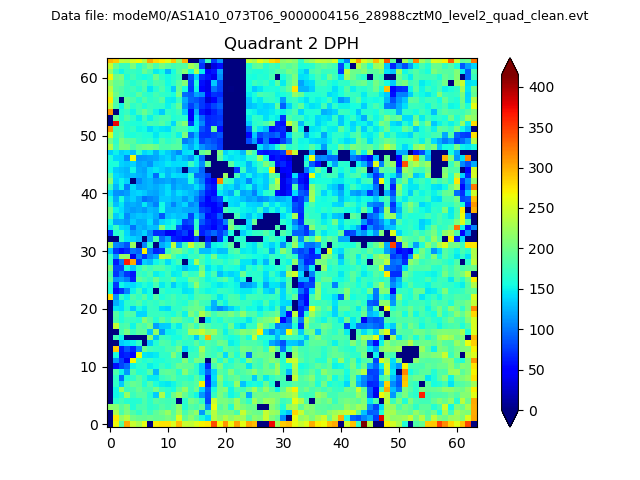 |
Quadrant C |
| Plot type | Count rate plots | Images |
|---|---|---|
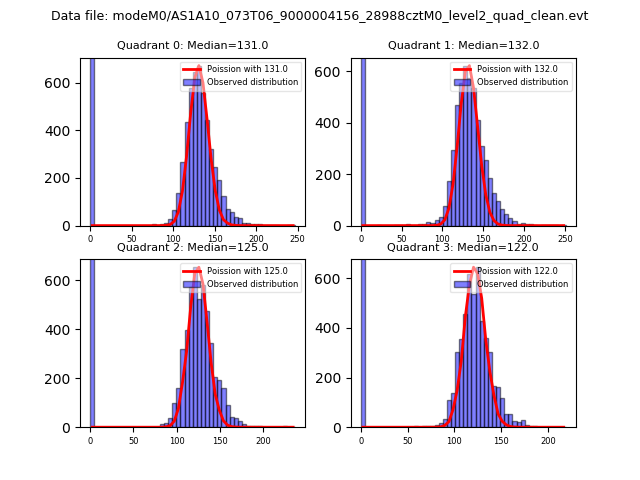
| Comparison with Poisson distribution Blue bars denote a histogram of data divided into 1 sec bins. Red curve is a Poisson curve with rate = median count rate of data. |
 |
 |
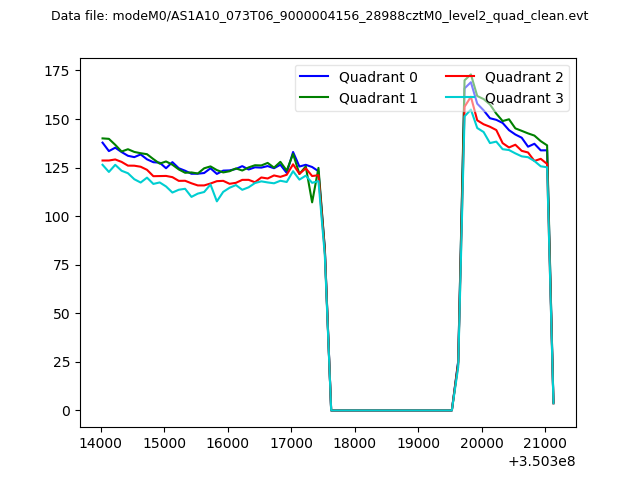
| Quadrant-wise count rates Data is divided into 100 sec bins |
 |
|
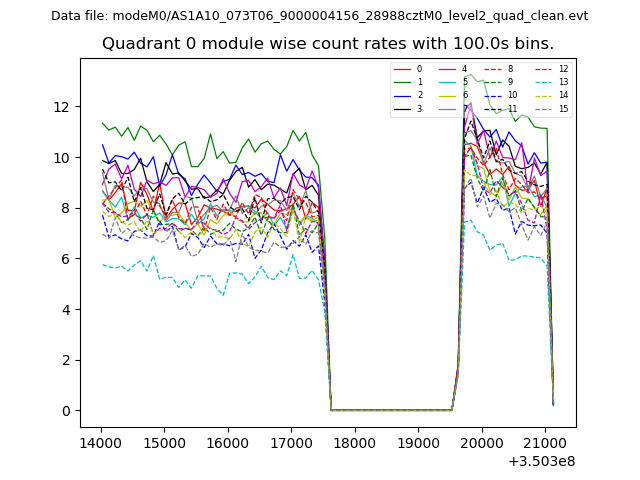
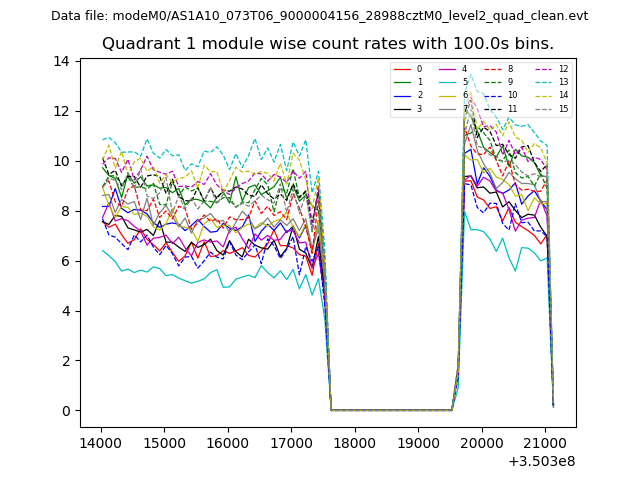
| Module-wise count rates for Quadrant A Data is divided into 100 sec bins |
 |
 |
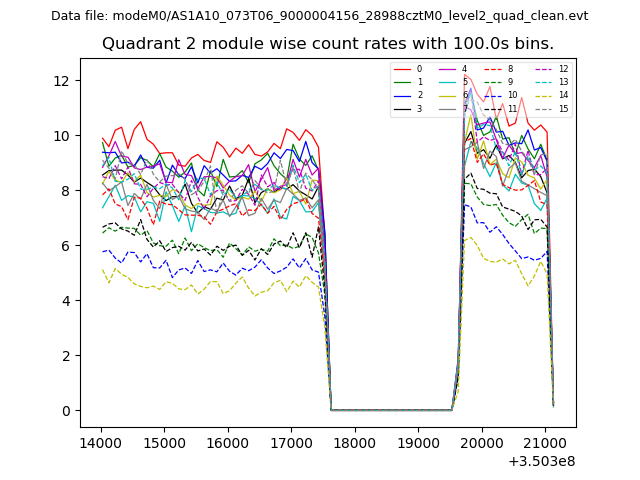
| Module-wise count rates for Quadrant B Data is divided into 100 sec bins |
 |
 |
| Module-wise count rates for Quadrant C Data is divided into 100 sec bins |
 |
 |
| Module-wise count rates for Quadrant D Data is divided into 100 sec bins |
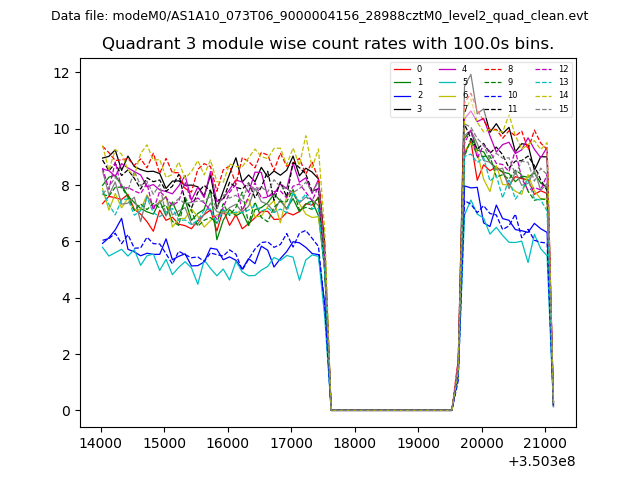 |
 |
| Parameter | Plot |
|---|---|
| CZT HV Monitor | 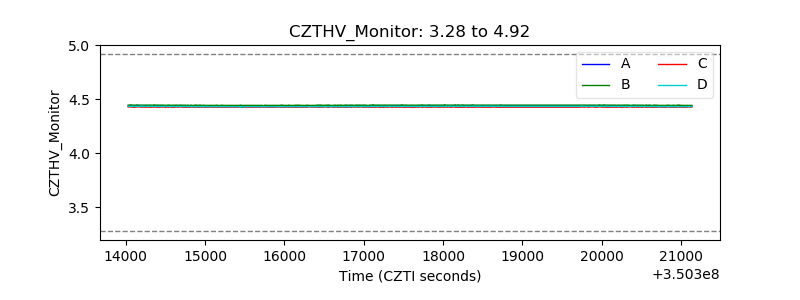 |
| D_VDD | 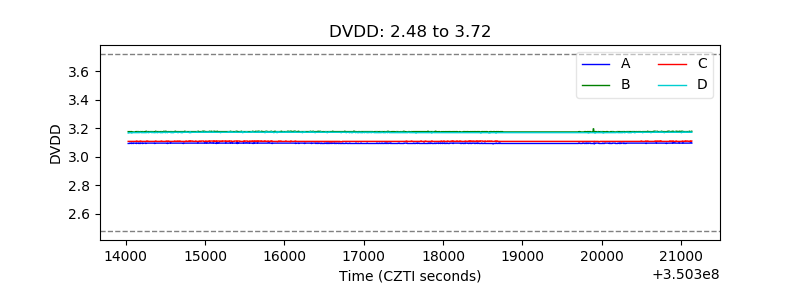 |
| Temperature 1 | 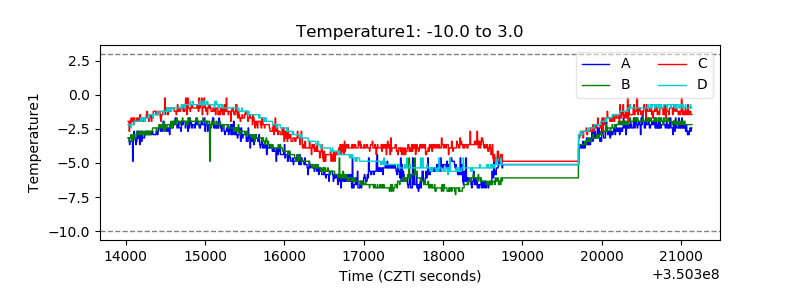 |
| Veto HV Monitor | 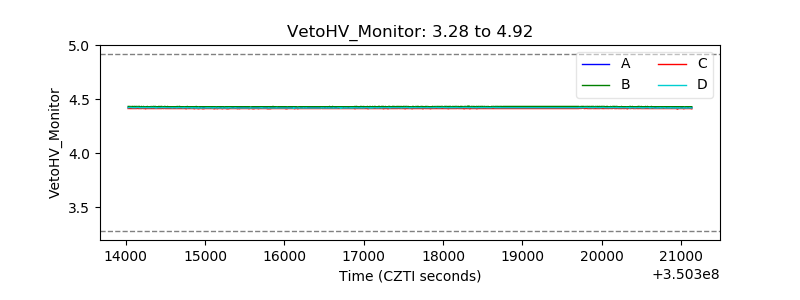 |
| Veto LLD |  |
| Alpha Counter | 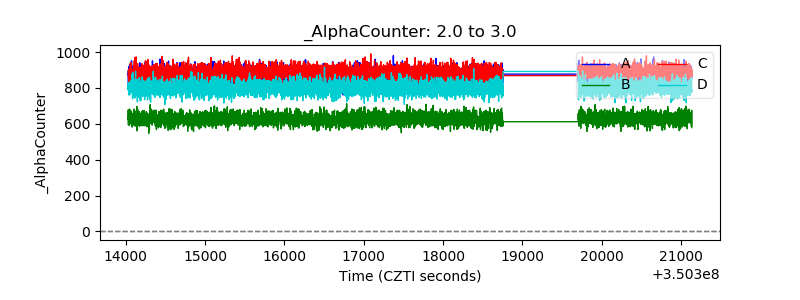 |
| _CPM_Rate | 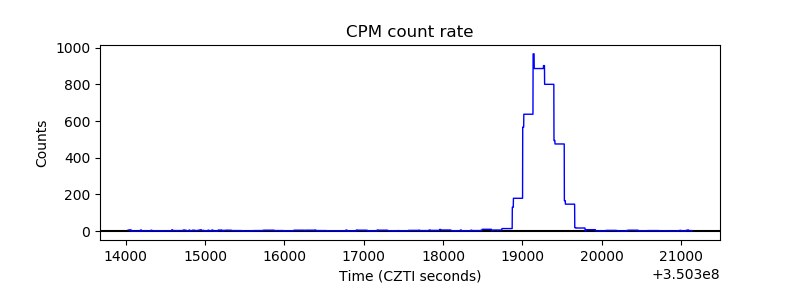 |
| CZT Counter | 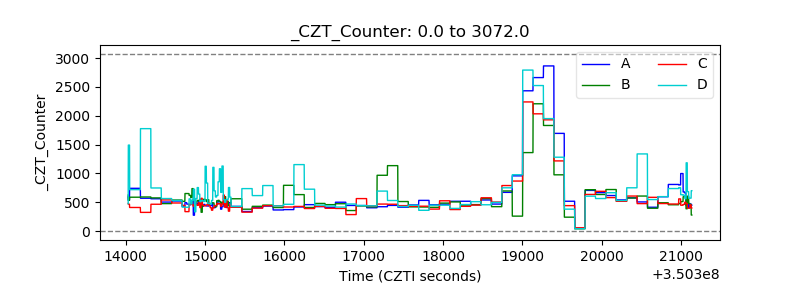 |
| +2.5 Volts monitor |  |
| +5 Volts monitor |  |
| _ROLL_ROT | 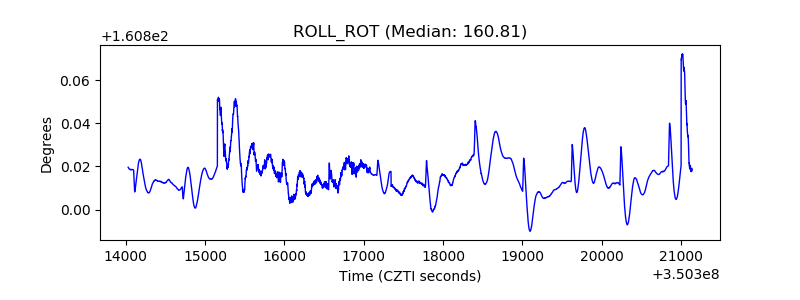 |
| _Roll_DEC | 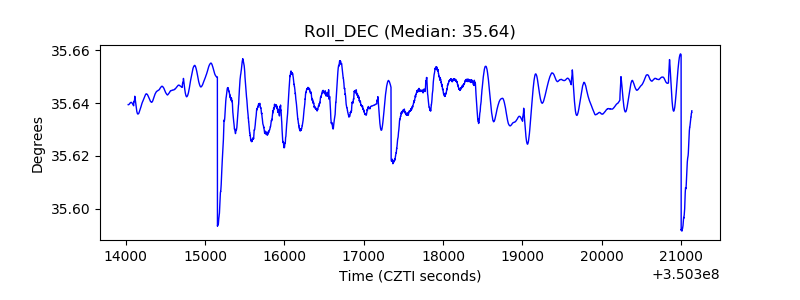 |
| _Roll_RA | 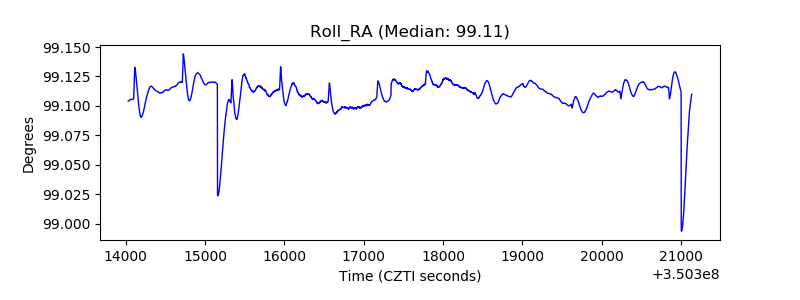 |
| Veto Counter |  |