| Param | Original file | Final file |
|---|---|---|
| Filename | modeM0/AS1A10_073T06_9000004156_28990cztM0_level2.evt | modeM0/AS1A10_073T06_9000004156_28990cztM0_level2_quad_clean.evt |
| Size (bytes) | 539,055,360 | 108,434,880 |
| Size | 514.1 MB | 103.4 MB |
| Events in quadrant A | 3,565,558 | 730,285 |
| Events in quadrant B | 3,771,756 | 743,039 |
| Events in quadrant C | 3,283,045 | 698,481 |
| Events in quadrant D | 5,257,212 | 651,788 |
| Mode M9 | |||
|---|---|---|---|
| Quadrant | BADHDUFLAG | Total packets | Discarded packets |
| A | 0 | 10 | 0 |
| B | 0 | 11 | 0 |
| C | 0 | 11 | 0 |
| D | 0 | 11 | 0 |
| Mode SS | |||
|---|---|---|---|
| Quadrant | BADHDUFLAG | Total packets | Discarded packets |
| A | 0 | 134 | 0 |
| B | 0 | 134 | 0 |
| C | 0 | 134 | 0 |
| D | 0 | 134 | 0 |
| Mode M0 | |||
|---|---|---|---|
| Quadrant | BADHDUFLAG | Total packets | Discarded packets |
| A | 0 | 15086 | 2 |
| B | 0 | 15518 | 2 |
| C | 0 | 14011 | 2 |
| D | 0 | 20129 | 7 |
| Quadrant | Total seconds | Saturated seconds | Saturation percentage |
|---|---|---|---|
| A | 6604 | 90 | 1.362810% |
| B | 6604 | 177 | 2.680194% |
| C | 6604 | 124 | 1.877650% |
| D | 6603 | 436 | 6.603059% |
Noise dominated data is calculated using 1-second bins in cleaned event files. If a bin has >2000 counts, and if more than 50% of those come from <1% of pixels, then it is considered to be noise-dominated and hence unusable.
| Quadrant | # 1 sec bins | Bins with >0 counts | Bins with >2000 counts | High rate bins dominated by noise | Noise dominated (total time) | Noise dominated (detector-on time) | Marked lightcurve |
|---|---|---|---|---|---|---|---|
| A | 7664 | 6605 | 12 | 12 | 0.16% | 0.18% | 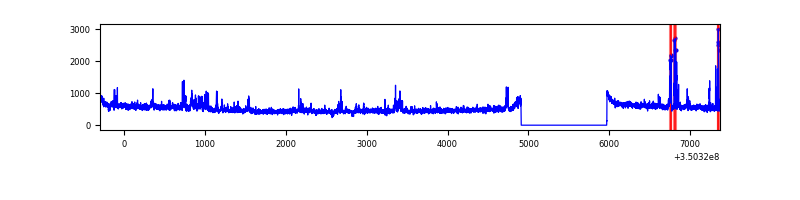 |
| B | 7664 | 6605 | 73 | 73 | 0.95% | 1.11% | 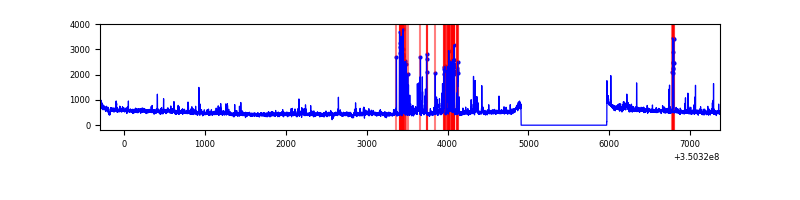 |
| C | 7664 | 6605 | 0 | 0 | 0.00% | 0.00% | 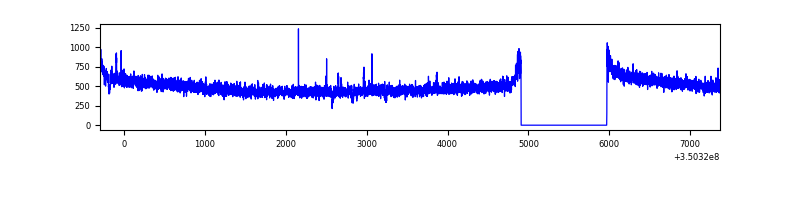 |
| D | 7663 | 6604 | 336 | 336 | 4.38% | 5.09% | 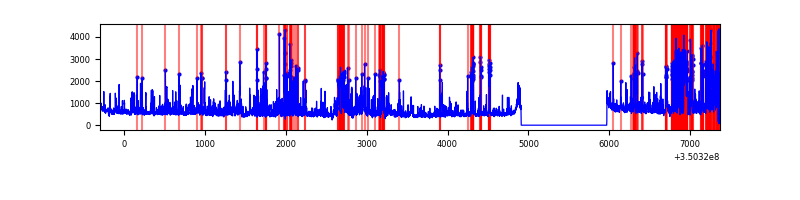 |
Top three noisy pixels from each quadrant. If the there are fewer than three noisy pixels in the level2.evt file, extra rows are filled as -1
| Pixel properties | Quadrant properties | ||||||
|---|---|---|---|---|---|---|---|
| Quadrant | DetID | PixID | Counts | Sigma | Mean | Median | Sigma |
| A | 0 | 13 | 228371 | 1354.66 | 843 | 825 | 168.0 |
| A | 15 | 192 | 66369 | 390.21 | 843 | 825 | 168.0 |
| A | 13 | 254 | 11927 | 66.09 | 843 | 825 | 168.0 |
| B | 10 | 246 | 391749 | 2492.37 | 828 | 805 | 156.9 |
| B | 10 | 245 | 99647 | 630.14 | 828 | 805 | 156.9 |
| B | 12 | 111 | 19302 | 117.92 | 828 | 805 | 156.9 |
| C | 14 | 238 | 128643 | 681.48 | 804 | 807 | 187.6 |
| C | 2 | 114 | 15885 | 80.38 | 804 | 807 | 187.6 |
| C | 13 | 61 | 5440 | 24.7 | 804 | 807 | 187.6 |
| D | 1 | 52 | 1597427 | 8520.08 | 792 | 769 | 187.4 |
| D | 8 | 195 | 367451 | 1956.69 | 792 | 769 | 187.4 |
| D | 7 | 80 | 138506 | 734.99 | 792 | 769 | 187.4 |
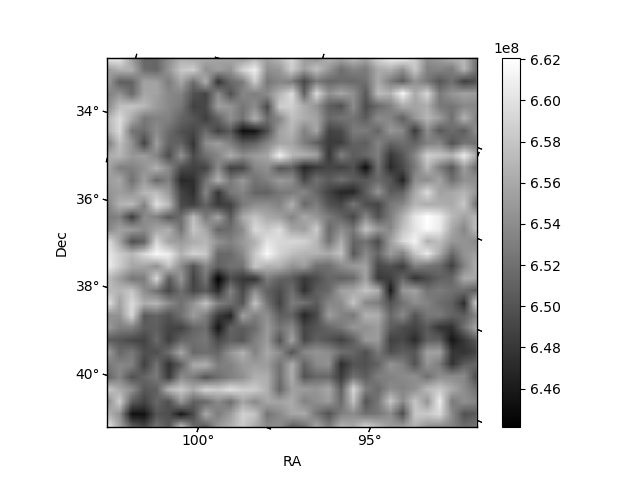
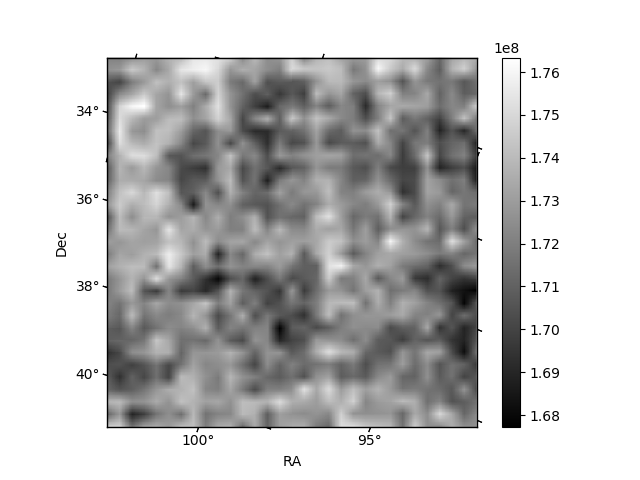
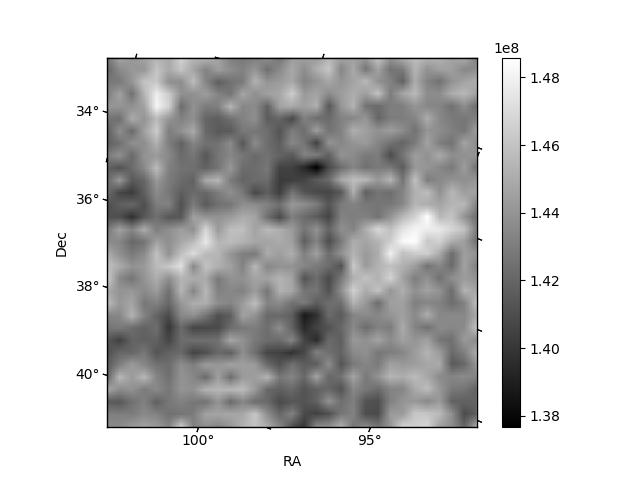
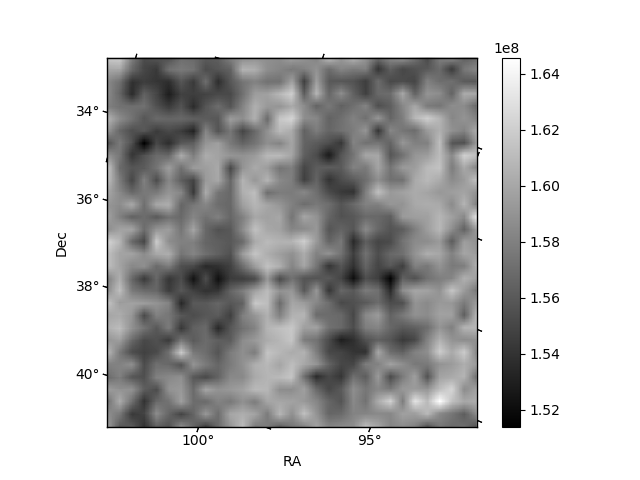
Histogram calculated using DETX and DETY for each event in the final _common_clean file
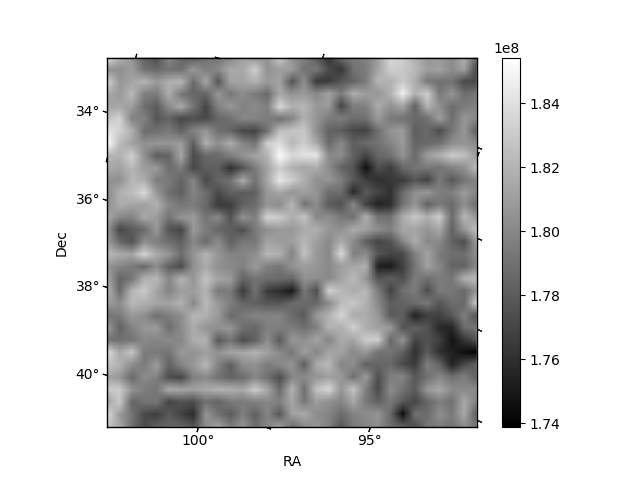
| Quadrant A | 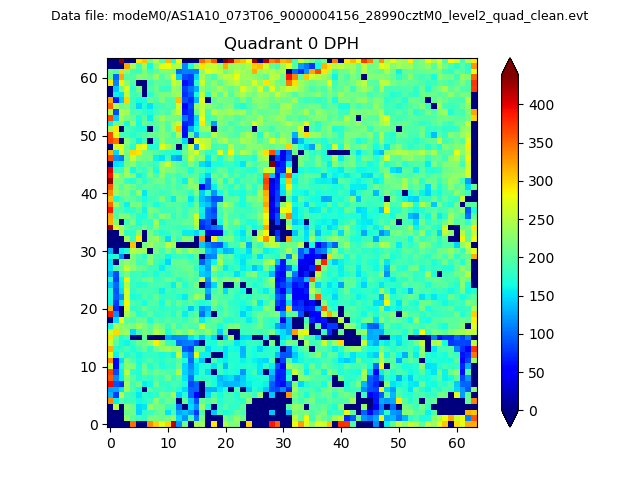 |
 |
Quadrant B |
|---|---|---|---|
| Quadrant D | 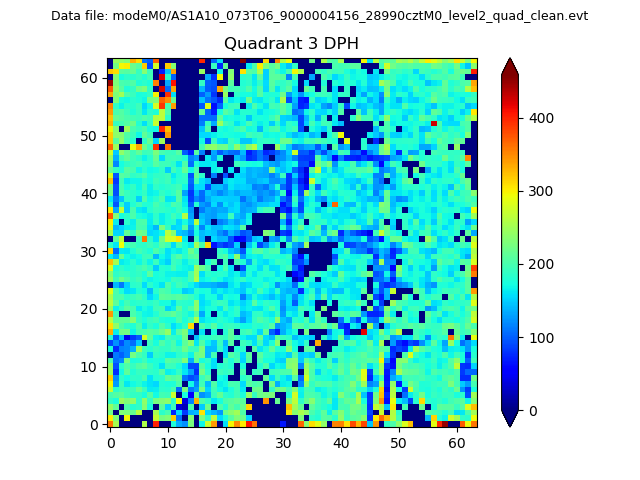 |
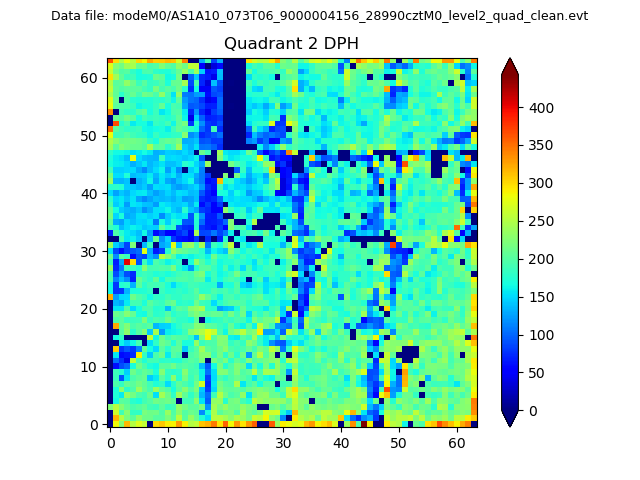 |
Quadrant C |
| Plot type | Count rate plots | Images |
|---|---|---|
| Comparison with Poisson distribution Blue bars denote a histogram of data divided into 1 sec bins. Red curve is a Poisson curve with rate = median count rate of data. |
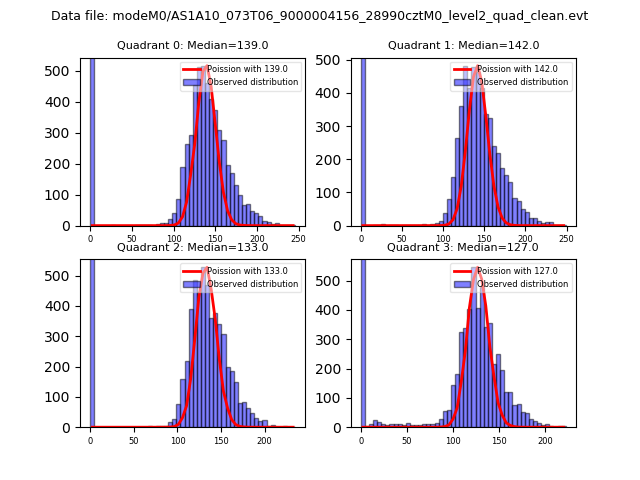 |
 |
| Quadrant-wise count rates Data is divided into 100 sec bins |
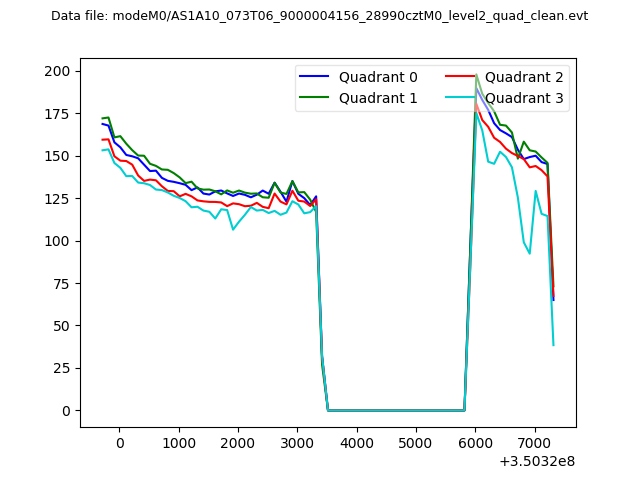 |
|
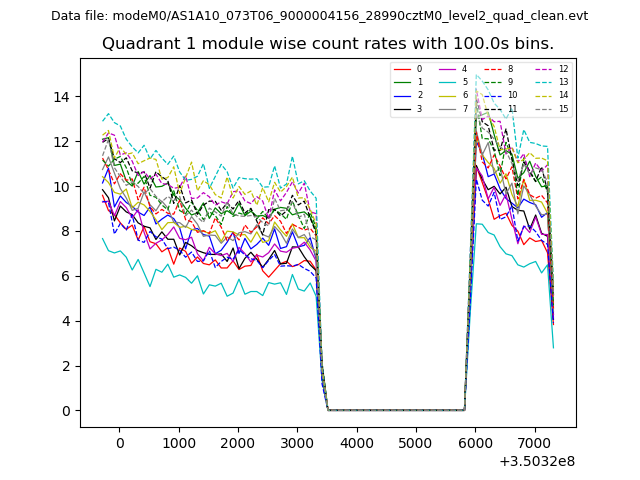
| Module-wise count rates for Quadrant A Data is divided into 100 sec bins |
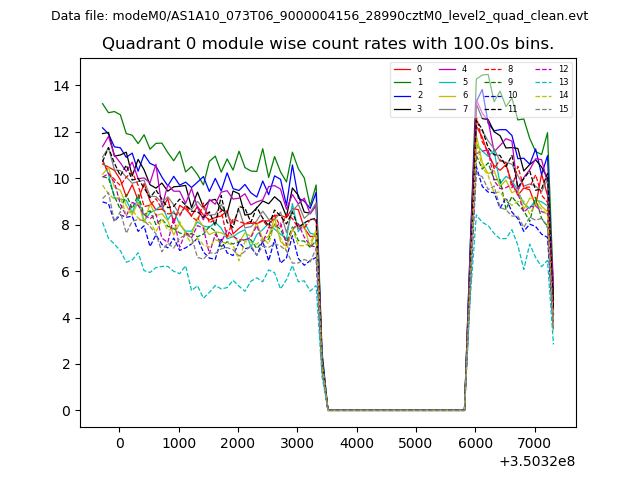 |
 |
| Module-wise count rates for Quadrant B Data is divided into 100 sec bins |
 |
 |
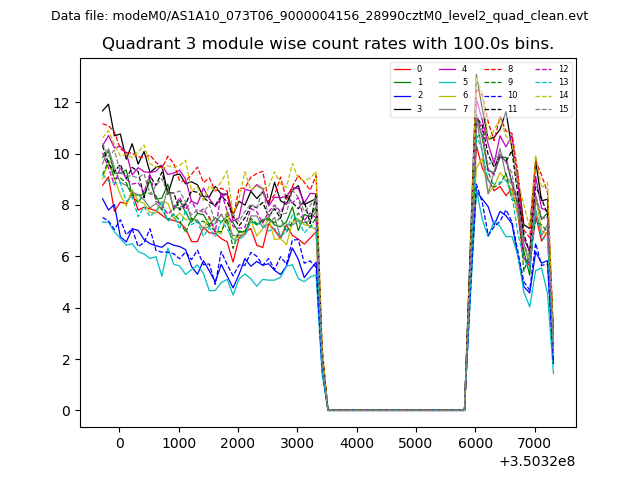
| Module-wise count rates for Quadrant C Data is divided into 100 sec bins |
 |
 |
| Module-wise count rates for Quadrant D Data is divided into 100 sec bins |
 |
 |
| Parameter | Plot |
|---|---|
| CZT HV Monitor | 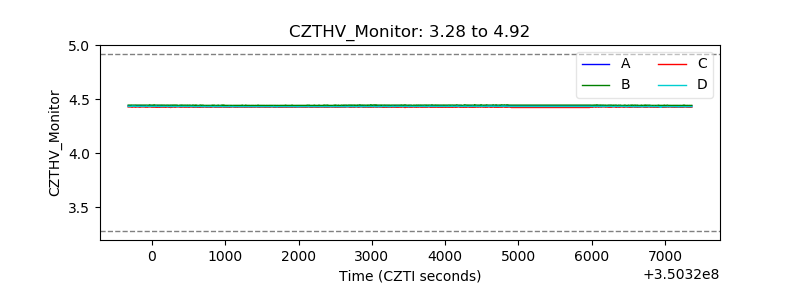 |
| D_VDD | 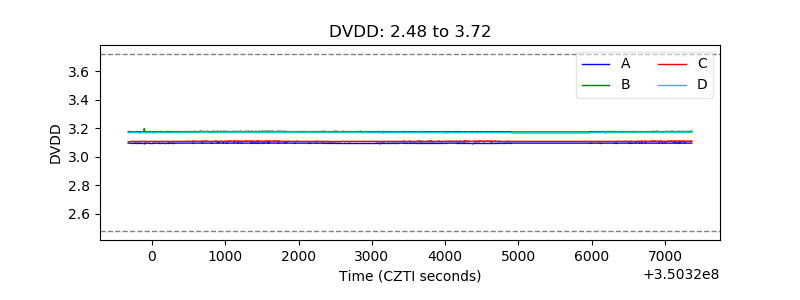 |
| Temperature 1 | 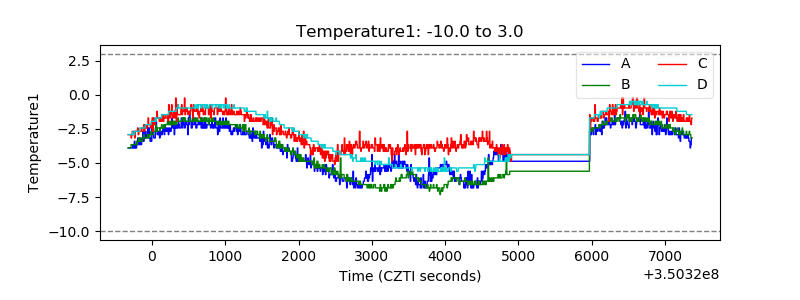 |
| Veto HV Monitor | 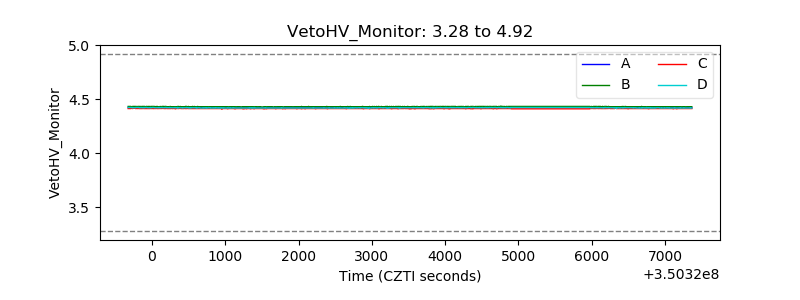 |
| Veto LLD | 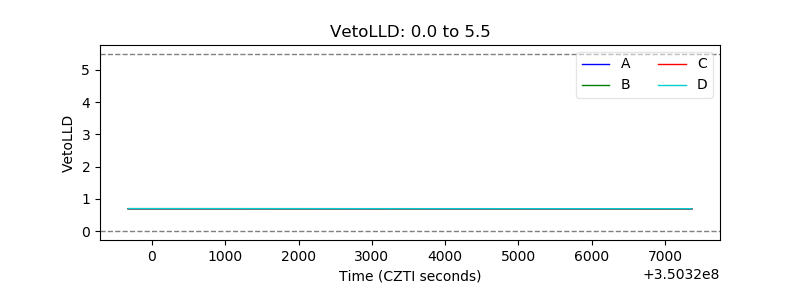 |
| Alpha Counter | 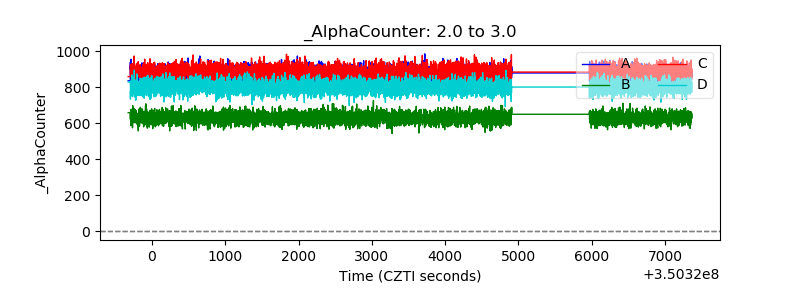 |
| _CPM_Rate | 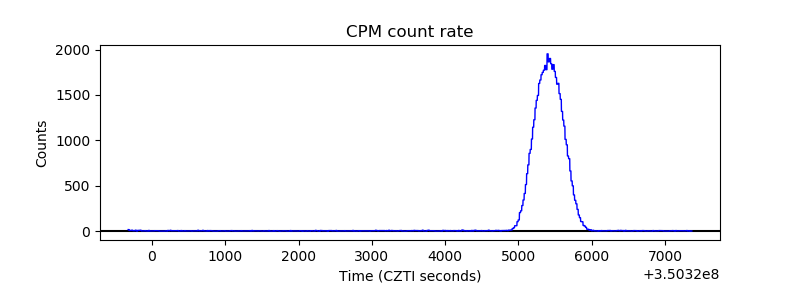 |
| CZT Counter | 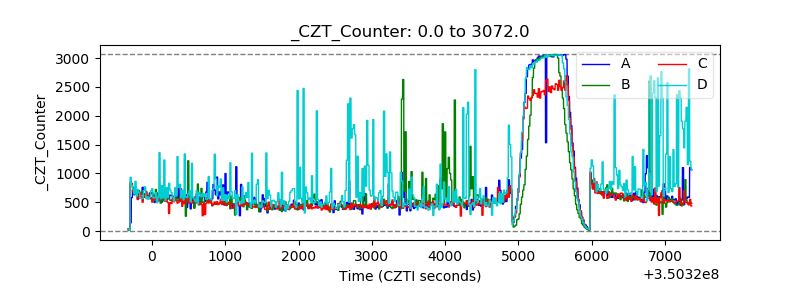 |
| +2.5 Volts monitor |  |
| +5 Volts monitor | 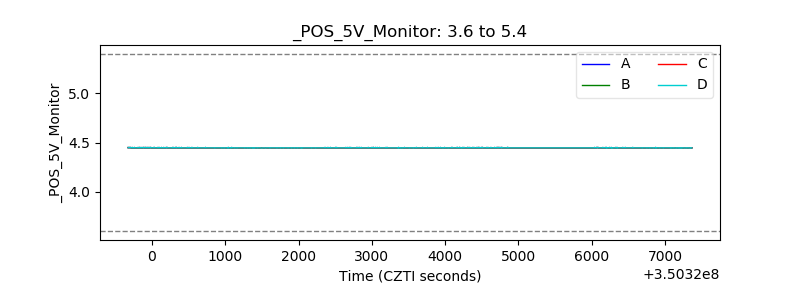 |
| _ROLL_ROT | 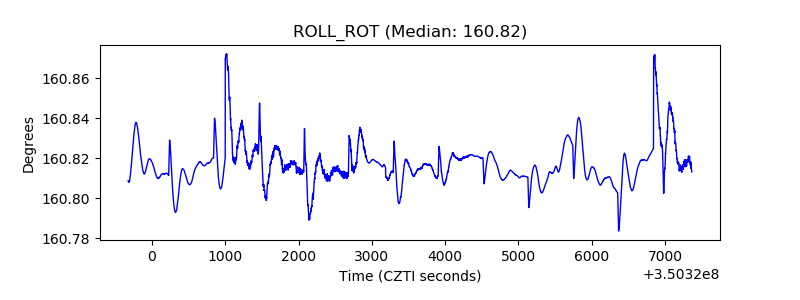 |
| _Roll_DEC | 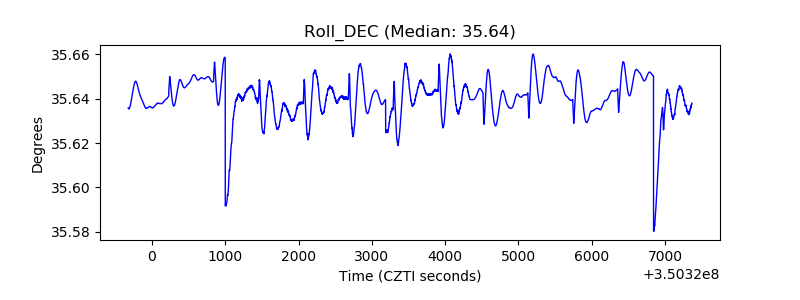 |
| _Roll_RA | 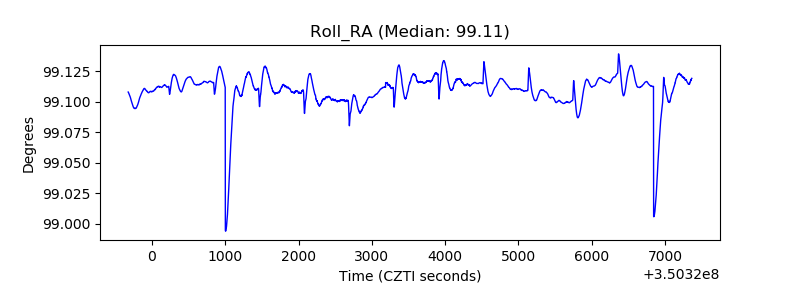 |
| Veto Counter |  |