| Param | Original file | Final file |
|---|---|---|
| Filename | modeM0/AS1A10_073T06_9000004156_28991cztM0_level2.evt | modeM0/AS1A10_073T06_9000004156_28991cztM0_level2_quad_clean.evt |
| Size (bytes) | 557,524,800 | 104,388,480 |
| Size | 531.7 MB | 99.6 MB |
| Events in quadrant A | 4,154,139 | 696,718 |
| Events in quadrant B | 3,628,646 | 720,552 |
| Events in quadrant C | 3,263,348 | 678,240 |
| Events in quadrant D | 5,406,544 | 620,687 |
| Mode M9 | |||
|---|---|---|---|
| Quadrant | BADHDUFLAG | Total packets | Discarded packets |
| A | 0 | 12 | 0 |
| B | 0 | 12 | 0 |
| C | 0 | 12 | 0 |
| D | 0 | 12 | 0 |
| Mode SS | |||
|---|---|---|---|
| Quadrant | BADHDUFLAG | Total packets | Discarded packets |
| A | 0 | 128 | 0 |
| B | 0 | 128 | 0 |
| C | 0 | 128 | 0 |
| D | 0 | 128 | 0 |
| Mode M0 | |||
|---|---|---|---|
| Quadrant | BADHDUFLAG | Total packets | Discarded packets |
| A | 0 | 16743 | 1 |
| B | 0 | 14827 | 1 |
| C | 0 | 13798 | 1 |
| D | 0 | 20421 | 1 |
| Quadrant | Total seconds | Saturated seconds | Saturation percentage |
|---|---|---|---|
| A | 6381 | 236 | 3.698480% |
| B | 6381 | 82 | 1.285065% |
| C | 6381 | 110 | 1.723868% |
| D | 6381 | 606 | 9.496944% |
Noise dominated data is calculated using 1-second bins in cleaned event files. If a bin has >2000 counts, and if more than 50% of those come from <1% of pixels, then it is considered to be noise-dominated and hence unusable.
| Quadrant | # 1 sec bins | Bins with >0 counts | Bins with >2000 counts | High rate bins dominated by noise | Noise dominated (total time) | Noise dominated (detector-on time) | Marked lightcurve |
|---|---|---|---|---|---|---|---|
| A | 7571 | 6382 | 158 | 158 | 2.09% | 2.48% |  |
| B | 7571 | 6382 | 23 | 23 | 0.30% | 0.36% | 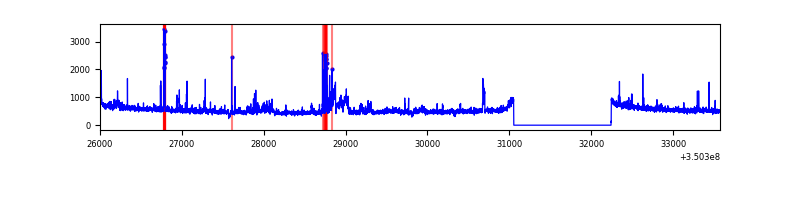 |
| C | 7571 | 6382 | 0 | 0 | 0.00% | 0.00% | 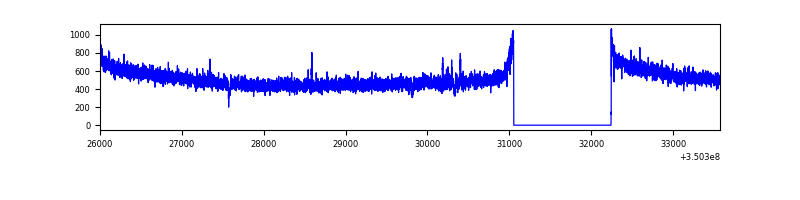 |
| D | 7571 | 6382 | 481 | 481 | 6.35% | 7.54% | 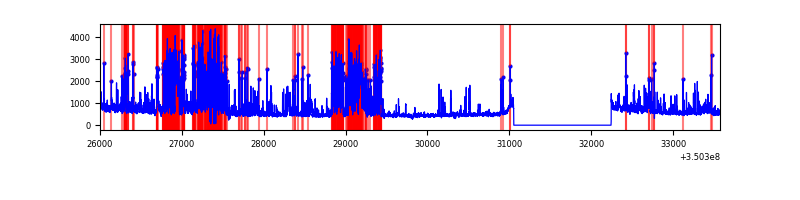 |
Top three noisy pixels from each quadrant. If the there are fewer than three noisy pixels in the level2.evt file, extra rows are filled as -1
| Pixel properties | Quadrant properties | ||||||
|---|---|---|---|---|---|---|---|
| Quadrant | DetID | PixID | Counts | Sigma | Mean | Median | Sigma |
| A | 15 | 192 | 885505 | 5363.64 | 830 | 815 | 164.9 |
| A | 0 | 13 | 59995 | 358.79 | 830 | 815 | 164.9 |
| A | 13 | 254 | 12001 | 67.82 | 830 | 815 | 164.9 |
| B | 10 | 245 | 245159 | 1567.62 | 826 | 805 | 155.9 |
| B | 10 | 246 | 127059 | 809.97 | 826 | 805 | 155.9 |
| B | 12 | 111 | 18604 | 114.19 | 826 | 805 | 155.9 |
| C | 14 | 238 | 129698 | 690.53 | 799 | 805 | 186.7 |
| C | 2 | 114 | 15687 | 79.73 | 799 | 805 | 186.7 |
| C | 13 | 61 | 5526 | 25.29 | 799 | 805 | 186.7 |
| D | 1 | 52 | 1072384 | 5863.22 | 778 | 758 | 182.8 |
| D | 7 | 80 | 825905 | 4514.66 | 778 | 758 | 182.8 |
| D | 8 | 195 | 315194 | 1720.38 | 778 | 758 | 182.8 |
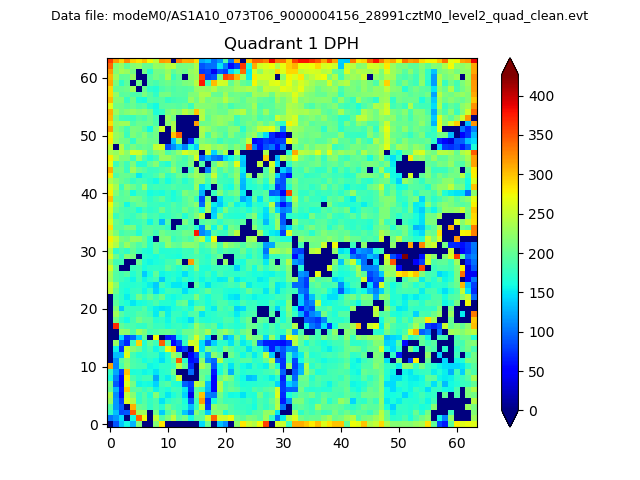
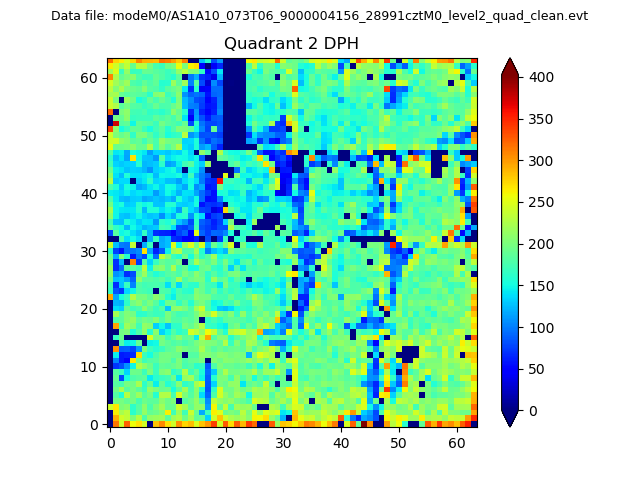
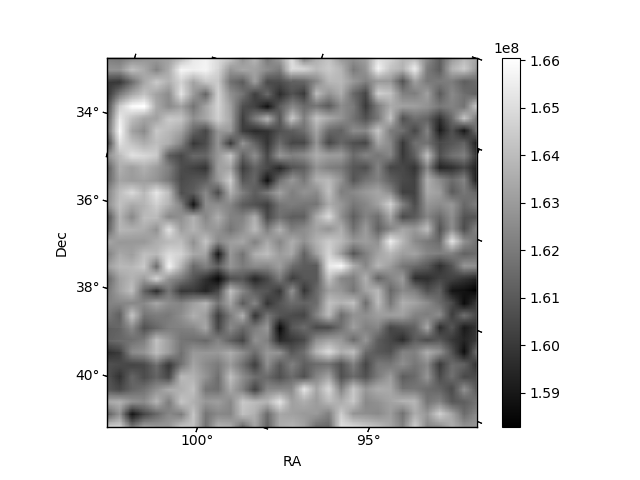
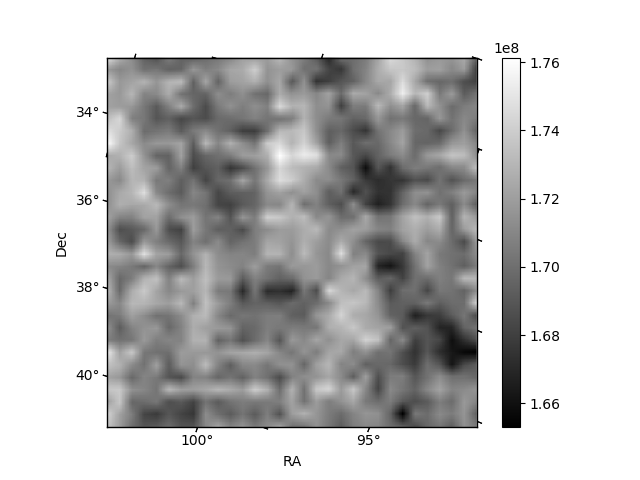
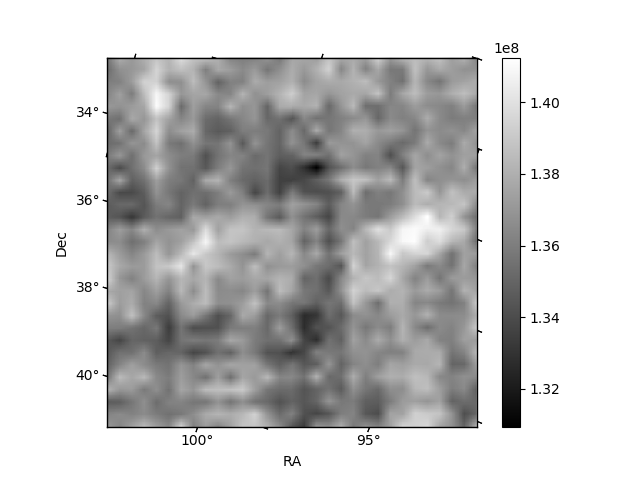
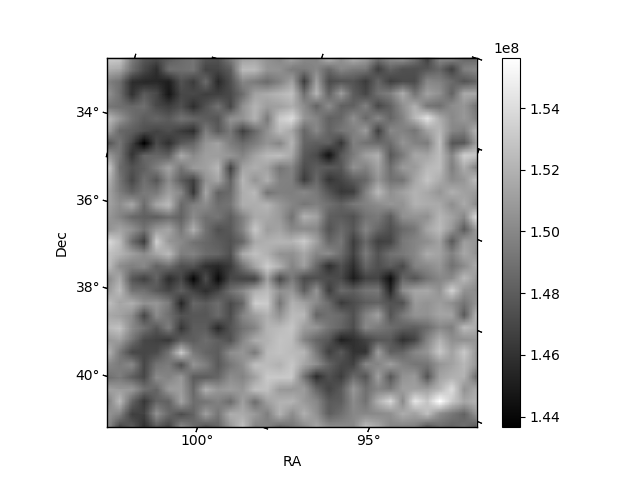
Histogram calculated using DETX and DETY for each event in the final _common_clean file
| Quadrant A | 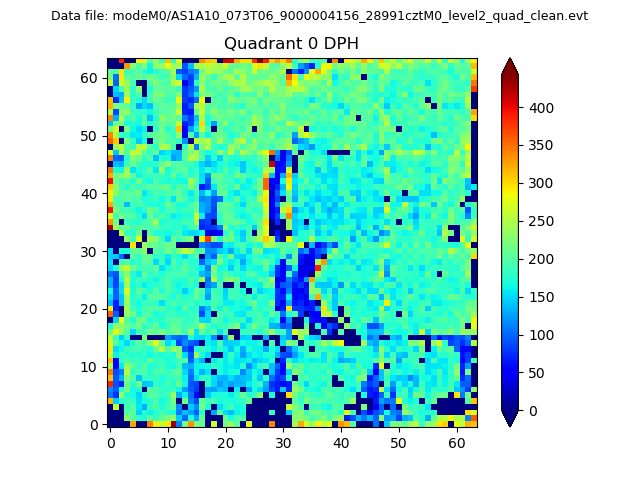 |
 |
Quadrant B |
|---|---|---|---|
| Quadrant D | 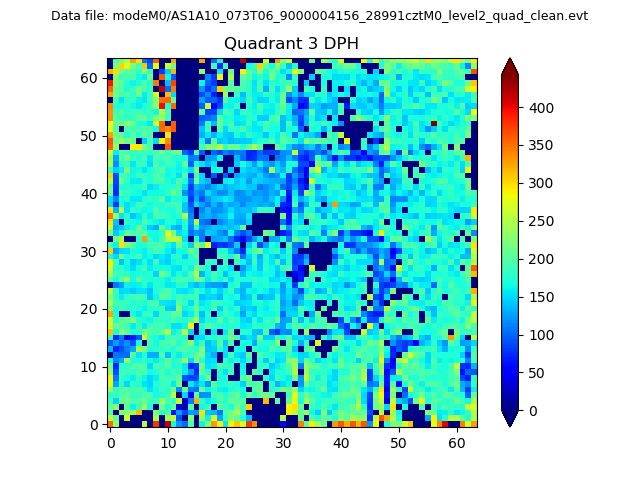 |
 |
Quadrant C |
| Plot type | Count rate plots | Images |
|---|---|---|
| Comparison with Poisson distribution Blue bars denote a histogram of data divided into 1 sec bins. Red curve is a Poisson curve with rate = median count rate of data. |
 |
 |
| Quadrant-wise count rates Data is divided into 100 sec bins |
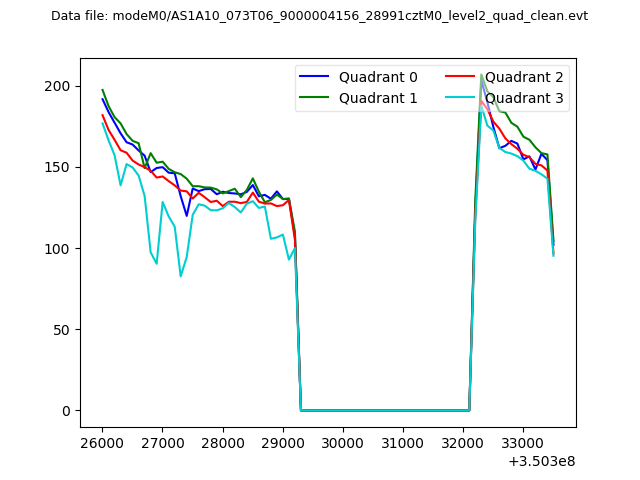 |
|
| Module-wise count rates for Quadrant A Data is divided into 100 sec bins |
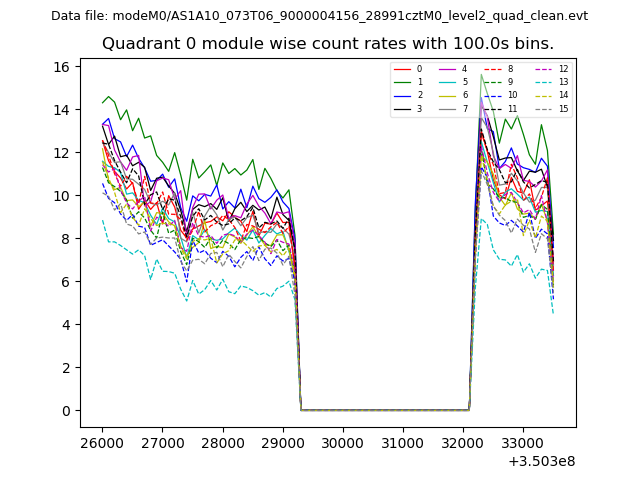 |
 |
| Module-wise count rates for Quadrant B Data is divided into 100 sec bins |
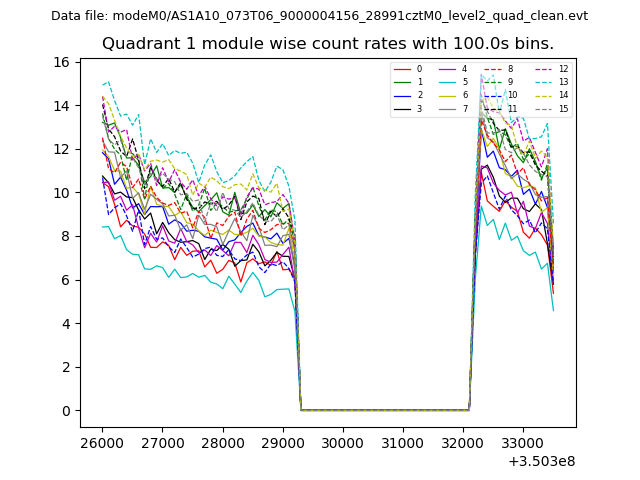 |
 |
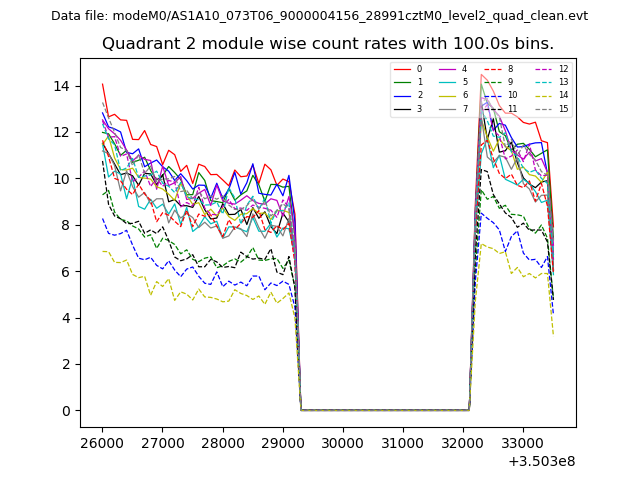
| Module-wise count rates for Quadrant C Data is divided into 100 sec bins |
 |
 |
| Module-wise count rates for Quadrant D Data is divided into 100 sec bins |
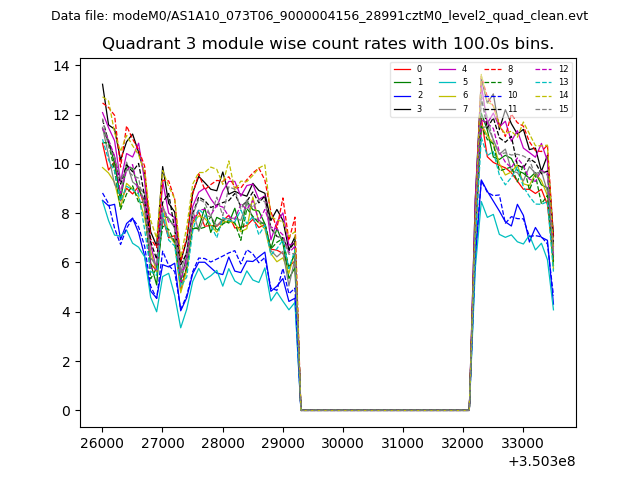 |
 |
| Parameter | Plot |
|---|---|
| CZT HV Monitor | 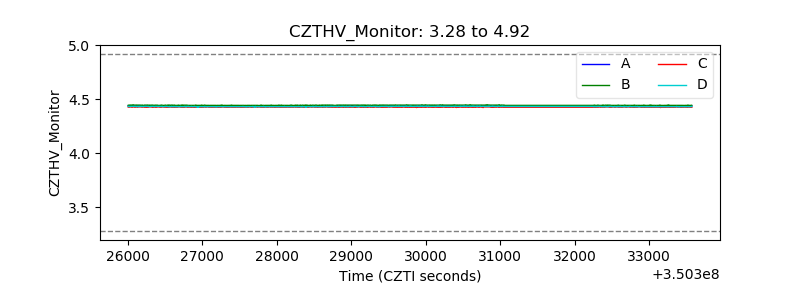 |
| D_VDD | 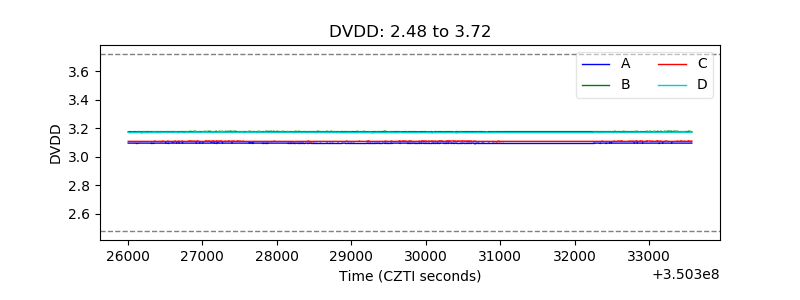 |
| Temperature 1 | 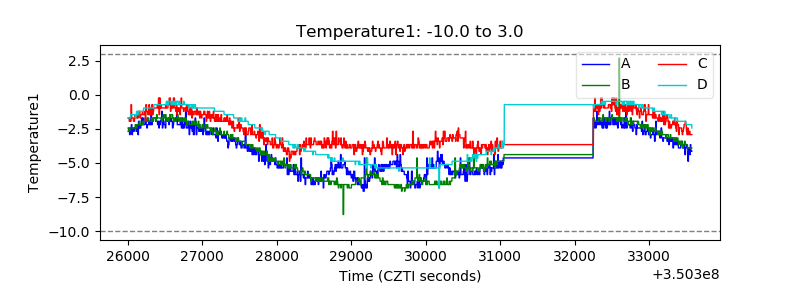 |
| Veto HV Monitor | 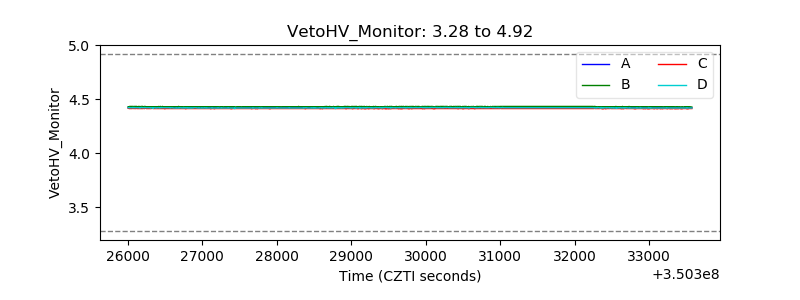 |
| Veto LLD | 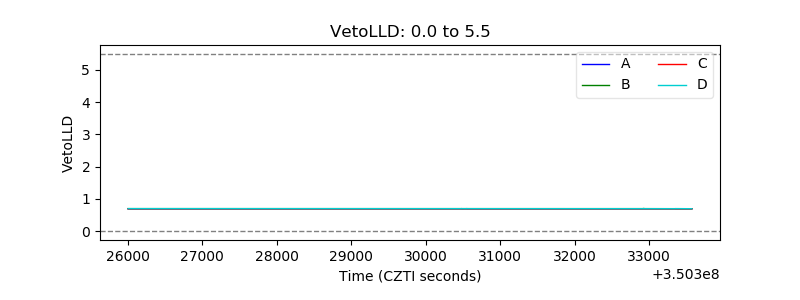 |
| Alpha Counter | 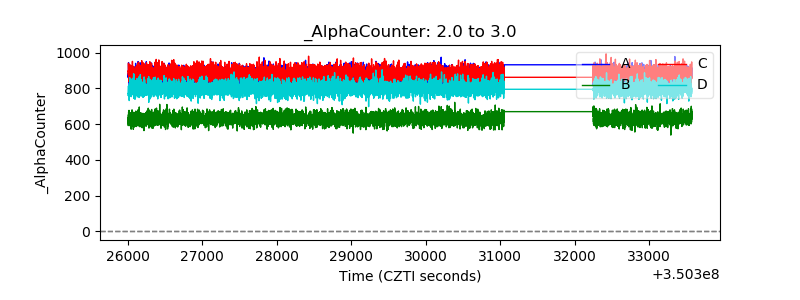 |
| _CPM_Rate | 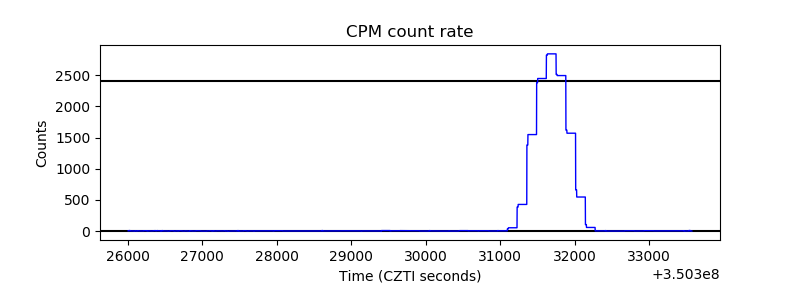 |
| CZT Counter | 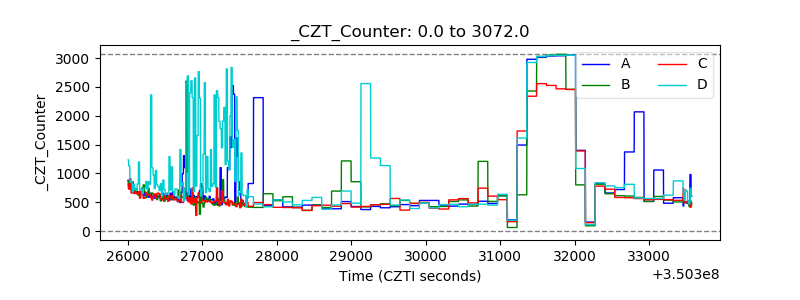 |
| +2.5 Volts monitor |  |
| +5 Volts monitor |  |
| _ROLL_ROT | 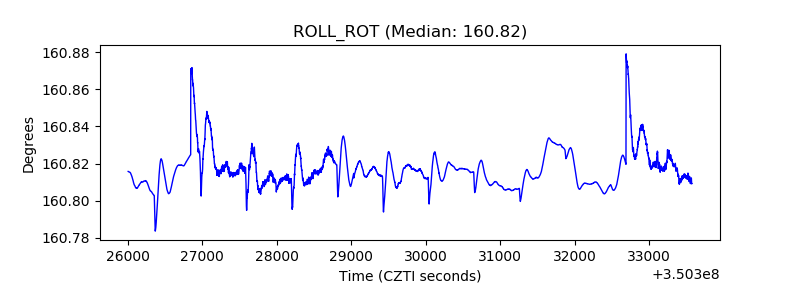 |
| _Roll_DEC | 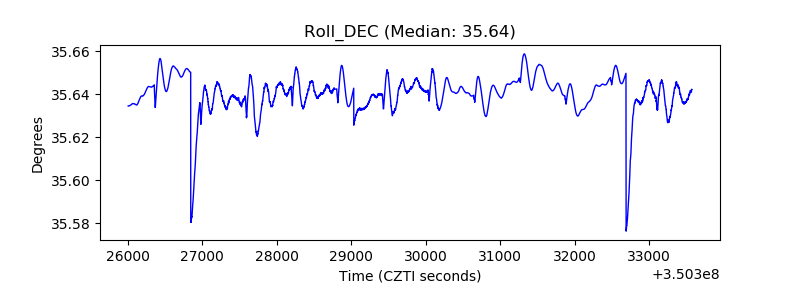 |
| _Roll_RA | 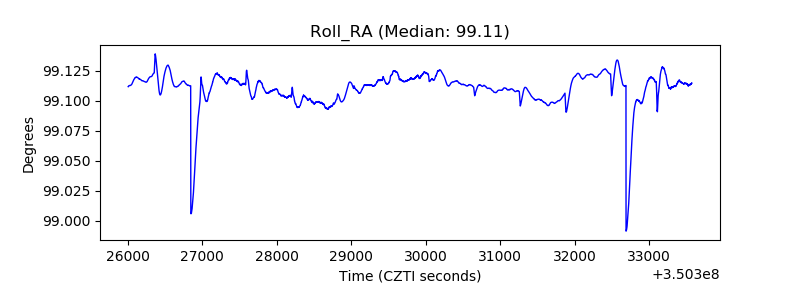 |
| Veto Counter | 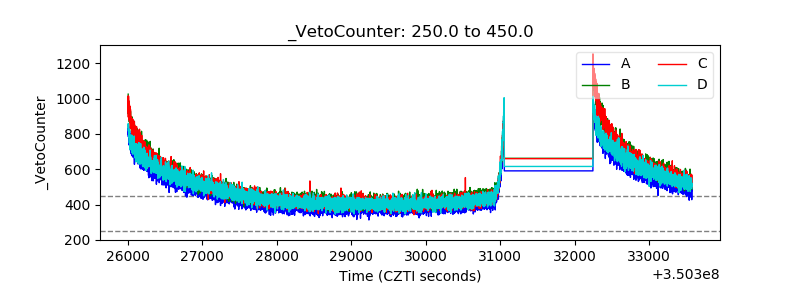 |