| Param | Original file | Final file |
|---|---|---|
| Filename | modeM0/AS1A10_073T06_9000004156_28994cztM0_level2.evt | modeM0/AS1A10_073T06_9000004156_28994cztM0_level2_quad_clean.evt |
| Size (bytes) | 477,466,560 | 97,459,200 |
| Size | 455.3 MB | 92.9 MB |
| Events in quadrant A | 3,136,114 | 644,049 |
| Events in quadrant B | 3,424,055 | 665,784 |
| Events in quadrant C | 3,224,979 | 620,028 |
| Events in quadrant D | 4,251,479 | 586,035 |
| Mode M9 | |||
|---|---|---|---|
| Quadrant | BADHDUFLAG | Total packets | Discarded packets |
| A | 0 | 23 | 0 |
| B | 0 | 24 | 0 |
| C | 0 | 24 | 0 |
| D | 0 | 24 | 0 |
| Mode SS | |||
|---|---|---|---|
| Quadrant | BADHDUFLAG | Total packets | Discarded packets |
| A | 0 | 126 | 0 |
| B | 0 | 126 | 0 |
| C | 0 | 126 | 0 |
| D | 0 | 126 | 0 |
| Mode M0 | |||
|---|---|---|---|
| Quadrant | BADHDUFLAG | Total packets | Discarded packets |
| A | 0 | 13199 | 2 |
| B | 0 | 13940 | 2 |
| C | 0 | 13360 | 3 |
| D | 0 | 16763 | 2 |
| Quadrant | Total seconds | Saturated seconds | Saturation percentage |
|---|---|---|---|
| A | 6239 | 31 | 0.496874% |
| B | 6239 | 56 | 0.897580% |
| C | 6238 | 85 | 1.362616% |
| D | 6238 | 72 | 1.154216% |
Noise dominated data is calculated using 1-second bins in cleaned event files. If a bin has >2000 counts, and if more than 50% of those come from <1% of pixels, then it is considered to be noise-dominated and hence unusable.
| Quadrant | # 1 sec bins | Bins with >0 counts | Bins with >2000 counts | High rate bins dominated by noise | Noise dominated (total time) | Noise dominated (detector-on time) | Marked lightcurve |
|---|---|---|---|---|---|---|---|
| A | 7574 | 6241 | 0 | 0 | 0.00% | 0.00% |  |
| B | 7574 | 6241 | 12 | 12 | 0.16% | 0.19% |  |
| C | 7573 | 6240 | 3 | 3 | 0.04% | 0.05% |  |
| D | 7573 | 6240 | 59 | 59 | 0.78% | 0.95% |  |
Top three noisy pixels from each quadrant. If the there are fewer than three noisy pixels in the level2.evt file, extra rows are filled as -1
| Pixel properties | Quadrant properties | ||||||
|---|---|---|---|---|---|---|---|
| Quadrant | DetID | PixID | Counts | Sigma | Mean | Median | Sigma |
| A | 6 | 16 | 23997 | 145.51 | 805 | 790 | 159.5 |
| A | 13 | 254 | 11448 | 66.83 | 805 | 790 | 159.5 |
| A | 3 | 137 | 7267 | 40.61 | 805 | 790 | 159.5 |
| B | 10 | 245 | 134067 | 874.02 | 810 | 790 | 152.5 |
| B | 10 | 246 | 97535 | 634.45 | 810 | 790 | 152.5 |
| B | 12 | 111 | 17879 | 112.07 | 810 | 790 | 152.5 |
| C | 14 | 238 | 127987 | 704.0 | 780 | 787 | 180.7 |
| C | 3 | 233 | 30228 | 162.94 | 780 | 787 | 180.7 |
| C | 2 | 114 | 15046 | 78.92 | 780 | 787 | 180.7 |
| D | 8 | 195 | 931132 | 5100.76 | 771 | 752 | 182.4 |
| D | 1 | 52 | 282625 | 1545.35 | 771 | 752 | 182.4 |
| D | 2 | 250 | 35580 | 190.94 | 771 | 752 | 182.4 |
Histogram calculated using DETX and DETY for each event in the final _common_clean file
| Quadrant A |  |
 |
Quadrant B |
|---|---|---|---|
| Quadrant D | 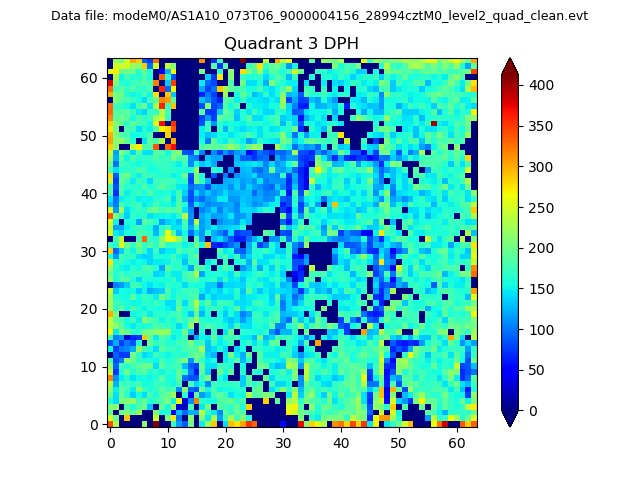 |
 |
Quadrant C |
| Plot type | Count rate plots | Images |
|---|---|---|
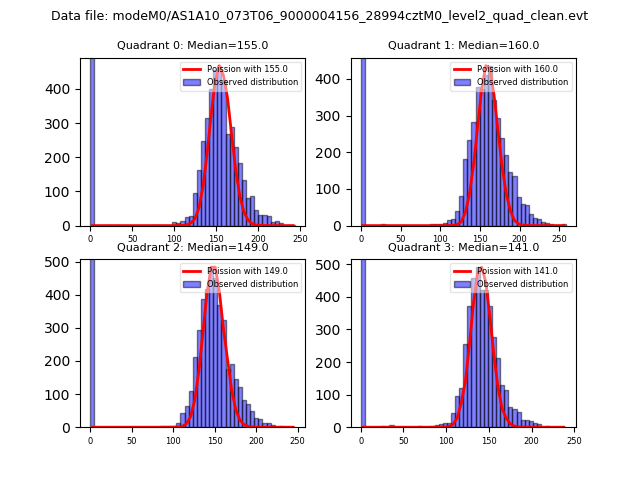
| Comparison with Poisson distribution Blue bars denote a histogram of data divided into 1 sec bins. Red curve is a Poisson curve with rate = median count rate of data. |
 |
 |
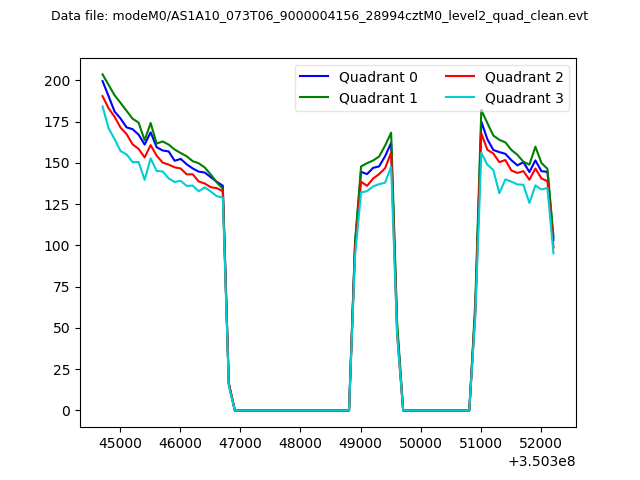
| Quadrant-wise count rates Data is divided into 100 sec bins |
 |
|
| Module-wise count rates for Quadrant A Data is divided into 100 sec bins |
 |
 |
| Module-wise count rates for Quadrant B Data is divided into 100 sec bins |
 |
 |
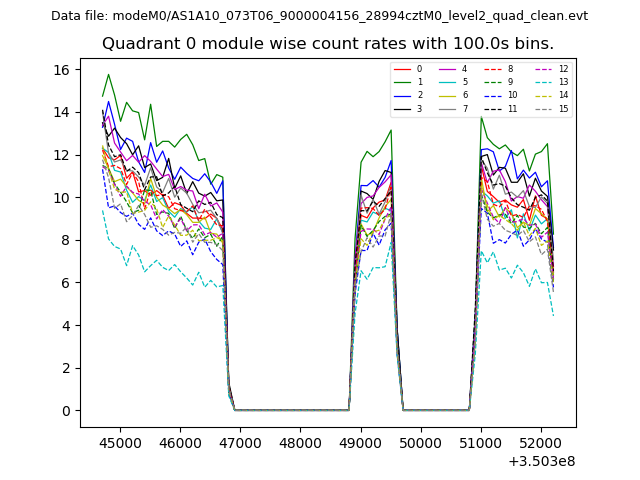
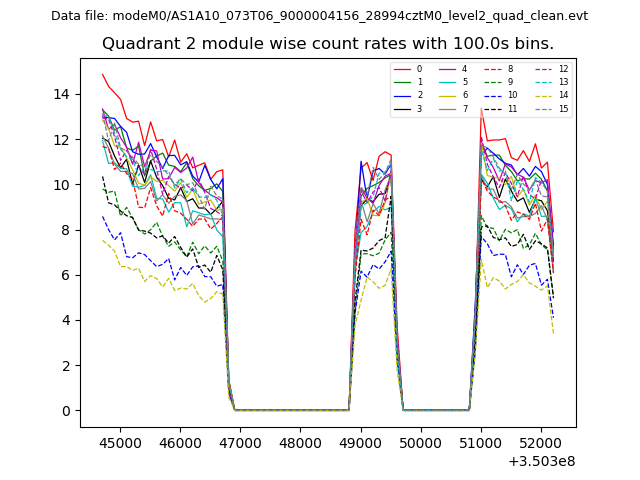
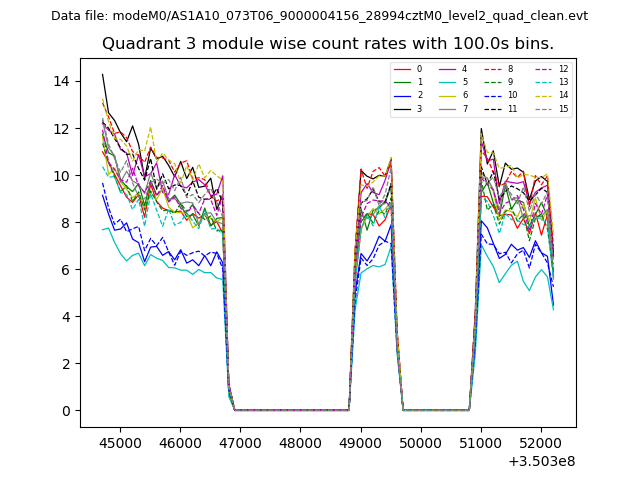
| Module-wise count rates for Quadrant C Data is divided into 100 sec bins |
 |
 |
| Module-wise count rates for Quadrant D Data is divided into 100 sec bins |
 |
 |
| Parameter | Plot |
|---|---|
| CZT HV Monitor | 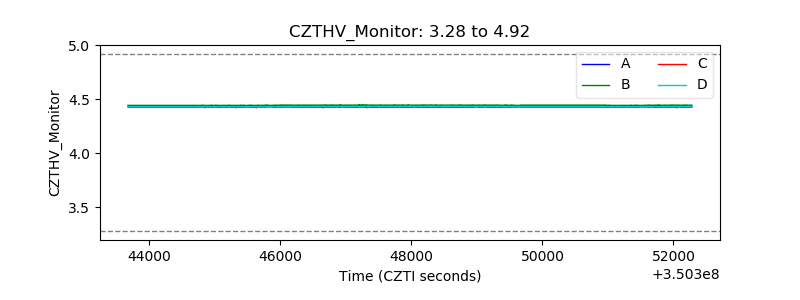 |
| D_VDD | 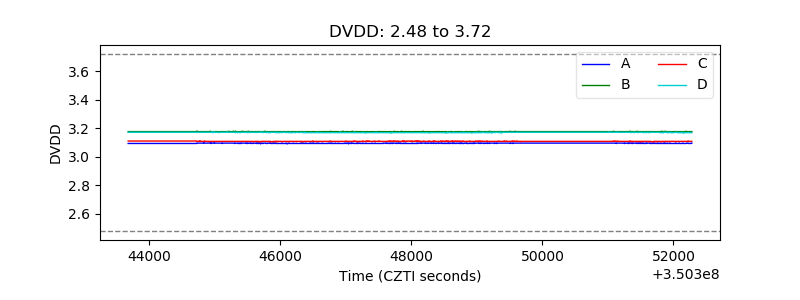 |
| Temperature 1 | 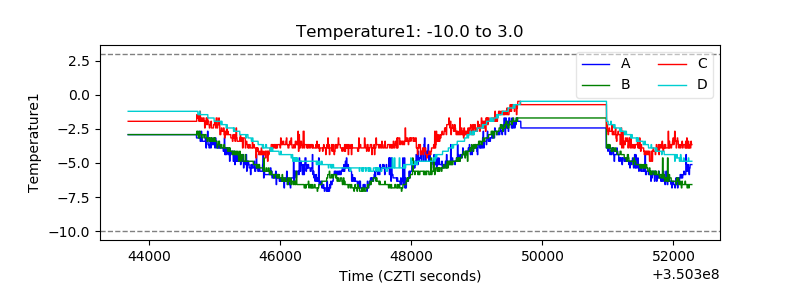 |
| Veto HV Monitor | 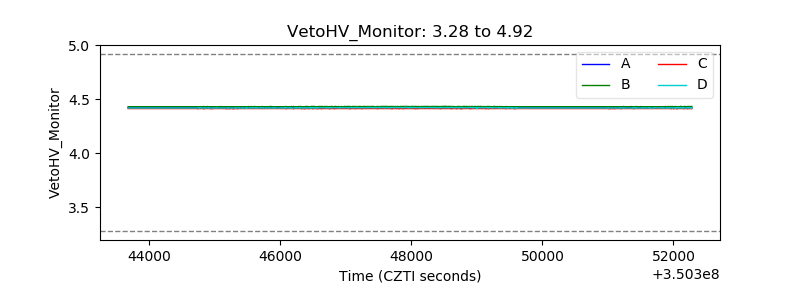 |
| Veto LLD | 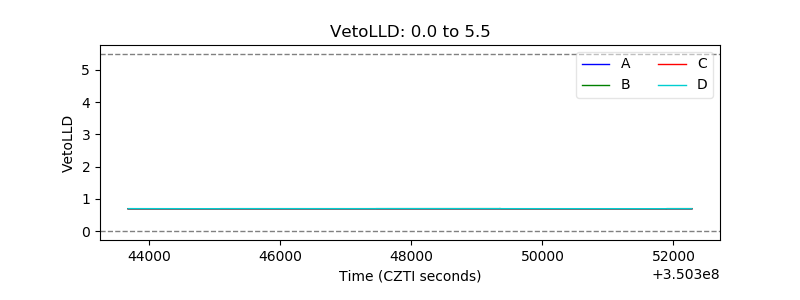 |
| Alpha Counter | 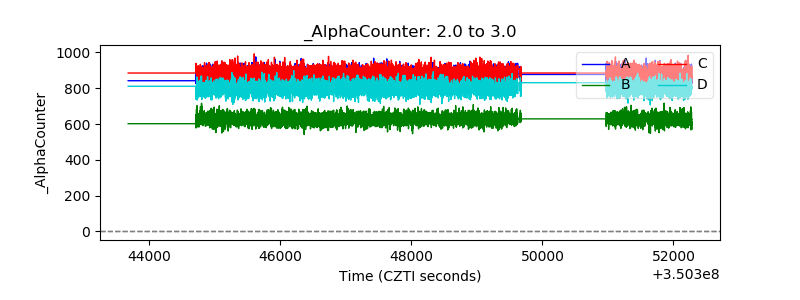 |
| _CPM_Rate | 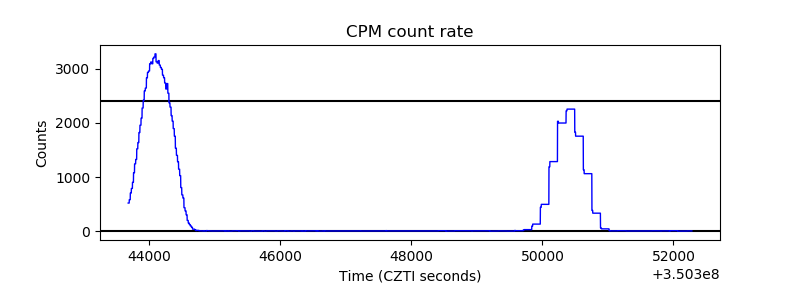 |
| CZT Counter | 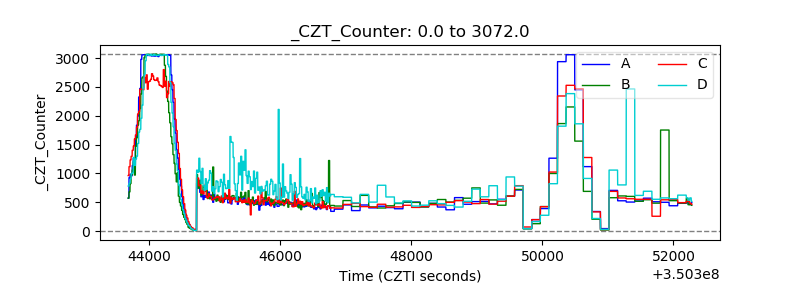 |
| +2.5 Volts monitor |  |
| +5 Volts monitor |  |
| _ROLL_ROT | 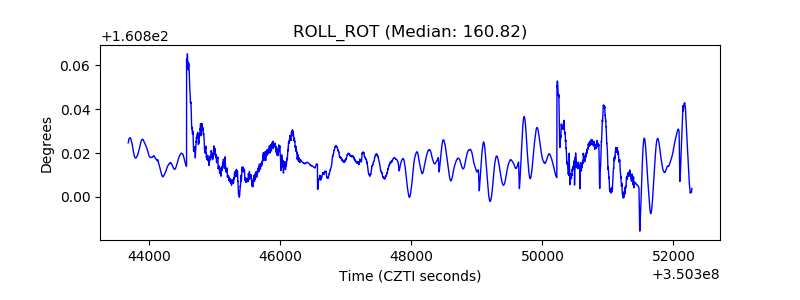 |
| _Roll_DEC | 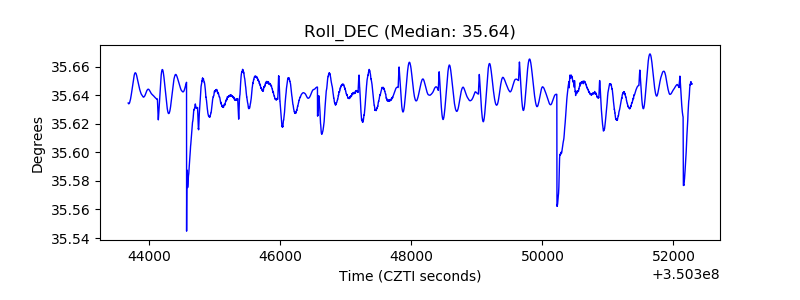 |
| _Roll_RA | 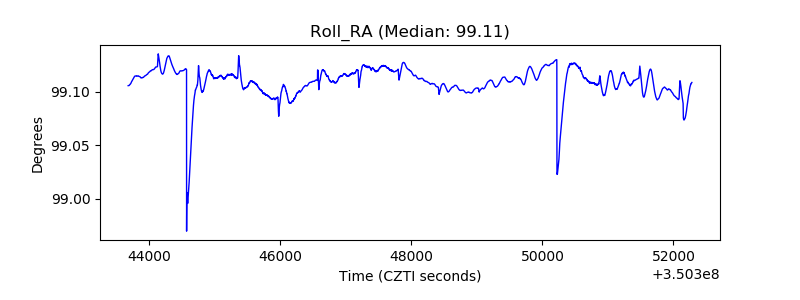 |
| Veto Counter |  |