| Param | Original file | Final file |
|---|---|---|
| Filename | modeM0/AS1A10_073T06_9000004156_28995cztM0_level2.evt | modeM0/AS1A10_073T06_9000004156_28995cztM0_level2_quad_clean.evt |
| Size (bytes) | 470,424,960 | 94,245,120 |
| Size | 448.6 MB | 89.9 MB |
| Events in quadrant A | 3,097,973 | 616,829 |
| Events in quadrant B | 3,421,247 | 634,161 |
| Events in quadrant C | 3,166,801 | 595,697 |
| Events in quadrant D | 4,128,611 | 563,489 |
| Mode M9 | |||
|---|---|---|---|
| Quadrant | BADHDUFLAG | Total packets | Discarded packets |
| A | 0 | 13 | 0 |
| B | 0 | 14 | 0 |
| C | 0 | 14 | 0 |
| D | 0 | 14 | 0 |
| Mode SS | |||
|---|---|---|---|
| Quadrant | BADHDUFLAG | Total packets | Discarded packets |
| A | 0 | 126 | 0 |
| B | 0 | 126 | 0 |
| C | 0 | 126 | 0 |
| D | 0 | 126 | 0 |
| Mode M0 | |||
|---|---|---|---|
| Quadrant | BADHDUFLAG | Total packets | Discarded packets |
| A | 0 | 13253 | 1 |
| B | 0 | 14107 | 1 |
| C | 0 | 13328 | 1 |
| D | 0 | 16526 | 1 |
| Quadrant | Total seconds | Saturated seconds | Saturation percentage |
|---|---|---|---|
| A | 6368 | 24 | 0.376884% |
| B | 6368 | 121 | 1.900126% |
| C | 6367 | 74 | 1.162243% |
| D | 6367 | 127 | 1.994660% |
Noise dominated data is calculated using 1-second bins in cleaned event files. If a bin has >2000 counts, and if more than 50% of those come from <1% of pixels, then it is considered to be noise-dominated and hence unusable.
| Quadrant | # 1 sec bins | Bins with >0 counts | Bins with >2000 counts | High rate bins dominated by noise | Noise dominated (total time) | Noise dominated (detector-on time) | Marked lightcurve |
|---|---|---|---|---|---|---|---|
| A | 7493 | 6364 | 0 | 0 | 0.00% | 0.00% | 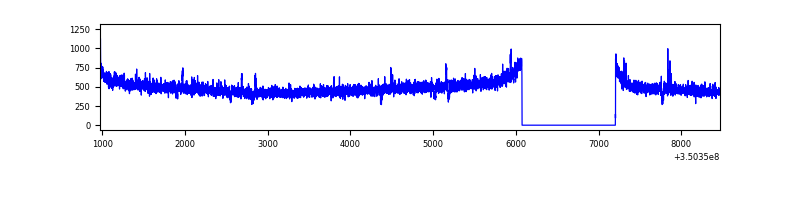 |
| B | 7493 | 6364 | 32 | 32 | 0.43% | 0.50% | 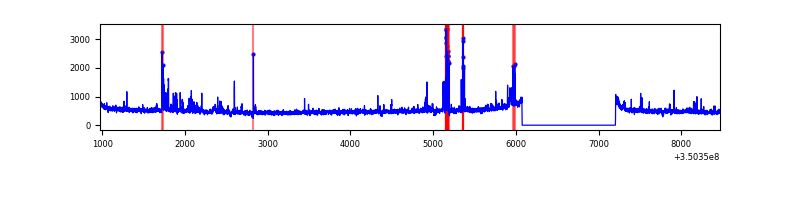 |
| C | 7492 | 6363 | 0 | 0 | 0.00% | 0.00% | 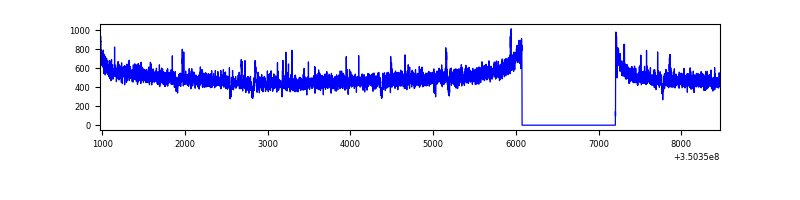 |
| D | 7492 | 6363 | 110 | 110 | 1.47% | 1.73% | 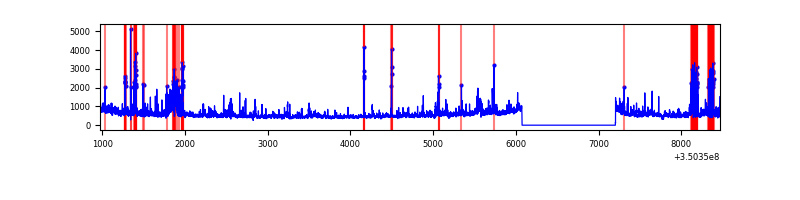 |
Top three noisy pixels from each quadrant. If the there are fewer than three noisy pixels in the level2.evt file, extra rows are filled as -1
| Pixel properties | Quadrant properties | ||||||
|---|---|---|---|---|---|---|---|
| Quadrant | DetID | PixID | Counts | Sigma | Mean | Median | Sigma |
| A | 6 | 16 | 21669 | 131.97 | 796 | 781 | 158.3 |
| A | 13 | 254 | 11643 | 68.63 | 796 | 781 | 158.3 |
| A | 3 | 137 | 7478 | 42.31 | 796 | 781 | 158.3 |
| B | 10 | 245 | 211224 | 1405.07 | 798 | 778 | 149.8 |
| B | 10 | 246 | 64636 | 426.36 | 798 | 778 | 149.8 |
| B | 12 | 111 | 18524 | 118.48 | 798 | 778 | 149.8 |
| C | 14 | 238 | 124282 | 688.73 | 770 | 777 | 179.3 |
| C | 3 | 233 | 23667 | 127.65 | 770 | 777 | 179.3 |
| C | 2 | 114 | 15026 | 79.46 | 770 | 777 | 179.3 |
| D | 8 | 195 | 568251 | 3165.97 | 759 | 741 | 179.3 |
| D | 1 | 52 | 256538 | 1427.02 | 759 | 741 | 179.3 |
| D | 13 | 104 | 256000 | 1424.02 | 759 | 741 | 179.3 |
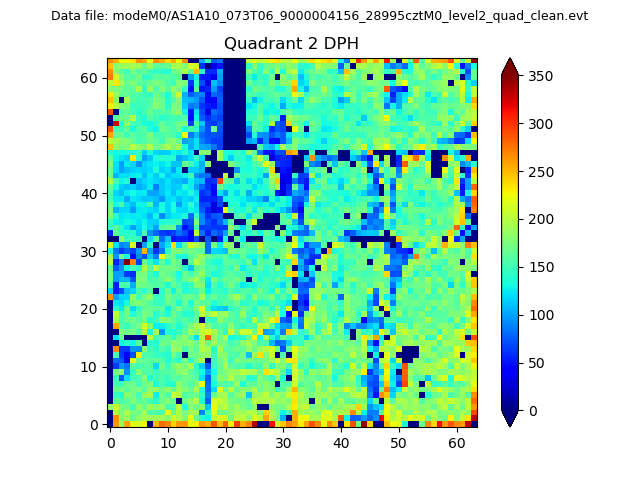
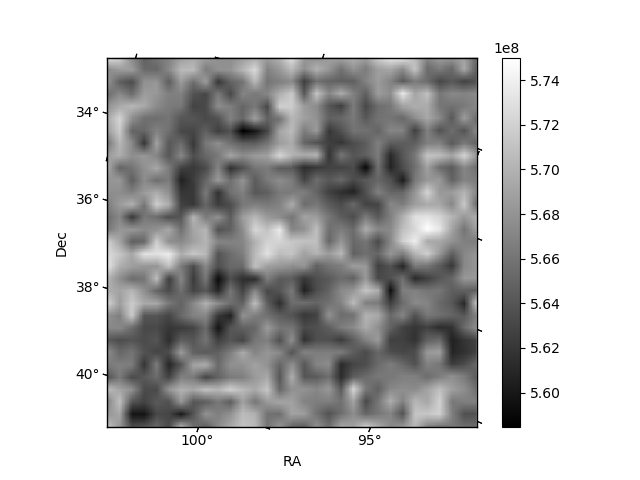
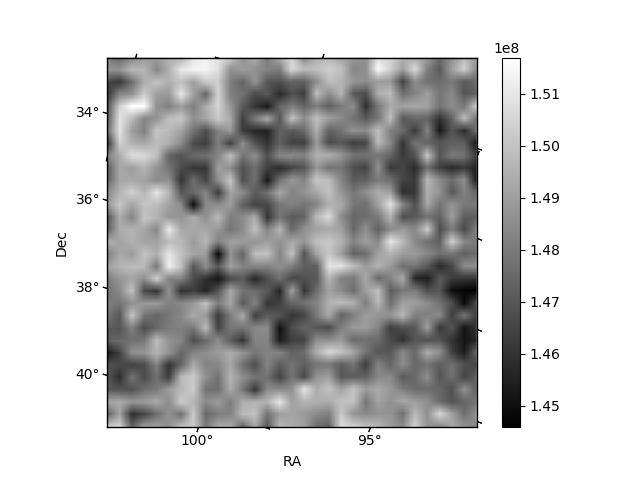
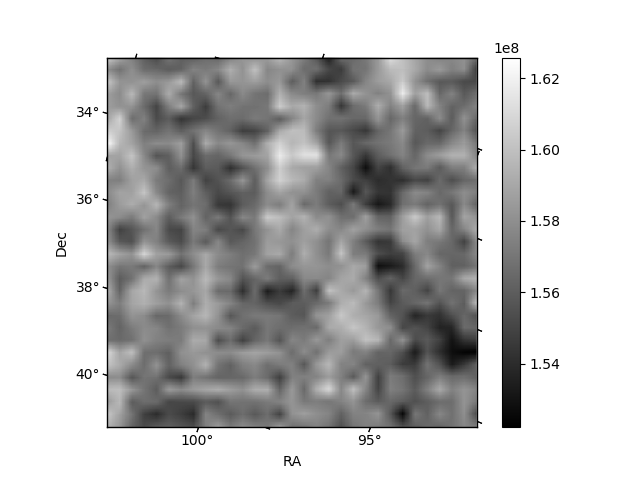
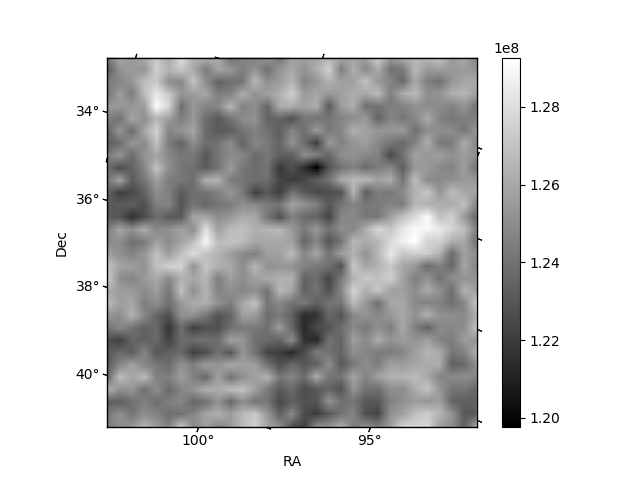
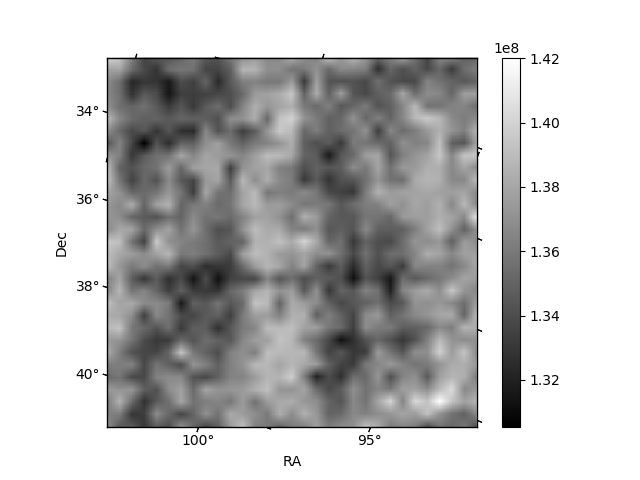
Histogram calculated using DETX and DETY for each event in the final _common_clean file
| Quadrant A | 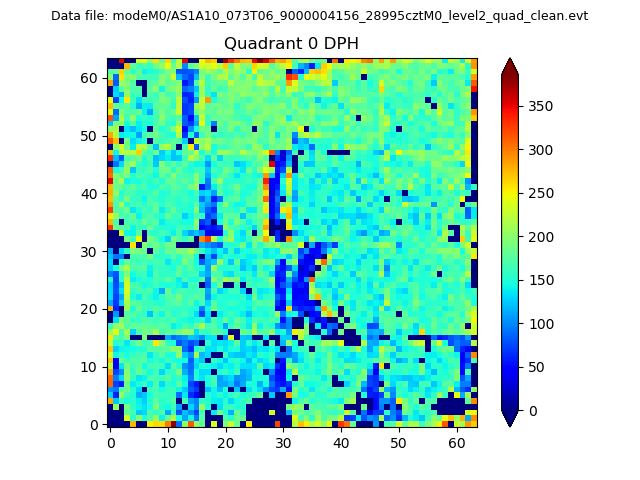 |
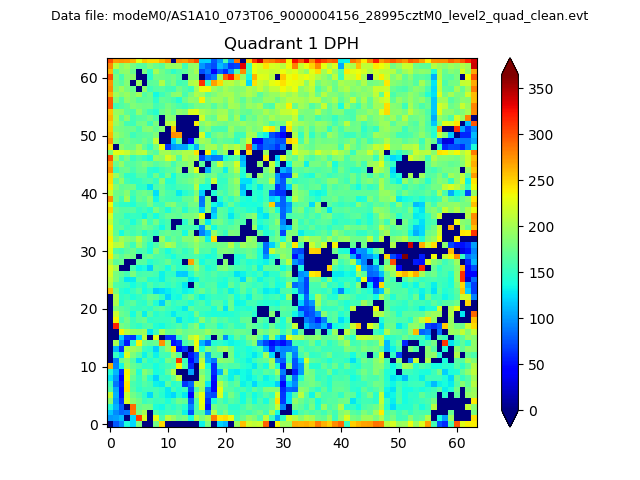 |
Quadrant B |
|---|---|---|---|
| Quadrant D | 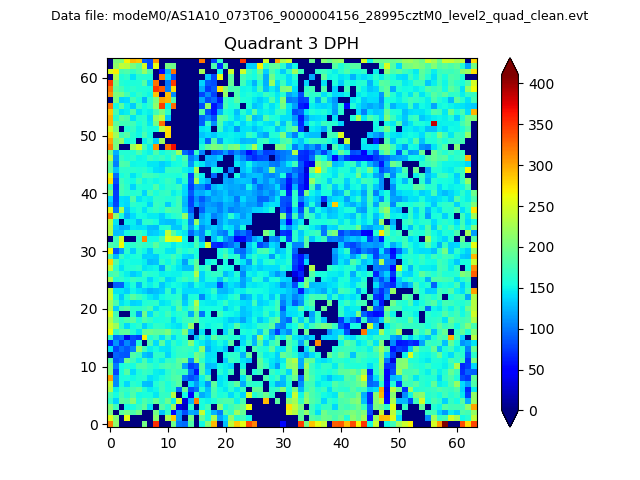 |
 |
Quadrant C |
| Plot type | Count rate plots | Images |
|---|---|---|
| Comparison with Poisson distribution Blue bars denote a histogram of data divided into 1 sec bins. Red curve is a Poisson curve with rate = median count rate of data. |
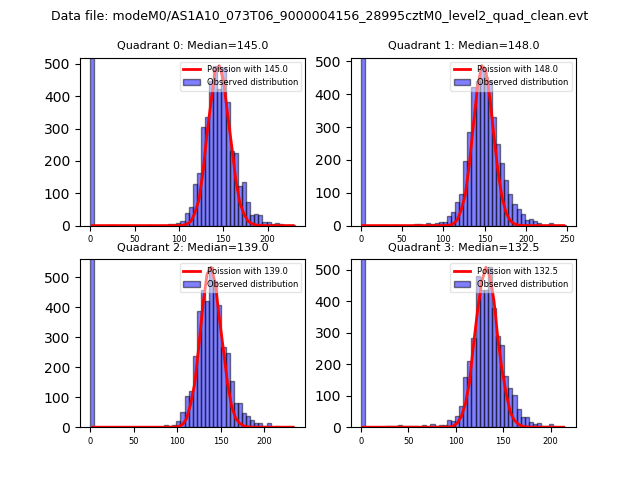 |
 |
| Quadrant-wise count rates Data is divided into 100 sec bins |
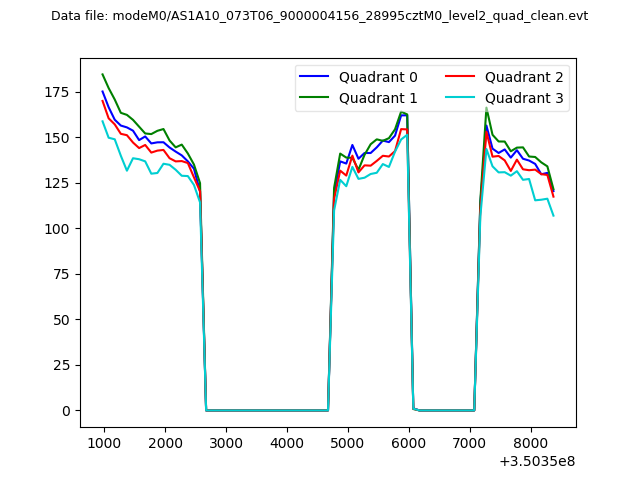 |
|
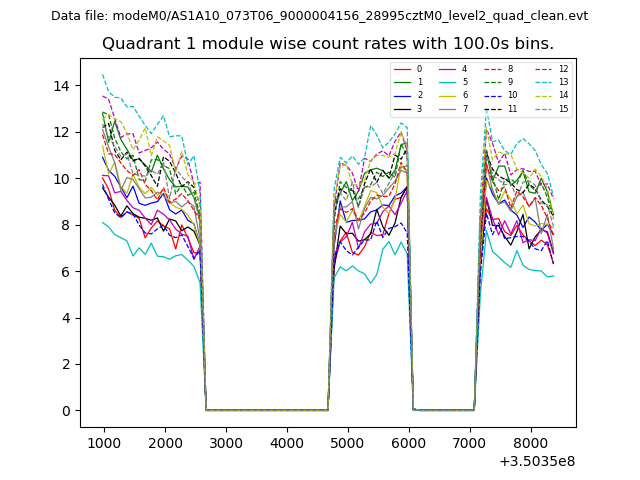
| Module-wise count rates for Quadrant A Data is divided into 100 sec bins |
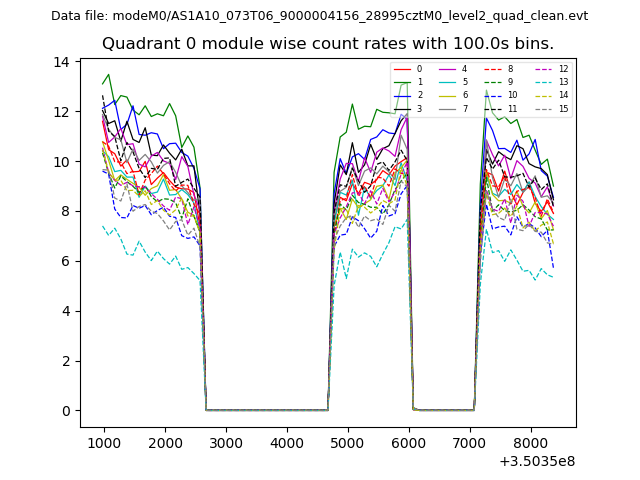 |
 |
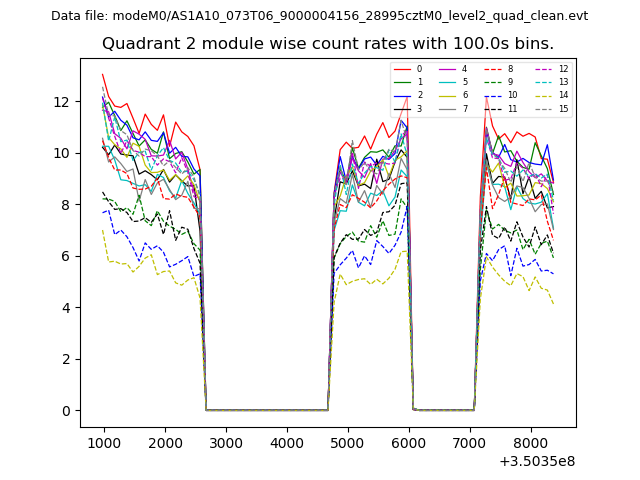
| Module-wise count rates for Quadrant B Data is divided into 100 sec bins |
 |
 |
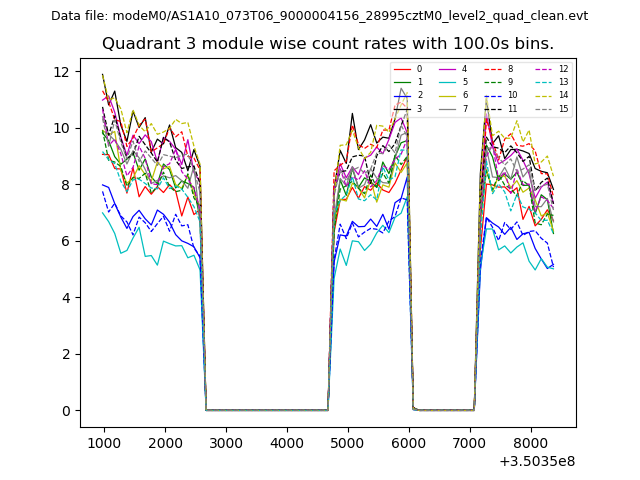
| Module-wise count rates for Quadrant C Data is divided into 100 sec bins |
 |
 |
| Module-wise count rates for Quadrant D Data is divided into 100 sec bins |
 |
 |
| Parameter | Plot |
|---|---|
| CZT HV Monitor |  |
| D_VDD | 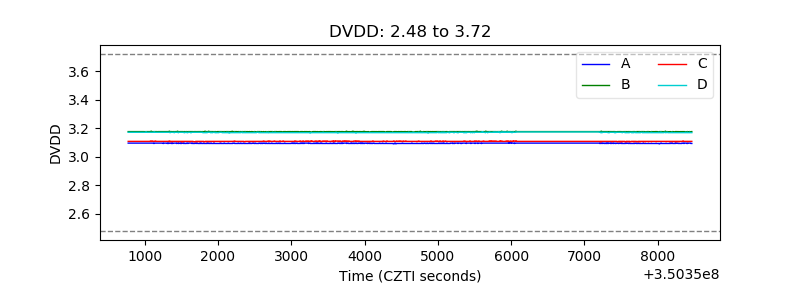 |
| Temperature 1 | 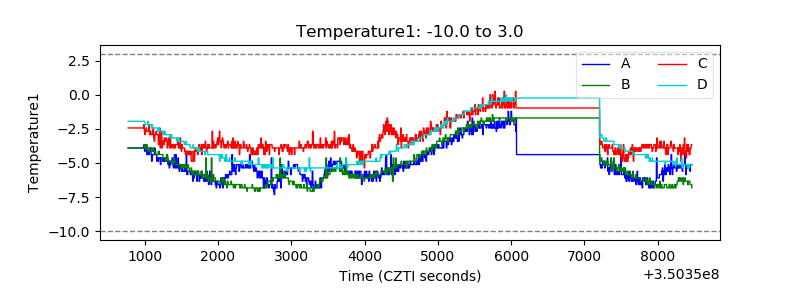 |
| Veto HV Monitor | 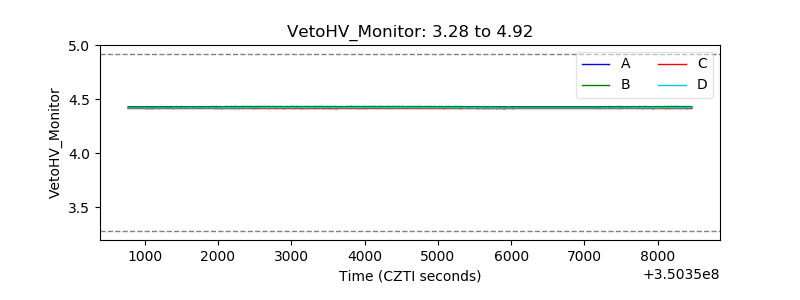 |
| Veto LLD |  |
| Alpha Counter | 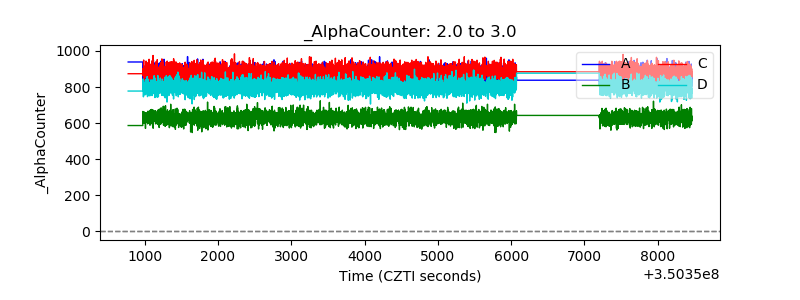 |
| _CPM_Rate | 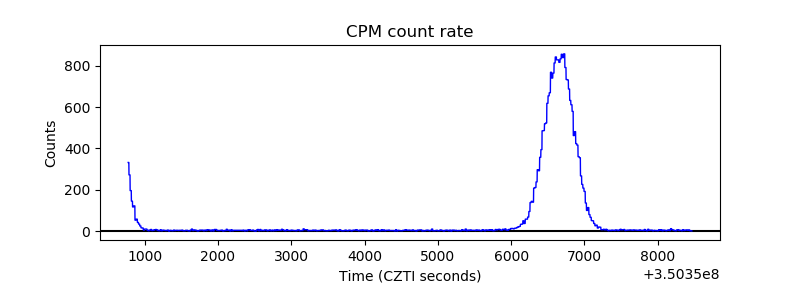 |
| CZT Counter | 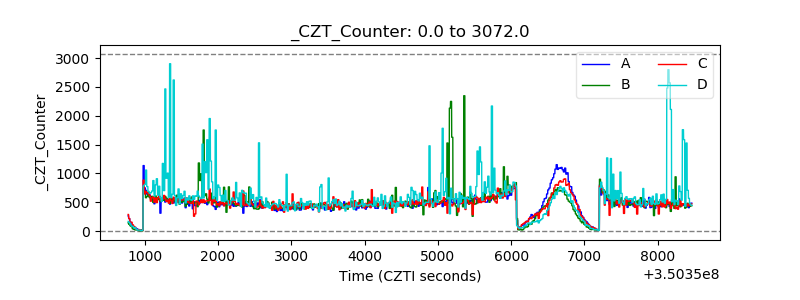 |
| +2.5 Volts monitor |  |
| +5 Volts monitor |  |
| _ROLL_ROT | 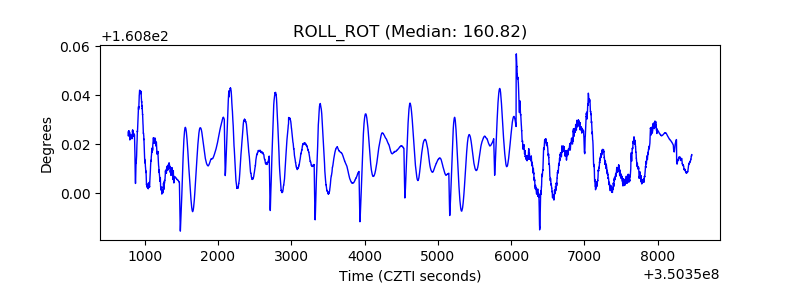 |
| _Roll_DEC | 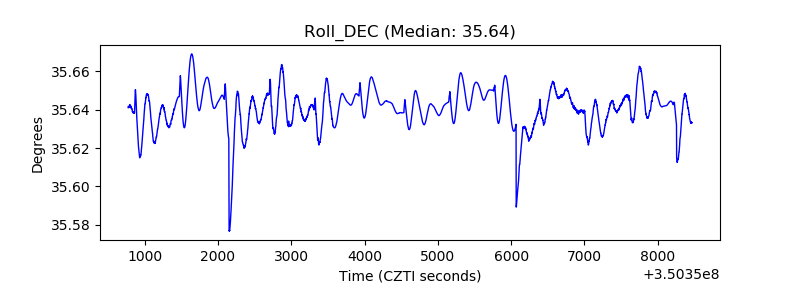 |
| _Roll_RA | 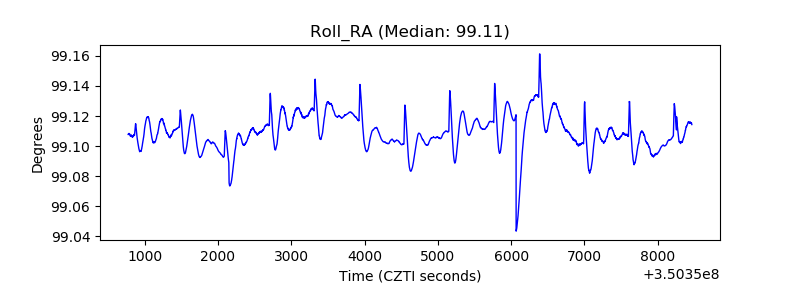 |
| Veto Counter |  |