| Param | Original file | Final file |
|---|---|---|
| Filename | modeM0/AS1A10_073T06_9000004156_28997cztM0_level2.evt | modeM0/AS1A10_073T06_9000004156_28997cztM0_level2_quad_clean.evt |
| Size (bytes) | 1,313,786,880 | 229,423,680 |
| Size | 1.2 GB | 218.8 MB |
| Events in quadrant A | 8,572,968 | 1,464,545 |
| Events in quadrant B | 9,162,881 | 1,501,499 |
| Events in quadrant C | 8,823,221 | 1,414,084 |
| Events in quadrant D | 12,018,425 | 1,333,224 |
| Mode M9 | |||
|---|---|---|---|
| Quadrant | BADHDUFLAG | Total packets | Discarded packets |
| A | 0 | 24 | 0 |
| B | 0 | 25 | 0 |
| C | 0 | 25 | 0 |
| D | 0 | 25 | 0 |
| Mode SS | |||
|---|---|---|---|
| Quadrant | BADHDUFLAG | Total packets | Discarded packets |
| A | 0 | 364 | 0 |
| B | 0 | 364 | 0 |
| C | 0 | 364 | 0 |
| D | 0 | 364 | 0 |
| Mode M0 | |||
|---|---|---|---|
| Quadrant | BADHDUFLAG | Total packets | Discarded packets |
| A | 0 | 37009 | 4 |
| B | 0 | 38556 | 3 |
| C | 0 | 37230 | 3 |
| D | 0 | 47983 | 3 |
| Quadrant | Total seconds | Saturated seconds | Saturation percentage |
|---|---|---|---|
| A | 17914 | 113 | 0.630792% |
| B | 17914 | 303 | 1.691415% |
| C | 17914 | 217 | 1.211343% |
| D | 17914 | 560 | 3.126047% |
Noise dominated data is calculated using 1-second bins in cleaned event files. If a bin has >2000 counts, and if more than 50% of those come from <1% of pixels, then it is considered to be noise-dominated and hence unusable.
| Quadrant | # 1 sec bins | Bins with >0 counts | Bins with >2000 counts | High rate bins dominated by noise | Noise dominated (total time) | Noise dominated (detector-on time) | Marked lightcurve |
|---|---|---|---|---|---|---|---|
| A | 20224 | 17912 | 0 | 0 | 0.00% | 0.00% | 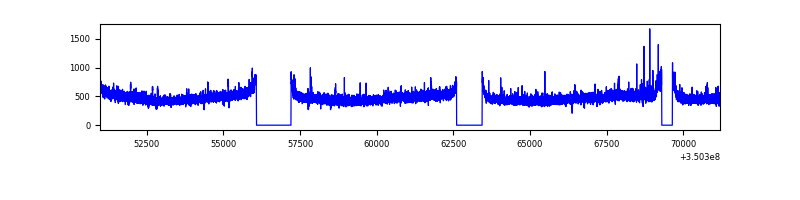 |
| B | 20224 | 17912 | 75 | 75 | 0.37% | 0.42% | 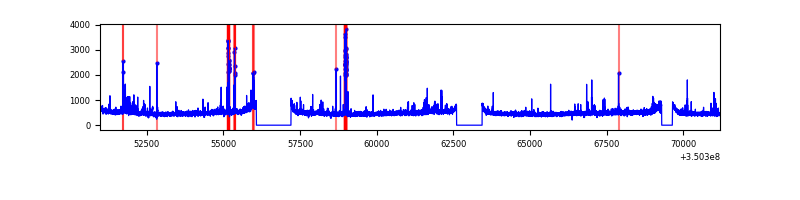 |
| C | 20224 | 17912 | 0 | 0 | 0.00% | 0.00% | 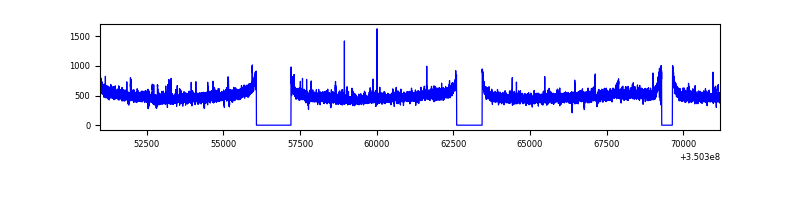 |
| D | 20224 | 17912 | 431 | 431 | 2.13% | 2.41% | 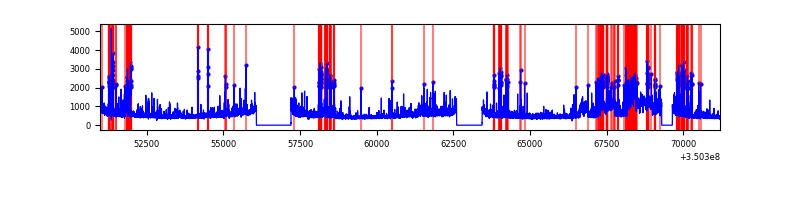 |
Top three noisy pixels from each quadrant. If the there are fewer than three noisy pixels in the level2.evt file, extra rows are filled as -1
| Pixel properties | Quadrant properties | ||||||
|---|---|---|---|---|---|---|---|
| Quadrant | DetID | PixID | Counts | Sigma | Mean | Median | Sigma |
| A | 6 | 16 | 46697 | 101.94 | 2195 | 2149 | 437.0 |
| A | 15 | 192 | 43623 | 94.91 | 2195 | 2149 | 437.0 |
| A | 13 | 254 | 32041 | 68.4 | 2195 | 2149 | 437.0 |
| B | 10 | 245 | 327292 | 793.28 | 2190 | 2134 | 409.9 |
| B | 10 | 246 | 182222 | 439.36 | 2190 | 2134 | 409.9 |
| B | 12 | 111 | 52136 | 121.99 | 2190 | 2134 | 409.9 |
| C | 14 | 238 | 341633 | 689.34 | 2115 | 2125 | 492.5 |
| C | 3 | 233 | 195280 | 392.18 | 2115 | 2125 | 492.5 |
| C | 2 | 114 | 42029 | 81.02 | 2115 | 2125 | 492.5 |
| D | 8 | 195 | 2075506 | 4230.13 | 2094 | 2043 | 490.2 |
| D | 1 | 52 | 871588 | 1773.98 | 2094 | 2043 | 490.2 |
| D | 13 | 104 | 822962 | 1674.78 | 2094 | 2043 | 490.2 |
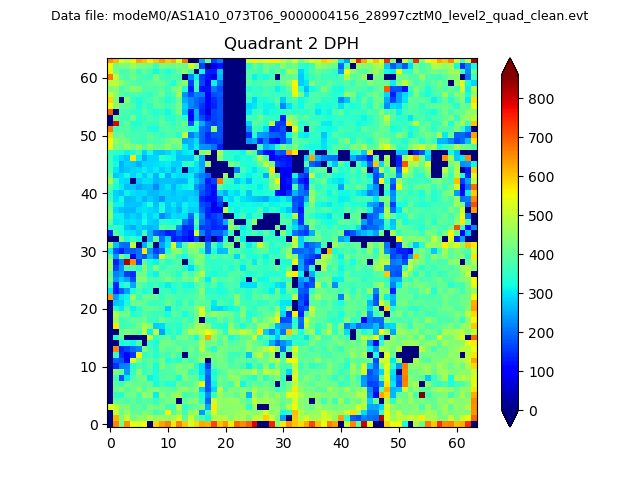
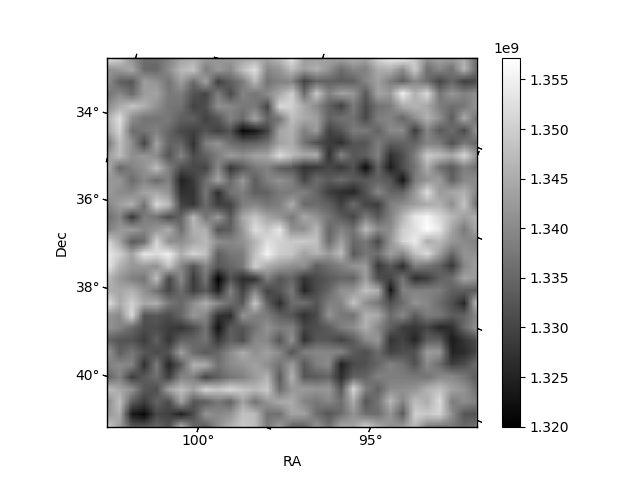
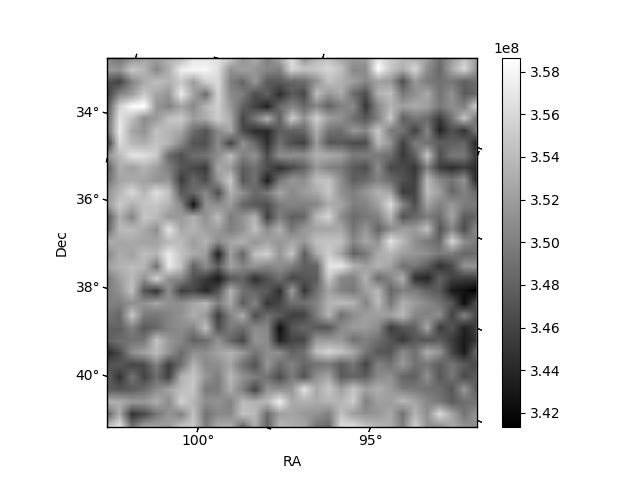
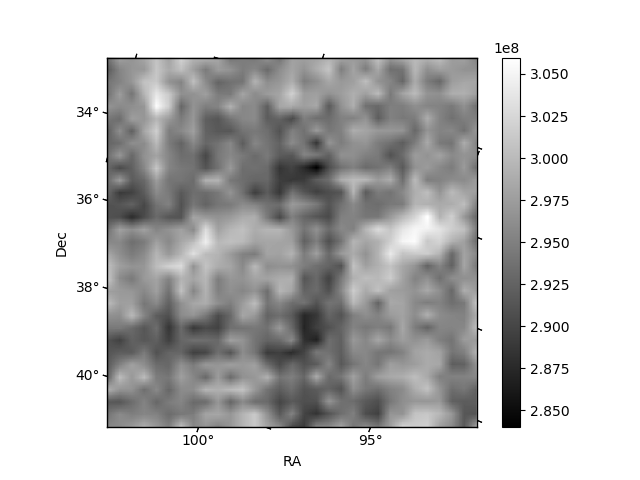
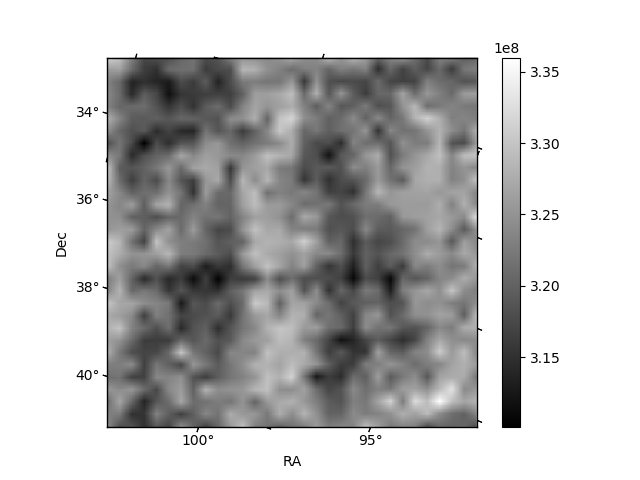
Histogram calculated using DETX and DETY for each event in the final _common_clean file
| Quadrant A | 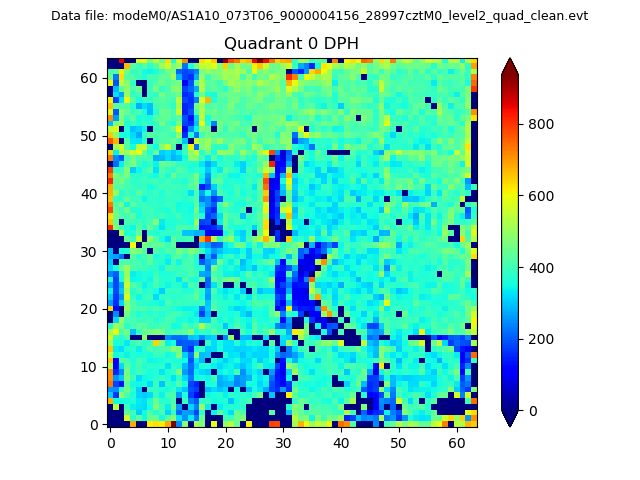 |
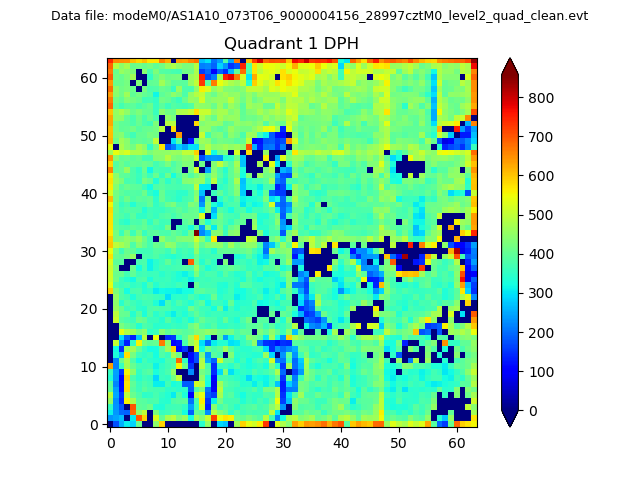 |
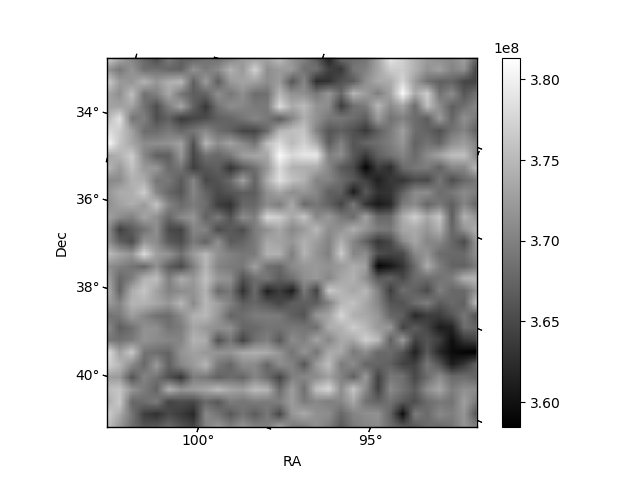
Quadrant B |
|---|---|---|---|
| Quadrant D | 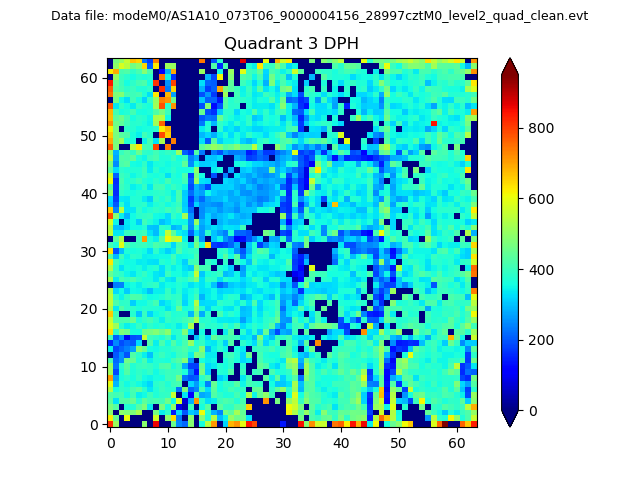 |
 |
Quadrant C |
| Plot type | Count rate plots | Images |
|---|---|---|
| Comparison with Poisson distribution Blue bars denote a histogram of data divided into 1 sec bins. Red curve is a Poisson curve with rate = median count rate of data. |
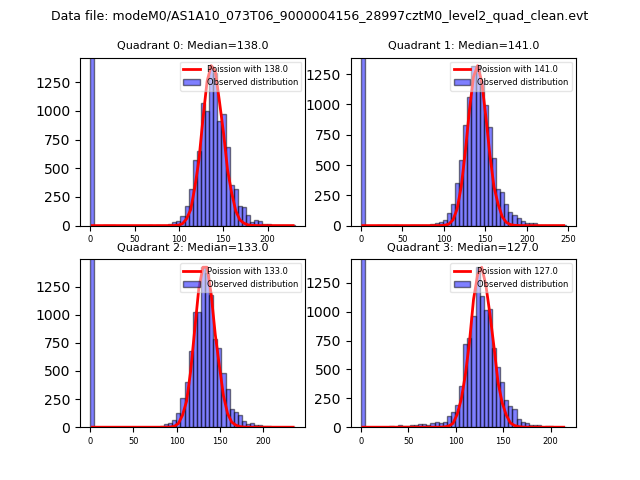 |
 |
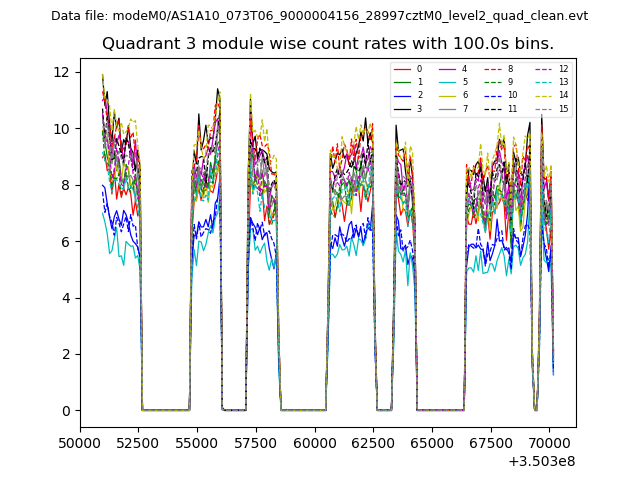
| Quadrant-wise count rates Data is divided into 100 sec bins |
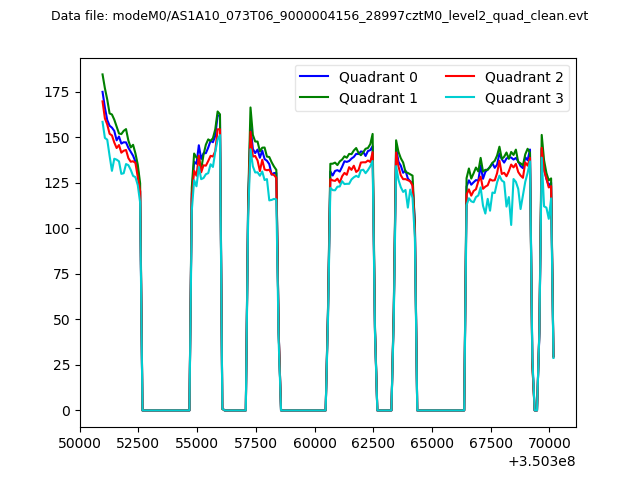 |
|
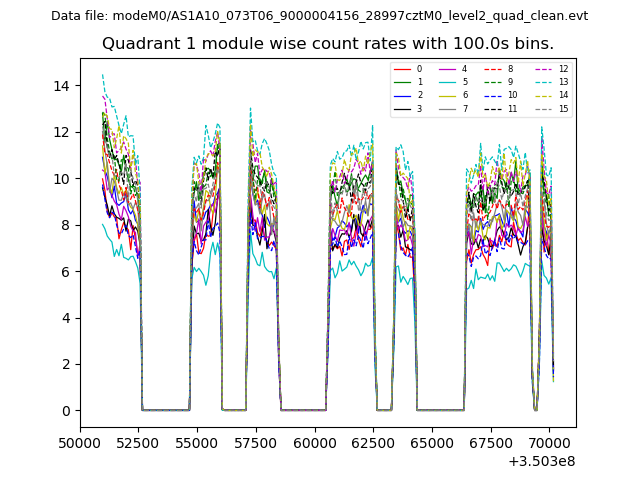
| Module-wise count rates for Quadrant A Data is divided into 100 sec bins |
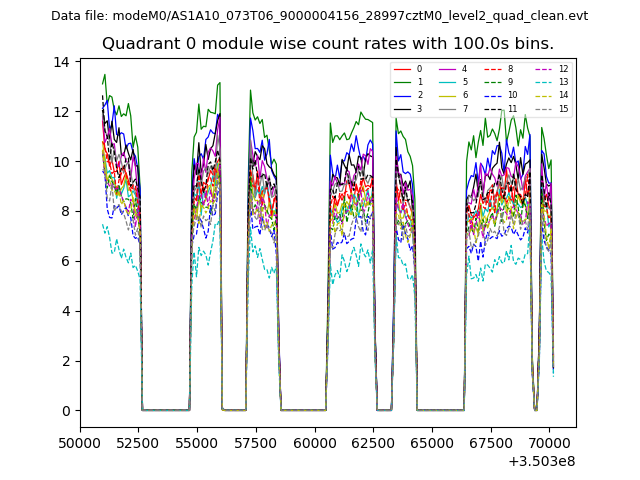 |
 |
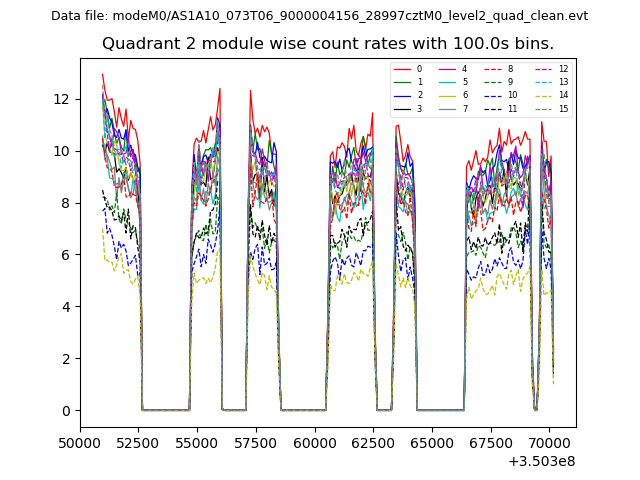
| Module-wise count rates for Quadrant B Data is divided into 100 sec bins |
 |
 |
| Module-wise count rates for Quadrant C Data is divided into 100 sec bins |
 |
 |
| Module-wise count rates for Quadrant D Data is divided into 100 sec bins |
 |
 |
| Parameter | Plot |
|---|---|
| CZT HV Monitor | 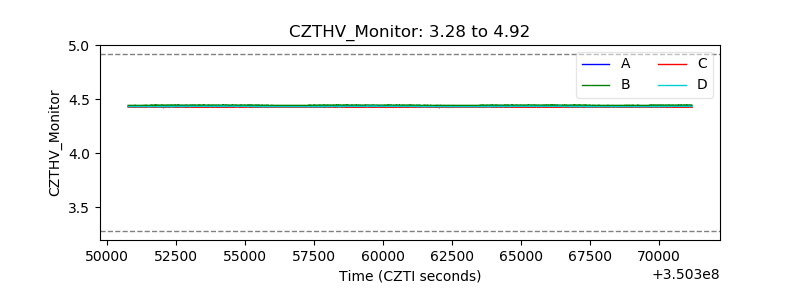 |
| D_VDD | 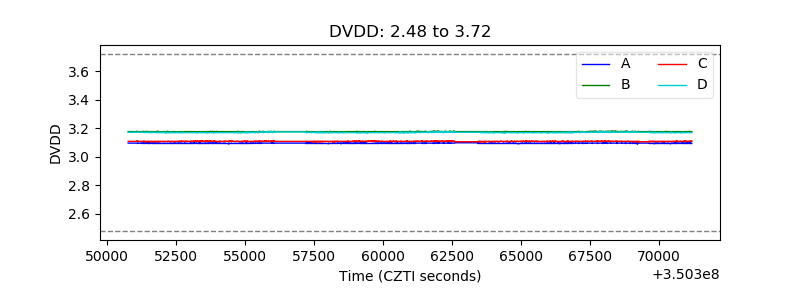 |
| Temperature 1 | 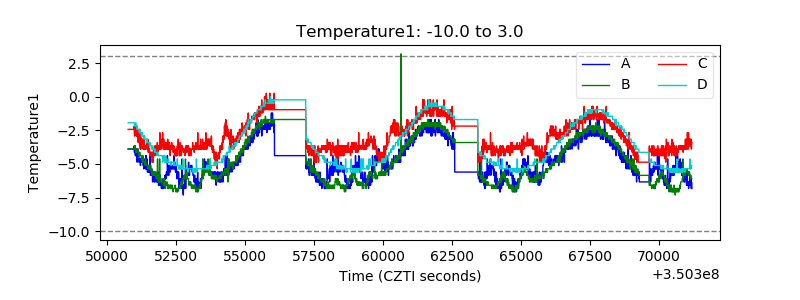 |
| Veto HV Monitor | 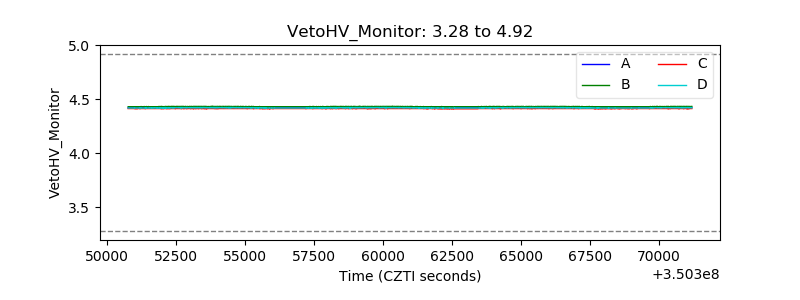 |
| Veto LLD |  |
| Alpha Counter | 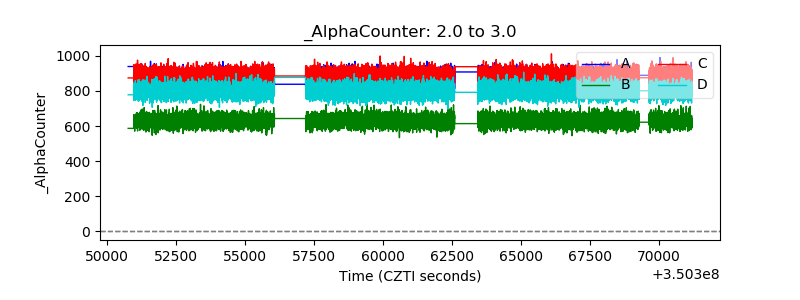 |
| _CPM_Rate | 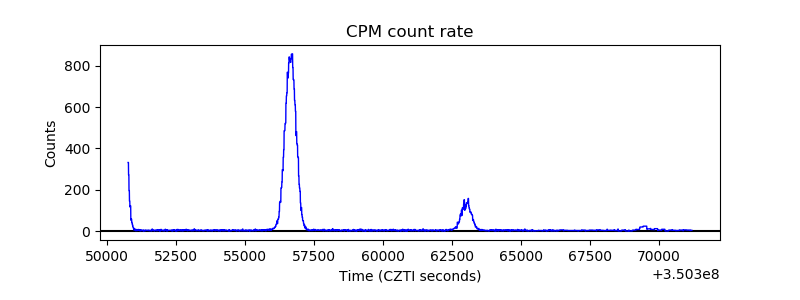 |
| CZT Counter | 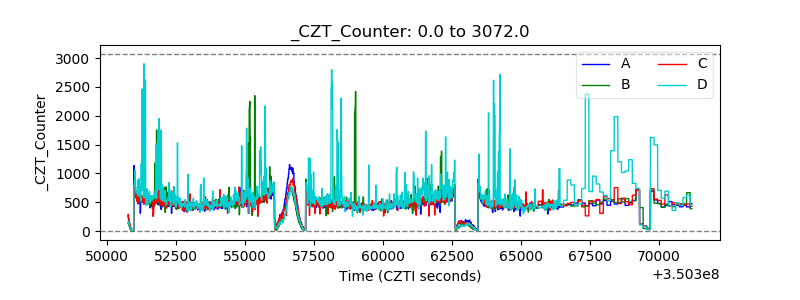 |
| +2.5 Volts monitor |  |
| +5 Volts monitor |  |
| _ROLL_ROT | 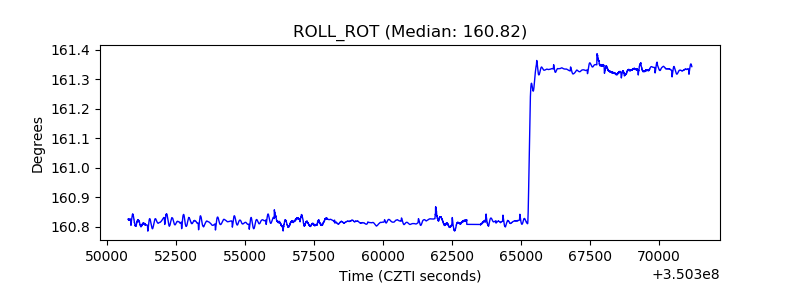 |
| _Roll_DEC | 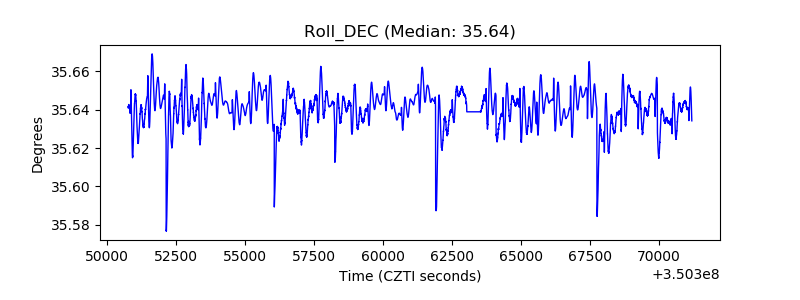 |
| _Roll_RA | 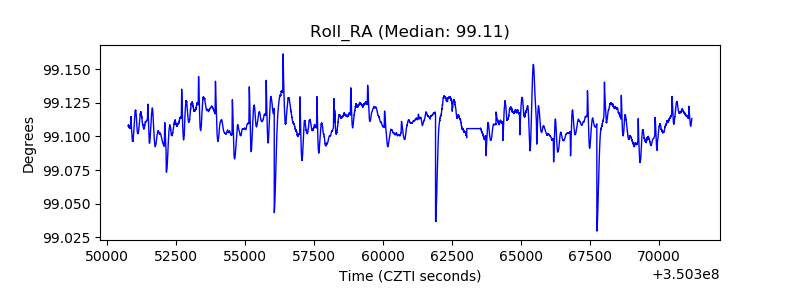 |
| Veto Counter | 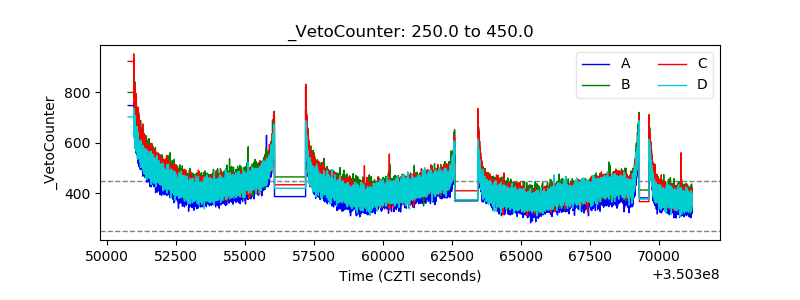 |