| Param | Original file | Final file |
|---|---|---|
| Filename | modeM0/AS1A10_073T06_9000004156_28998cztM0_level2.evt | modeM0/AS1A10_073T06_9000004156_28998cztM0_level2_quad_clean.evt |
| Size (bytes) | 616,190,400 | 84,741,120 |
| Size | 587.6 MB | 80.8 MB |
| Events in quadrant A | 3,684,190 | 528,536 |
| Events in quadrant B | 3,769,665 | 538,788 |
| Events in quadrant C | 3,926,450 | 510,613 |
| Events in quadrant D | 6,755,377 | 448,570 |
| Mode M9 | |||
|---|---|---|---|
| Quadrant | BADHDUFLAG | Total packets | Discarded packets |
| A | 0 | 1 | 0 |
| B | 0 | 1 | 0 |
| C | 0 | 1 | 0 |
| D | 0 | 1 | 0 |
| Mode SS | |||
|---|---|---|---|
| Quadrant | BADHDUFLAG | Total packets | Discarded packets |
| A | 0 | 156 | 0 |
| B | 0 | 156 | 0 |
| C | 0 | 156 | 0 |
| D | 0 | 156 | 0 |
| Mode M0 | |||
|---|---|---|---|
| Quadrant | BADHDUFLAG | Total packets | Discarded packets |
| A | 0 | 16008 | 1 |
| B | 0 | 16148 | 1 |
| C | 0 | 16223 | 1 |
| D | 0 | 25295 | 1 |
| Quadrant | Total seconds | Saturated seconds | Saturation percentage |
|---|---|---|---|
| A | 7753 | 219 | 2.824713% |
| B | 7753 | 256 | 3.301948% |
| C | 7753 | 258 | 3.327744% |
| D | 7753 | 1077 | 13.891397% |
Noise dominated data is calculated using 1-second bins in cleaned event files. If a bin has >2000 counts, and if more than 50% of those come from <1% of pixels, then it is considered to be noise-dominated and hence unusable.
| Quadrant | # 1 sec bins | Bins with >0 counts | Bins with >2000 counts | High rate bins dominated by noise | Noise dominated (total time) | Noise dominated (detector-on time) | Marked lightcurve |
|---|---|---|---|---|---|---|---|
| A | 7813 | 7750 | 0 | 0 | 0.00% | 0.00% | 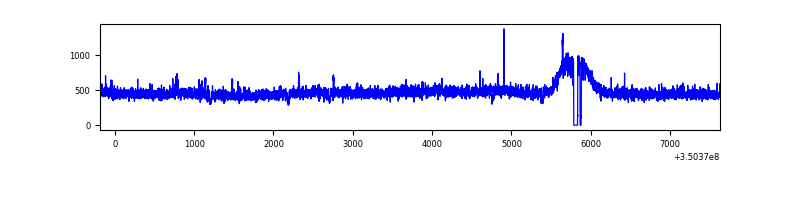 |
| B | 7813 | 7750 | 0 | 0 | 0.00% | 0.00% |  |
| C | 7813 | 7750 | 0 | 0 | 0.00% | 0.00% | 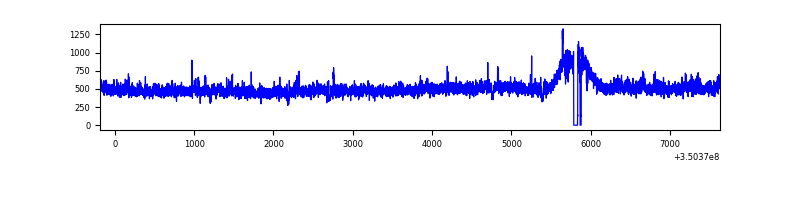 |
| D | 7813 | 7750 | 735 | 735 | 9.41% | 9.48% | 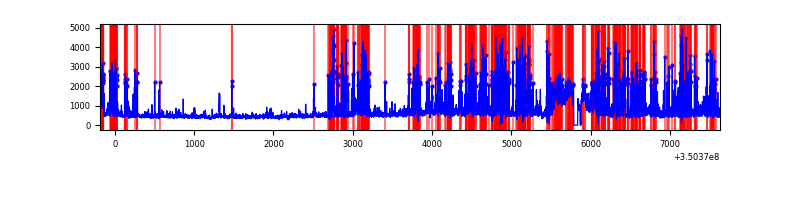 |
Top three noisy pixels from each quadrant. If the there are fewer than three noisy pixels in the level2.evt file, extra rows are filled as -1
| Pixel properties | Quadrant properties | ||||||
|---|---|---|---|---|---|---|---|
| Quadrant | DetID | PixID | Counts | Sigma | Mean | Median | Sigma |
| A | 15 | 192 | 20718 | 102.25 | 946 | 922 | 193.6 |
| A | 13 | 254 | 13715 | 66.08 | 946 | 922 | 193.6 |
| A | 3 | 137 | 9881 | 46.28 | 946 | 922 | 193.6 |
| B | 10 | 245 | 45588 | 243.63 | 942 | 915 | 183.4 |
| B | 12 | 111 | 23322 | 122.2 | 942 | 915 | 183.4 |
| B | 11 | 111 | 21257 | 110.94 | 942 | 915 | 183.4 |
| C | 3 | 233 | 213154 | 986.75 | 910 | 914 | 215.1 |
| C | 14 | 238 | 145199 | 670.81 | 910 | 914 | 215.1 |
| C | 2 | 114 | 18705 | 82.71 | 910 | 914 | 215.1 |
| D | 1 | 52 | 2085727 | 10107.78 | 856 | 832 | 206.3 |
| D | 13 | 104 | 600061 | 2905.12 | 856 | 832 | 206.3 |
| D | 8 | 195 | 555046 | 2686.88 | 856 | 832 | 206.3 |
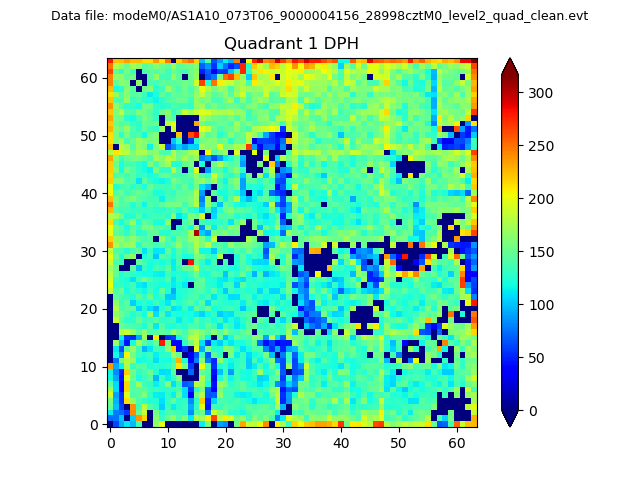
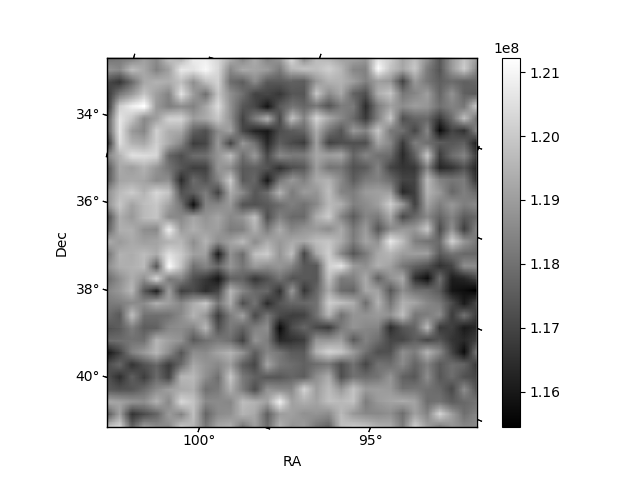
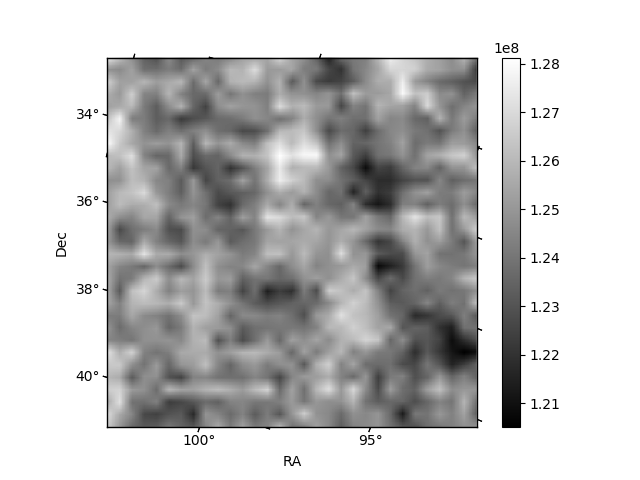
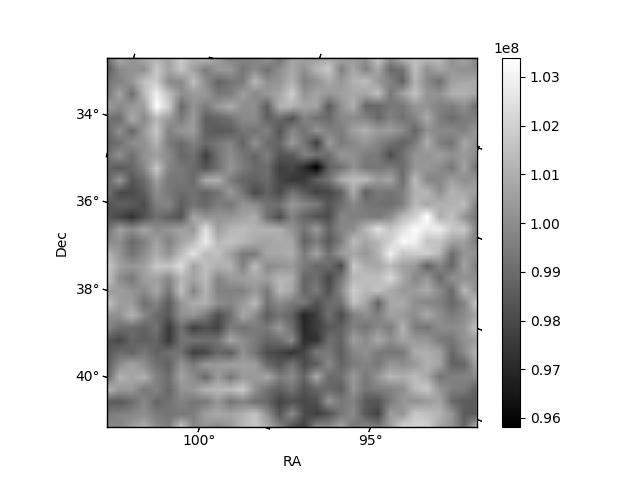
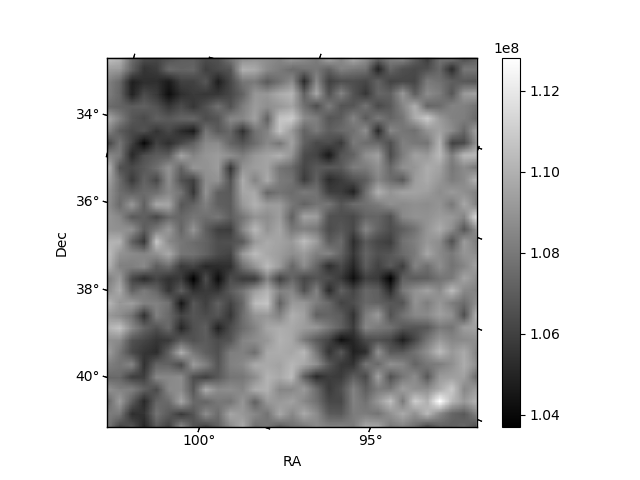
Histogram calculated using DETX and DETY for each event in the final _common_clean file
| Quadrant A | 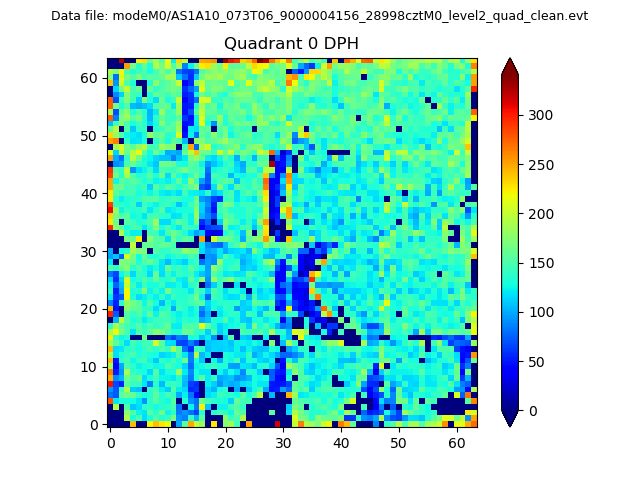 |
 |
Quadrant B |
|---|---|---|---|
| Quadrant D | 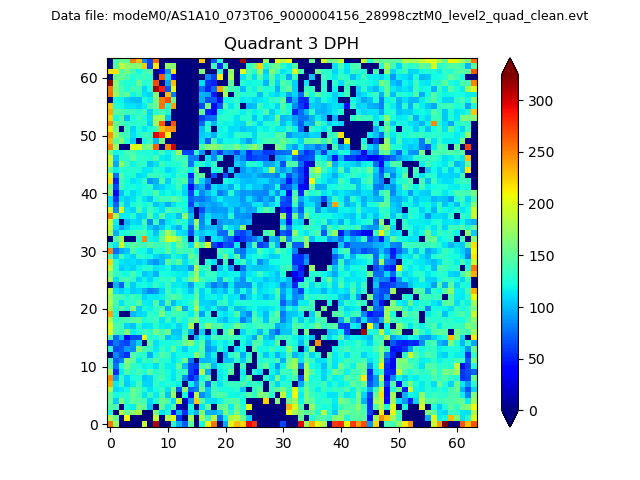 |
 |
Quadrant C |
| Plot type | Count rate plots | Images |
|---|---|---|
| Comparison with Poisson distribution Blue bars denote a histogram of data divided into 1 sec bins. Red curve is a Poisson curve with rate = median count rate of data. |
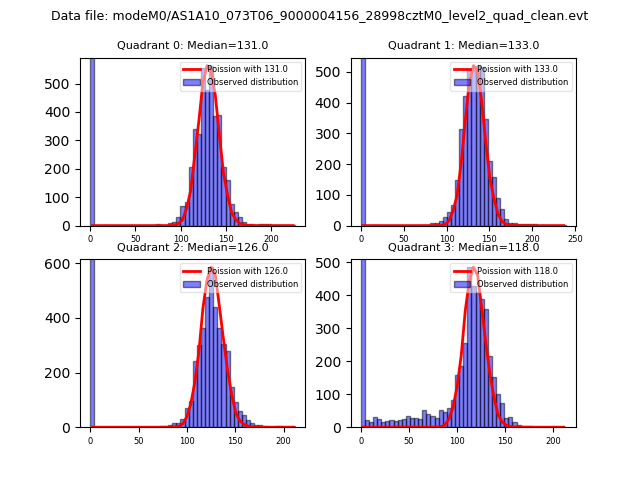 |
 |
| Quadrant-wise count rates Data is divided into 100 sec bins |
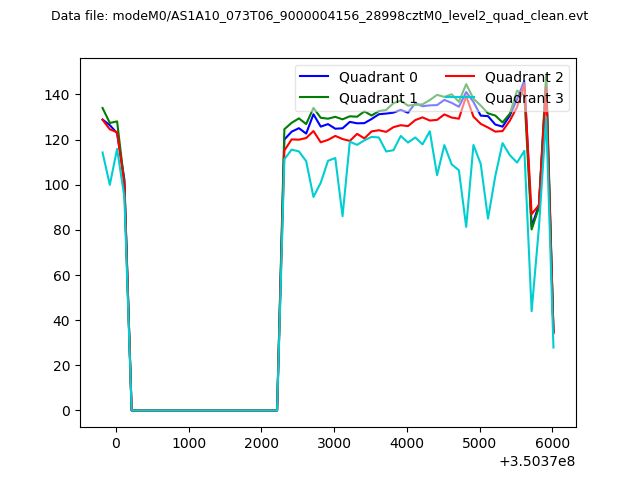 |
|
| Module-wise count rates for Quadrant A Data is divided into 100 sec bins |
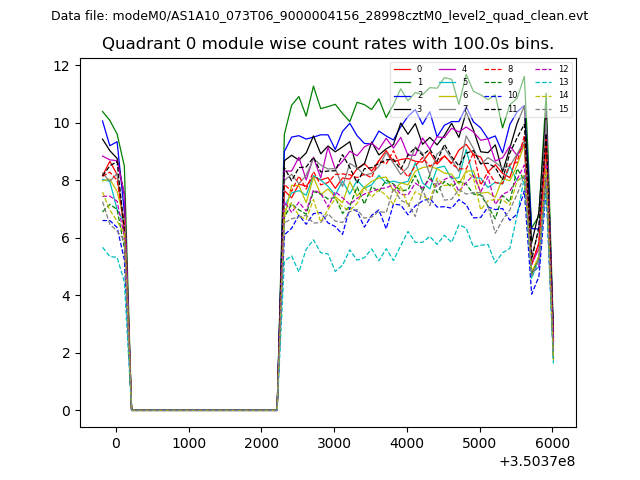 |
 |
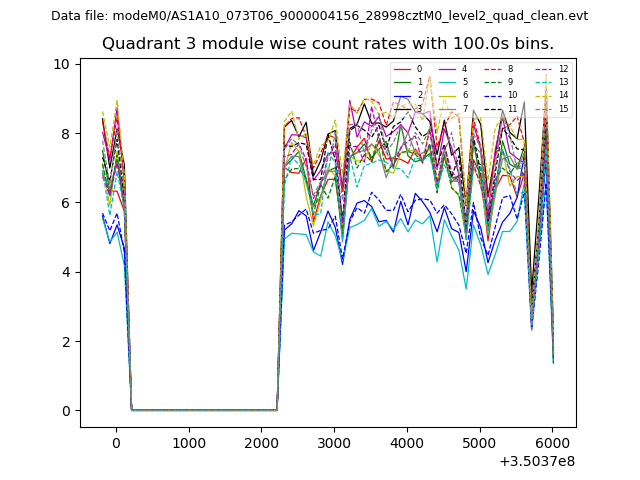
| Module-wise count rates for Quadrant B Data is divided into 100 sec bins |
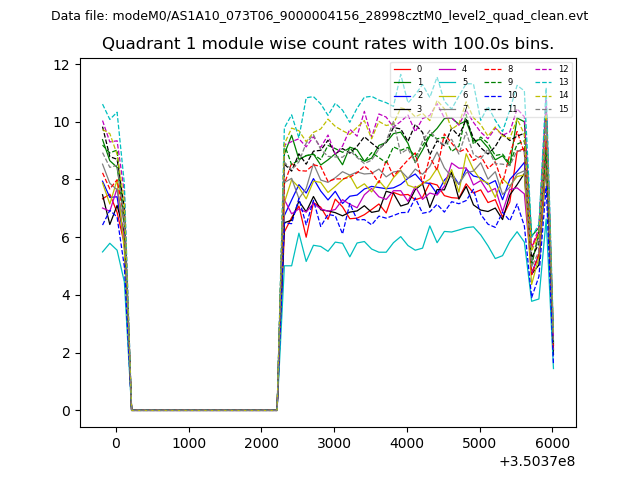 |
 |
| Module-wise count rates for Quadrant C Data is divided into 100 sec bins |
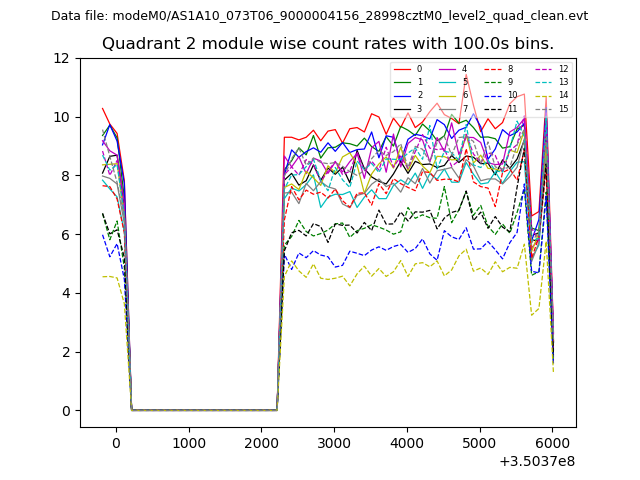 |
 |
| Module-wise count rates for Quadrant D Data is divided into 100 sec bins |
 |
 |
| Parameter | Plot |
|---|---|
| CZT HV Monitor | 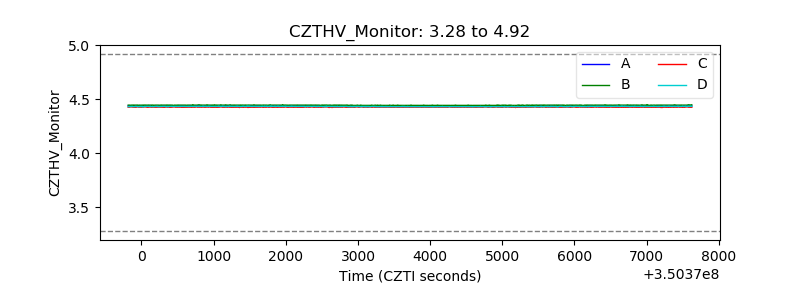 |
| D_VDD | 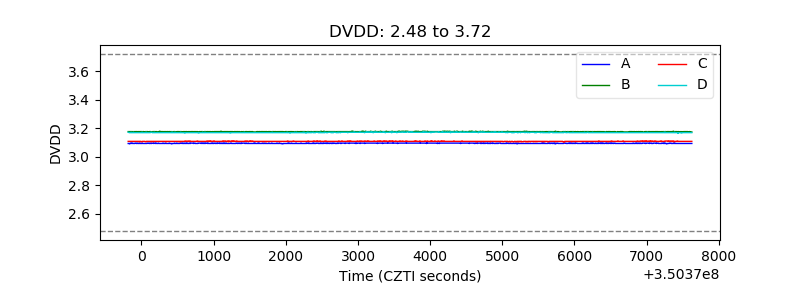 |
| Temperature 1 | 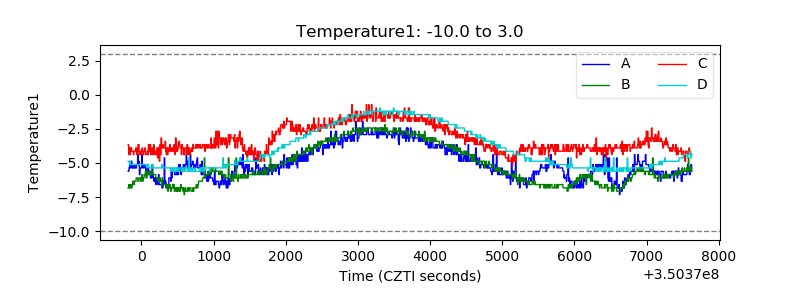 |
| Veto HV Monitor | 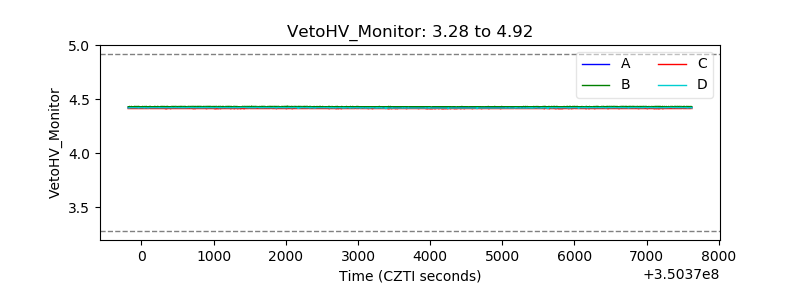 |
| Veto LLD | 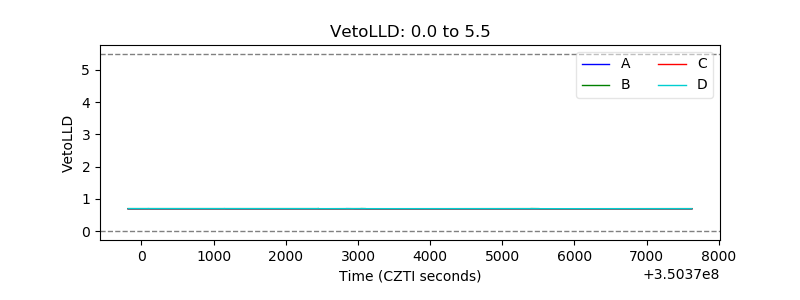 |
| Alpha Counter | 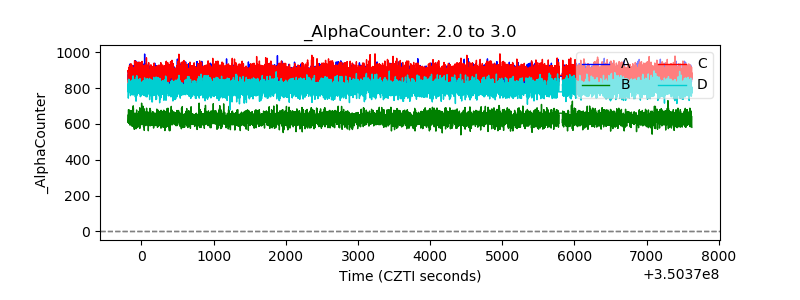 |
| _CPM_Rate | 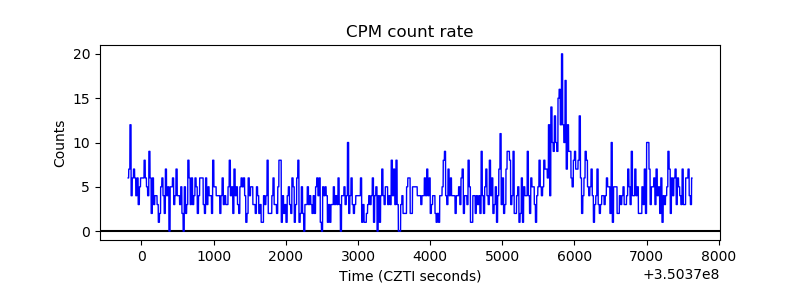 |
| CZT Counter | 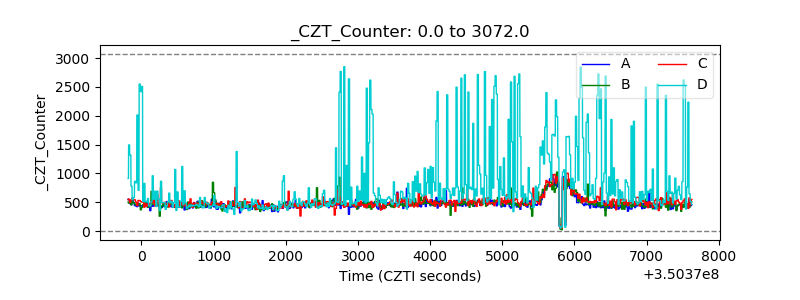 |
| +2.5 Volts monitor |  |
| +5 Volts monitor |  |
| _ROLL_ROT | 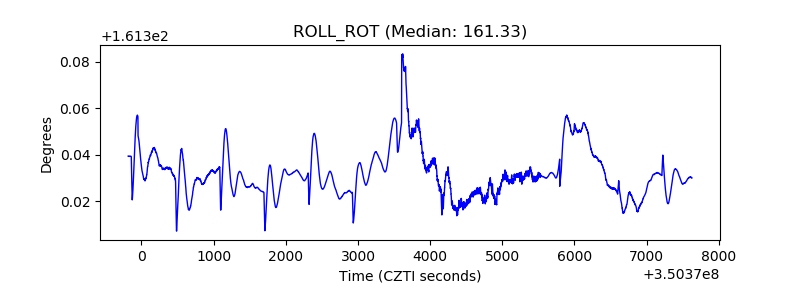 |
| _Roll_DEC | 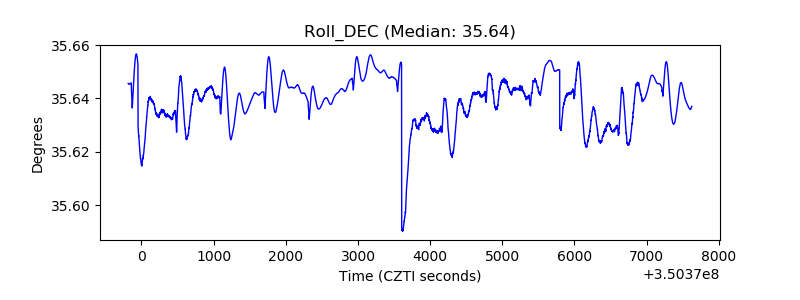 |
| _Roll_RA | 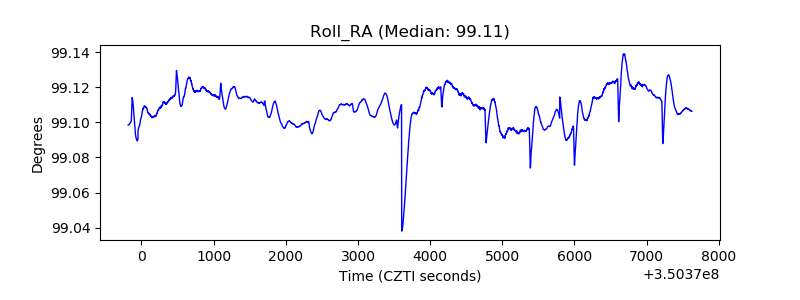 |
| Veto Counter | 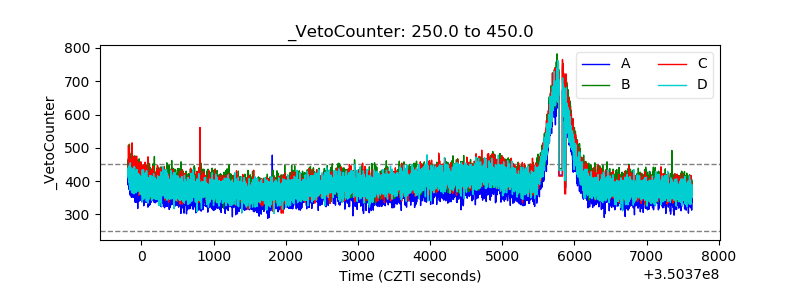 |