| Param | Original file | Final file |
|---|---|---|
| Filename | modeM0/AS1A10_073T06_9000004156_28999cztM0_level2.evt | modeM0/AS1A10_073T06_9000004156_28999cztM0_level2_quad_clean.evt |
| Size (bytes) | 691,513,920 | 78,390,720 |
| Size | 659.5 MB | 74.8 MB |
| Events in quadrant A | 3,569,664 | 492,214 |
| Events in quadrant B | 4,046,539 | 498,257 |
| Events in quadrant C | 4,214,449 | 473,023 |
| Events in quadrant D | 8,599,592 | 383,043 |
| Mode M9 | |||
|---|---|---|---|
| Quadrant | BADHDUFLAG | Total packets | Discarded packets |
| A | 0 | 3 | 0 |
| B | 0 | 3 | 0 |
| C | 0 | 3 | 0 |
| D | 0 | 3 | 0 |
| Mode SS | |||
|---|---|---|---|
| Quadrant | BADHDUFLAG | Total packets | Discarded packets |
| A | 0 | 154 | 0 |
| B | 0 | 154 | 0 |
| C | 0 | 154 | 0 |
| D | 0 | 154 | 0 |
| Mode M0 | |||
|---|---|---|---|
| Quadrant | BADHDUFLAG | Total packets | Discarded packets |
| A | 0 | 15523 | 2 |
| B | 0 | 16794 | 2 |
| C | 0 | 17213 | 2 |
| D | 0 | 30843 | 3 |
| Quadrant | Total seconds | Saturated seconds | Saturation percentage |
|---|---|---|---|
| A | 7567 | 134 | 1.770847% |
| B | 7567 | 209 | 2.761993% |
| C | 7567 | 184 | 2.431611% |
| D | 7566 | 1532 | 20.248480% |
Noise dominated data is calculated using 1-second bins in cleaned event files. If a bin has >2000 counts, and if more than 50% of those come from <1% of pixels, then it is considered to be noise-dominated and hence unusable.
| Quadrant | # 1 sec bins | Bins with >0 counts | Bins with >2000 counts | High rate bins dominated by noise | Noise dominated (total time) | Noise dominated (detector-on time) | Marked lightcurve |
|---|---|---|---|---|---|---|---|
| A | 7867 | 7568 | 0 | 0 | 0.00% | 0.00% | 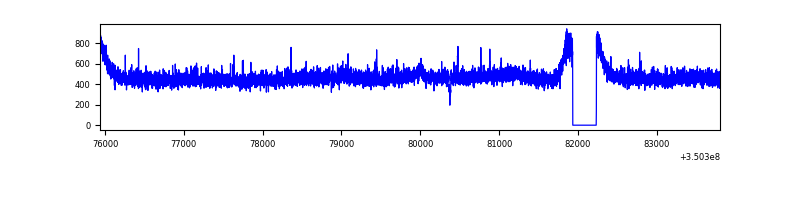 |
| B | 7867 | 7568 | 31 | 31 | 0.39% | 0.41% | 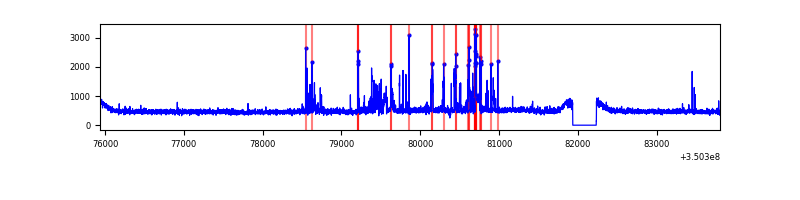 |
| C | 7867 | 7568 | 0 | 0 | 0.00% | 0.00% | 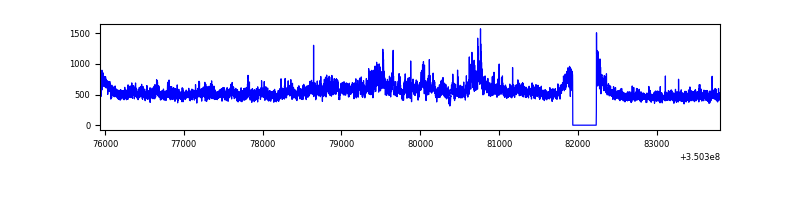 |
| D | 7866 | 7567 | 1101 | 1101 | 14.00% | 14.55% | 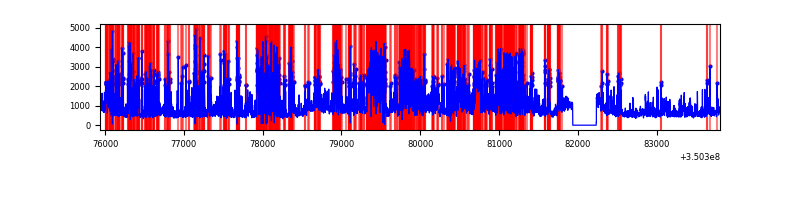 |
Top three noisy pixels from each quadrant. If the there are fewer than three noisy pixels in the level2.evt file, extra rows are filled as -1
| Pixel properties | Quadrant properties | ||||||
|---|---|---|---|---|---|---|---|
| Quadrant | DetID | PixID | Counts | Sigma | Mean | Median | Sigma |
| A | 6 | 16 | 20856 | 107.02 | 915 | 892 | 186.5 |
| A | 13 | 254 | 13144 | 65.68 | 915 | 892 | 186.5 |
| A | 15 | 192 | 11182 | 55.16 | 915 | 892 | 186.5 |
| B | 10 | 245 | 436490 | 2445.74 | 913 | 886 | 178.1 |
| B | 12 | 111 | 22656 | 122.23 | 913 | 886 | 178.1 |
| B | 11 | 111 | 20777 | 111.68 | 913 | 886 | 178.1 |
| C | 3 | 233 | 631235 | 3040.62 | 879 | 883 | 207.3 |
| C | 14 | 238 | 140737 | 674.61 | 879 | 883 | 207.3 |
| C | 2 | 114 | 17994 | 82.54 | 879 | 883 | 207.3 |
| D | 1 | 52 | 4469600 | 23325.74 | 794 | 770 | 191.6 |
| D | 8 | 195 | 407736 | 2124.22 | 794 | 770 | 191.6 |
| D | 7 | 80 | 285698 | 1487.22 | 794 | 770 | 191.6 |
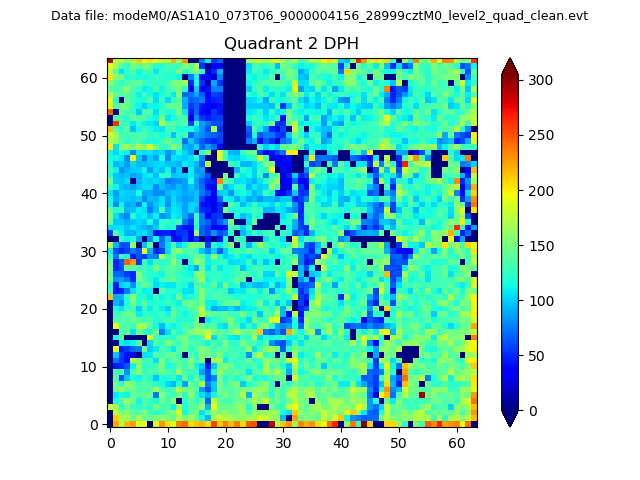
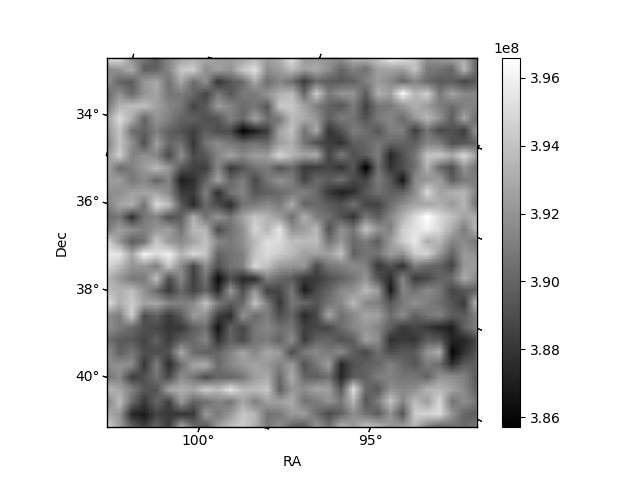
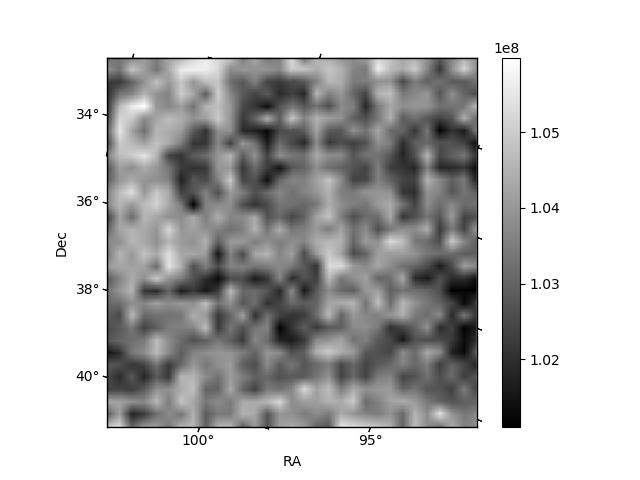
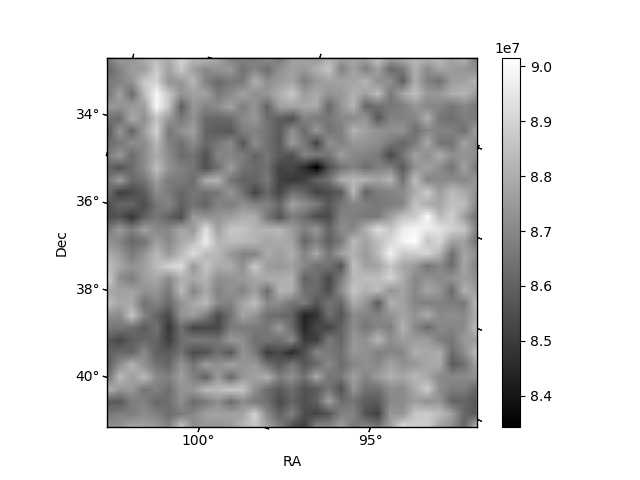
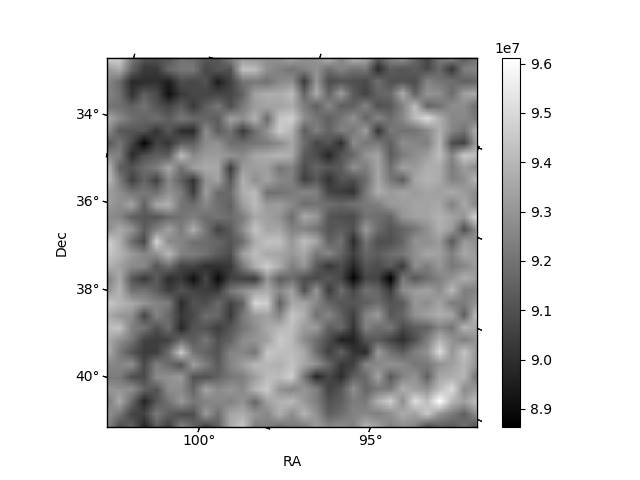
Histogram calculated using DETX and DETY for each event in the final _common_clean file
| Quadrant A | 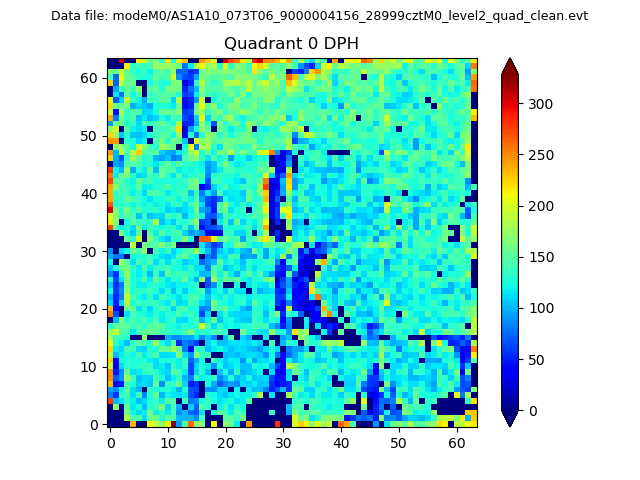 |
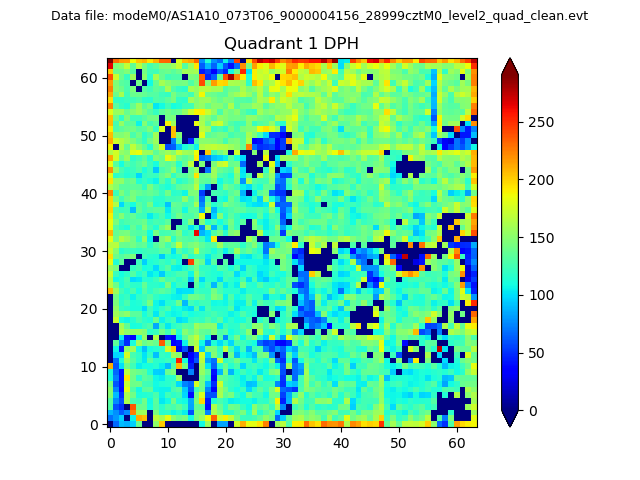 |
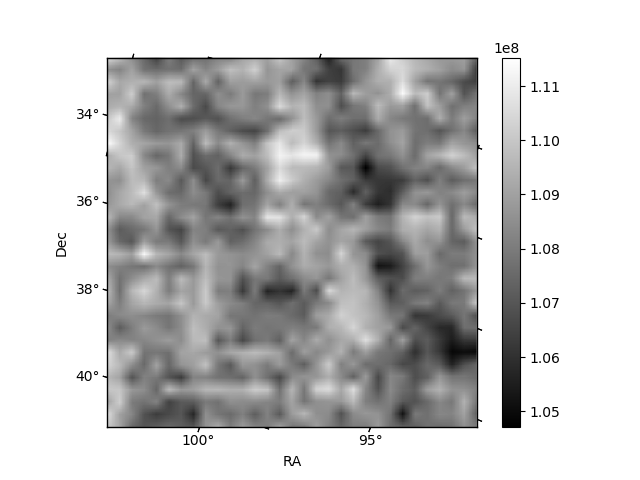
Quadrant B |
|---|---|---|---|
| Quadrant D | 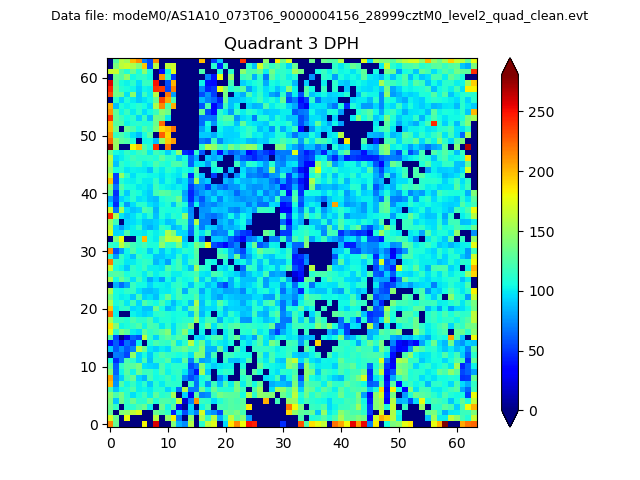 |
 |
Quadrant C |
| Plot type | Count rate plots | Images |
|---|---|---|
| Comparison with Poisson distribution Blue bars denote a histogram of data divided into 1 sec bins. Red curve is a Poisson curve with rate = median count rate of data. |
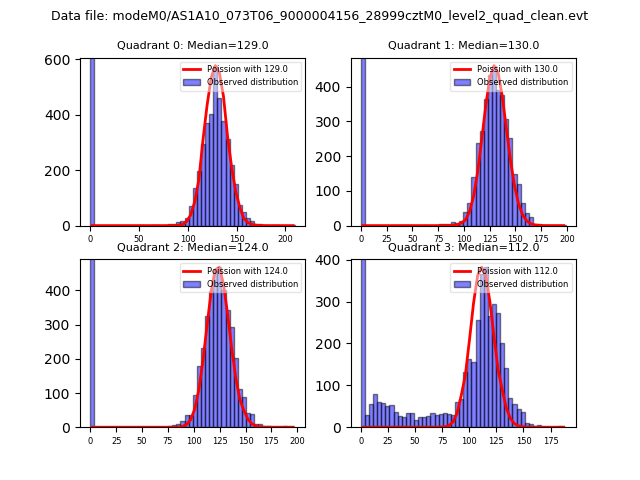 |
 |
| Quadrant-wise count rates Data is divided into 100 sec bins |
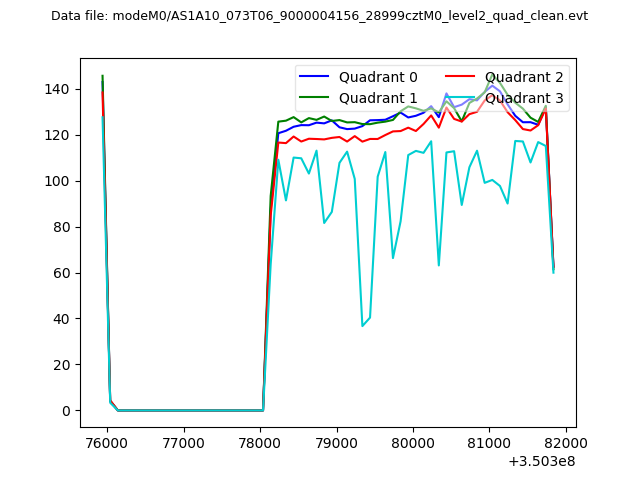 |
|
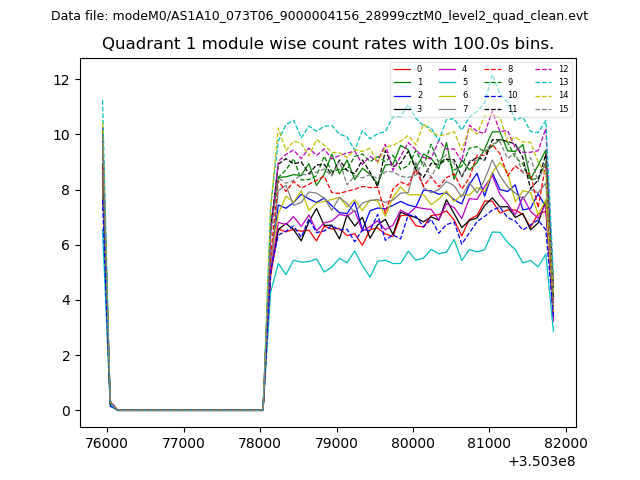
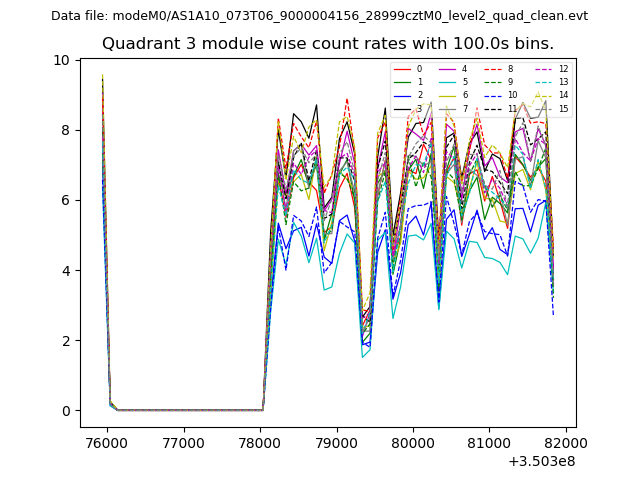
| Module-wise count rates for Quadrant A Data is divided into 100 sec bins |
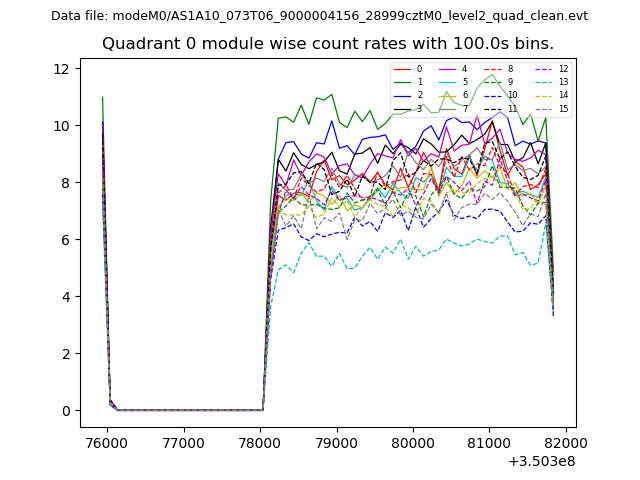 |
 |
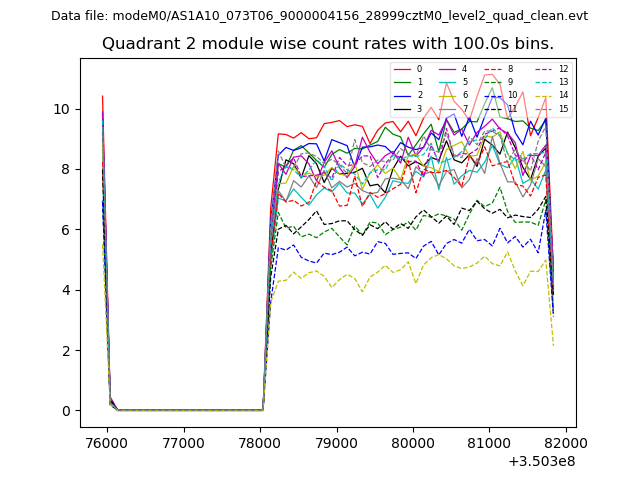
| Module-wise count rates for Quadrant B Data is divided into 100 sec bins |
 |
 |
| Module-wise count rates for Quadrant C Data is divided into 100 sec bins |
 |
 |
| Module-wise count rates for Quadrant D Data is divided into 100 sec bins |
 |
 |
| Parameter | Plot |
|---|---|
| CZT HV Monitor | 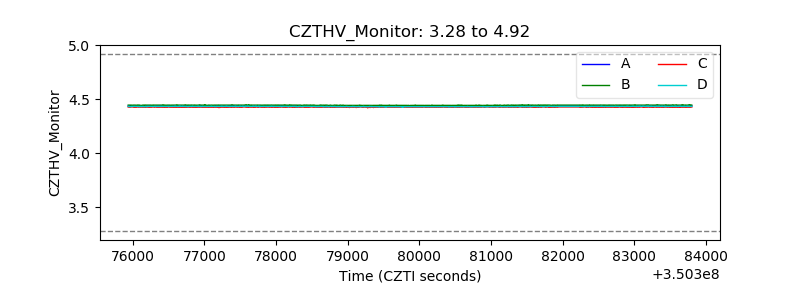 |
| D_VDD | 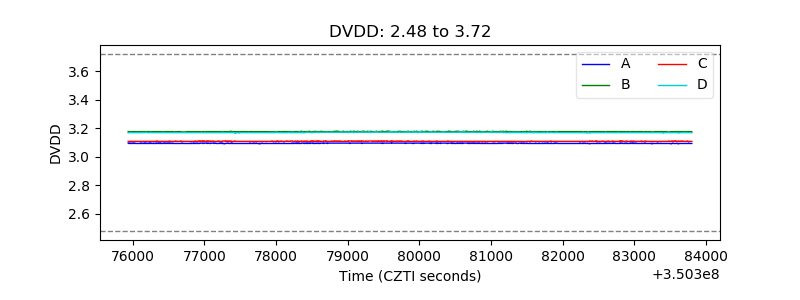 |
| Temperature 1 | 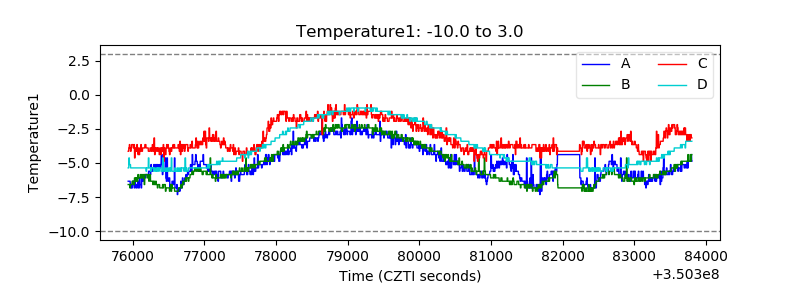 |
| Veto HV Monitor | 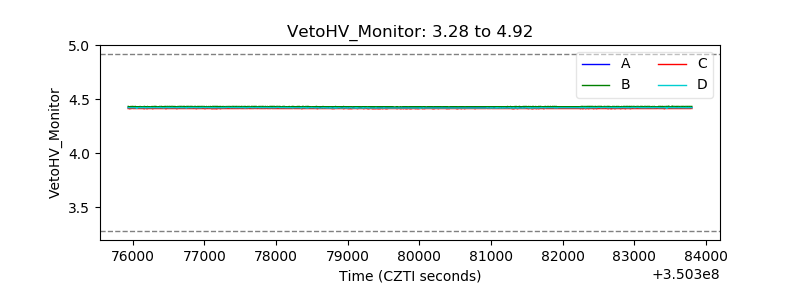 |
| Veto LLD | 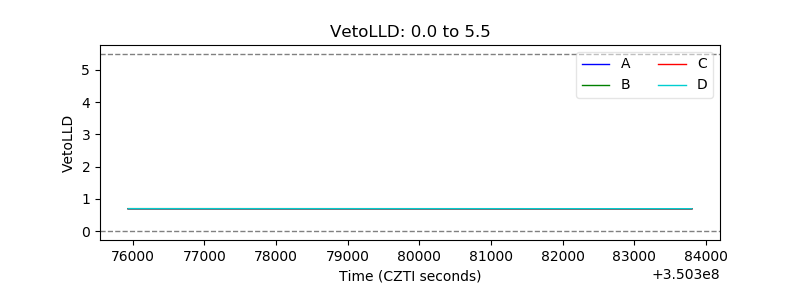 |
| Alpha Counter | 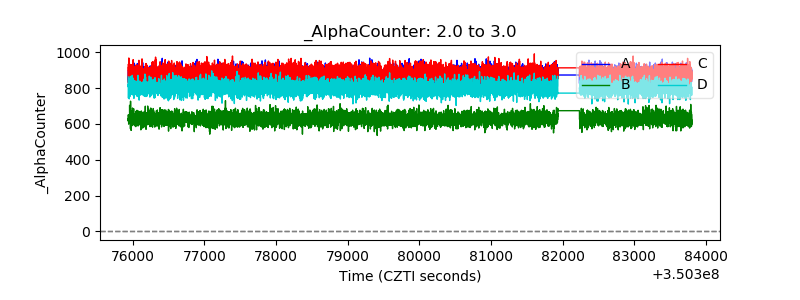 |
| _CPM_Rate | 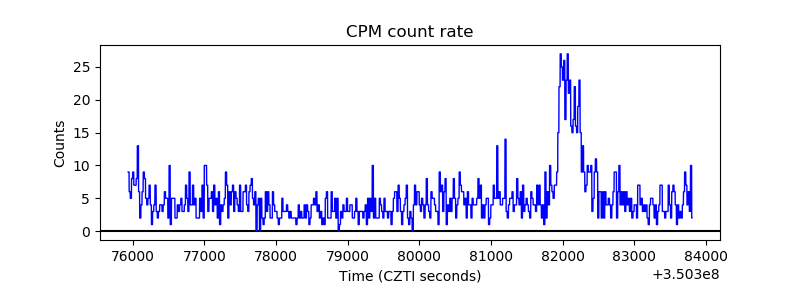 |
| CZT Counter | 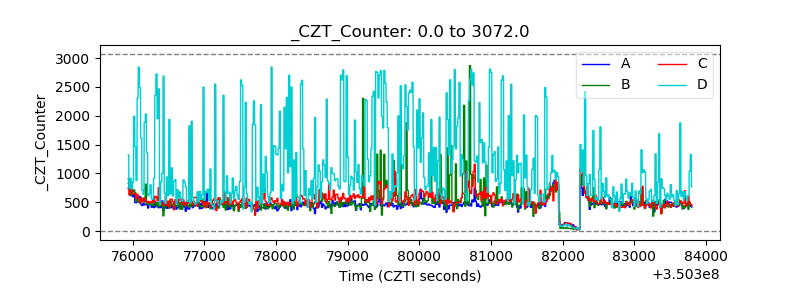 |
| +2.5 Volts monitor | 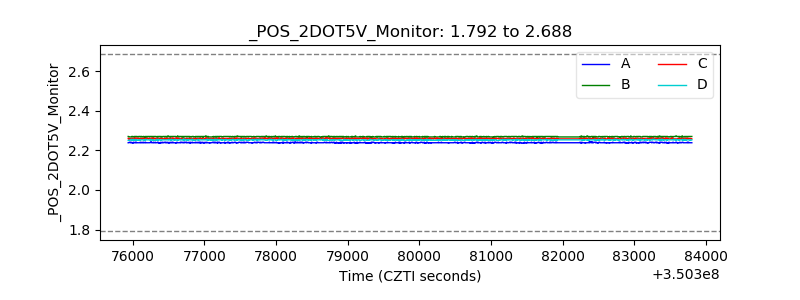 |
| +5 Volts monitor |  |
| _ROLL_ROT | 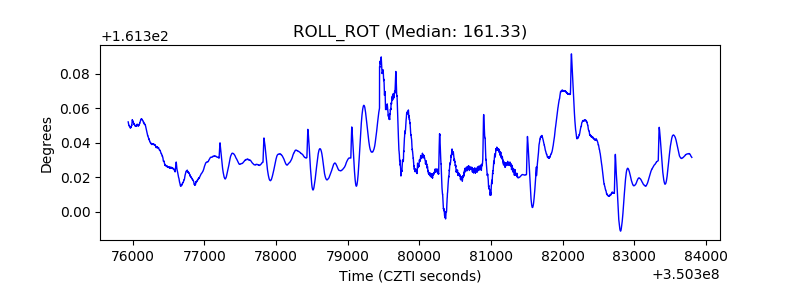 |
| _Roll_DEC | 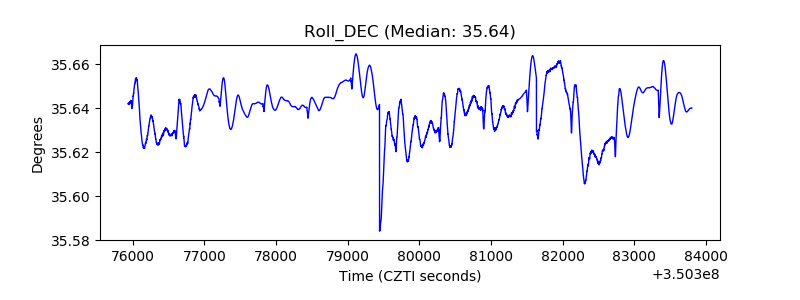 |
| _Roll_RA | 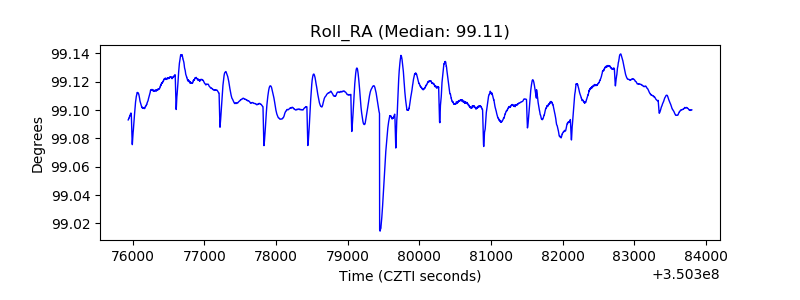 |
| Veto Counter | 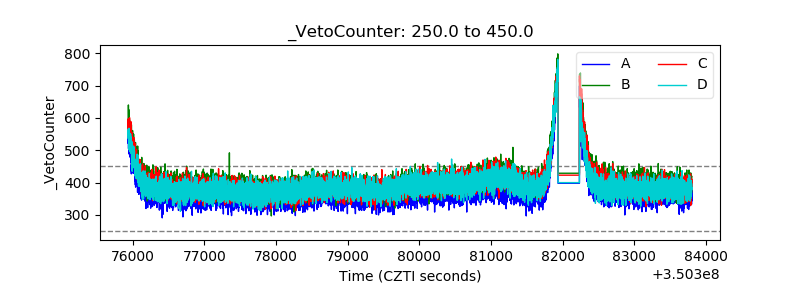 |