| Param | Original file | Final file |
|---|---|---|
| Filename | modeM0/AS1A10_073T06_9000004156_29001cztM0_level2.evt | modeM0/AS1A10_073T06_9000004156_29001cztM0_level2_quad_clean.evt |
| Size (bytes) | 768,303,360 | 101,701,440 |
| Size | 732.7 MB | 97.0 MB |
| Events in quadrant A | 4,069,212 | 649,628 |
| Events in quadrant B | 4,894,400 | 652,871 |
| Events in quadrant C | 4,400,327 | 626,063 |
| Events in quadrant D | 9,322,362 | 553,386 |
| Mode M9 | |||
|---|---|---|---|
| Quadrant | BADHDUFLAG | Total packets | Discarded packets |
| A | 0 | 8 | 0 |
| B | 0 | 8 | 0 |
| C | 0 | 8 | 0 |
| D | 0 | 8 | 0 |
| Mode SS | |||
|---|---|---|---|
| Quadrant | BADHDUFLAG | Total packets | Discarded packets |
| A | 0 | 176 | 0 |
| B | 0 | 176 | 0 |
| C | 0 | 176 | 0 |
| D | 0 | 176 | 0 |
| Mode M0 | |||
|---|---|---|---|
| Quadrant | BADHDUFLAG | Total packets | Discarded packets |
| A | 0 | 17678 | 2 |
| B | 0 | 19830 | 2 |
| C | 0 | 18137 | 2 |
| D | 0 | 33680 | 2 |
| Quadrant | Total seconds | Saturated seconds | Saturation percentage |
|---|---|---|---|
| A | 8604 | 176 | 2.045560% |
| B | 8604 | 448 | 5.206881% |
| C | 8604 | 245 | 2.847513% |
| D | 8604 | 1260 | 14.644351% |
Noise dominated data is calculated using 1-second bins in cleaned event files. If a bin has >2000 counts, and if more than 50% of those come from <1% of pixels, then it is considered to be noise-dominated and hence unusable.
| Quadrant | # 1 sec bins | Bins with >0 counts | Bins with >2000 counts | High rate bins dominated by noise | Noise dominated (total time) | Noise dominated (detector-on time) | Marked lightcurve |
|---|---|---|---|---|---|---|---|
| A | 9414 | 8606 | 0 | 0 | 0.00% | 0.00% | 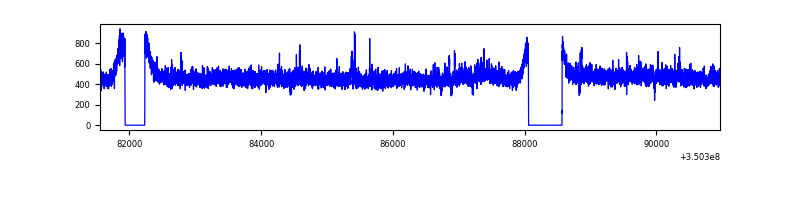 |
| B | 9414 | 8606 | 190 | 190 | 2.02% | 2.21% | 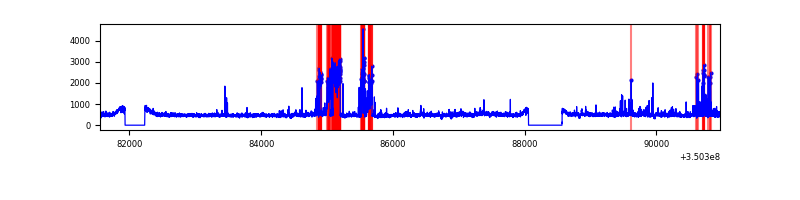 |
| C | 9414 | 8606 | 0 | 0 | 0.00% | 0.00% | 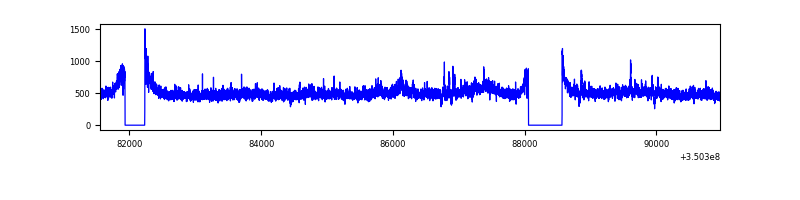 |
| D | 9414 | 8606 | 1011 | 1011 | 10.74% | 11.75% | 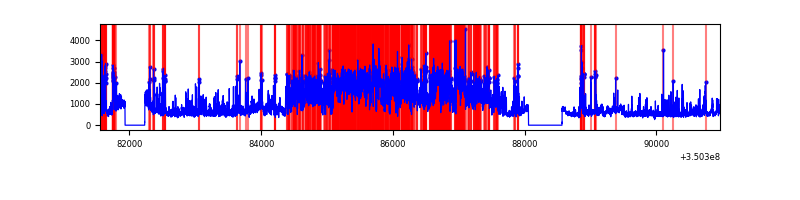 |
Top three noisy pixels from each quadrant. If the there are fewer than three noisy pixels in the level2.evt file, extra rows are filled as -1
| Pixel properties | Quadrant properties | ||||||
|---|---|---|---|---|---|---|---|
| Quadrant | DetID | PixID | Counts | Sigma | Mean | Median | Sigma |
| A | 13 | 254 | 15232 | 66.42 | 1046 | 1020 | 214.0 |
| A | 12 | 16 | 11600 | 49.45 | 1046 | 1020 | 214.0 |
| A | 12 | 210 | 11270 | 47.91 | 1046 | 1020 | 214.0 |
| B | 10 | 245 | 723879 | 3591.82 | 1033 | 1003 | 201.3 |
| B | 10 | 246 | 57405 | 280.25 | 1033 | 1003 | 201.3 |
| B | 15 | 32 | 38870 | 188.15 | 1033 | 1003 | 201.3 |
| C | 3 | 233 | 317232 | 1345.8 | 1000 | 1005 | 235.0 |
| C | 14 | 238 | 160677 | 679.53 | 1000 | 1005 | 235.0 |
| C | 2 | 114 | 20292 | 82.08 | 1000 | 1005 | 235.0 |
| D | 1 | 52 | 4596754 | 19687.36 | 970 | 940 | 233.4 |
| D | 8 | 195 | 633850 | 2711.23 | 970 | 940 | 233.4 |
| D | 13 | 104 | 199873 | 852.18 | 970 | 940 | 233.4 |
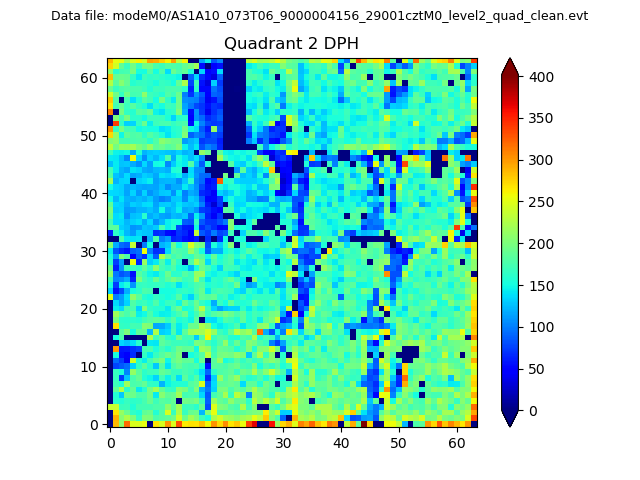
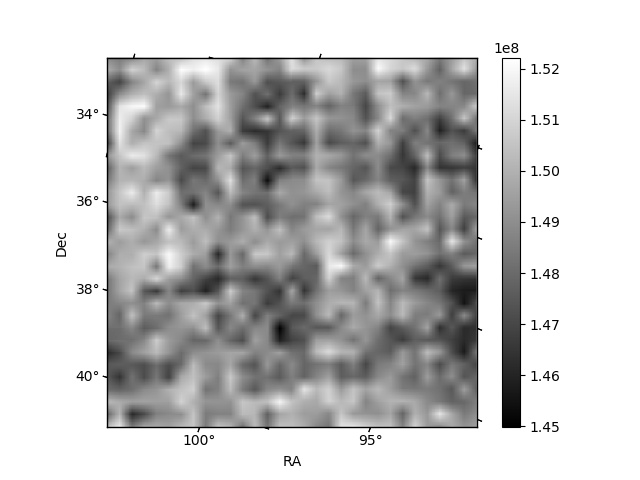
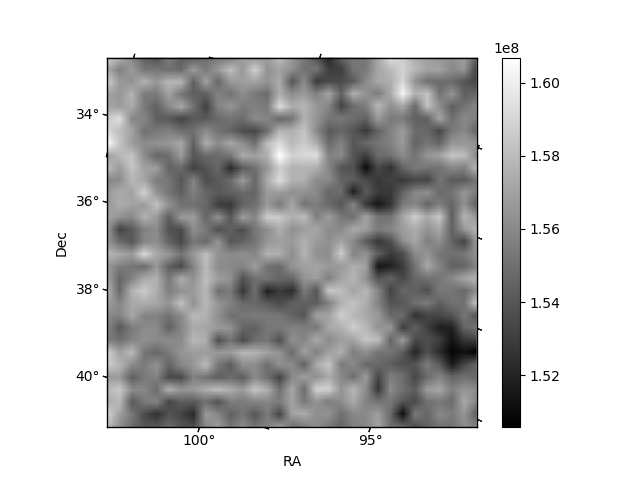
Histogram calculated using DETX and DETY for each event in the final _common_clean file
| Quadrant A |  |
 |
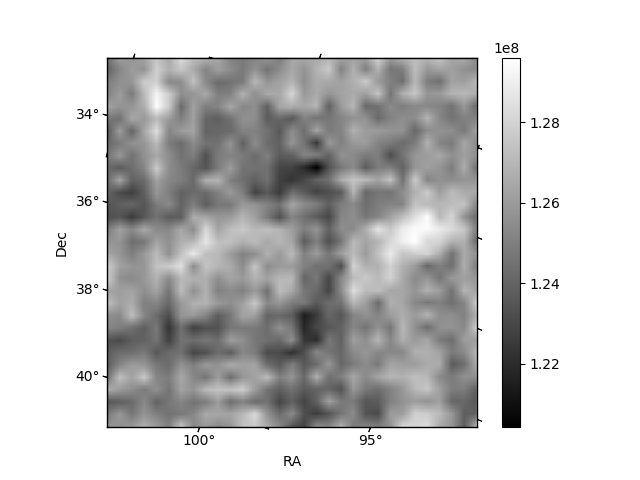
Quadrant B |
|---|---|---|---|
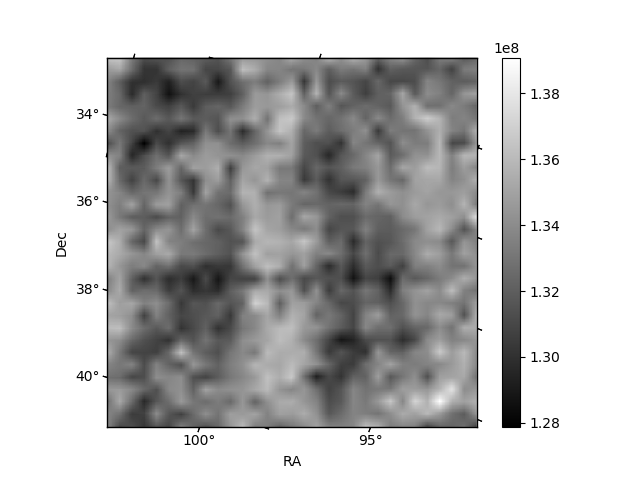
| Quadrant D | 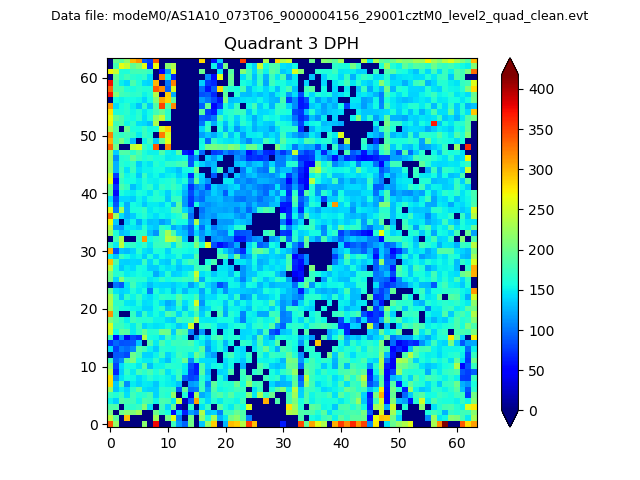 |
 |
Quadrant C |
| Plot type | Count rate plots | Images |
|---|---|---|
| Comparison with Poisson distribution Blue bars denote a histogram of data divided into 1 sec bins. Red curve is a Poisson curve with rate = median count rate of data. |
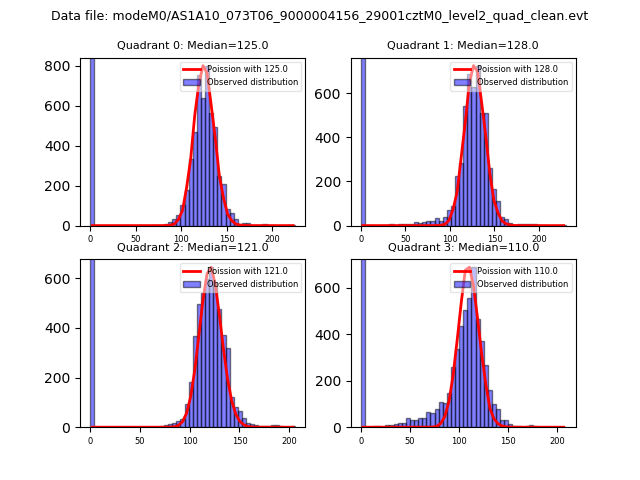 |
 |
| Quadrant-wise count rates Data is divided into 100 sec bins |
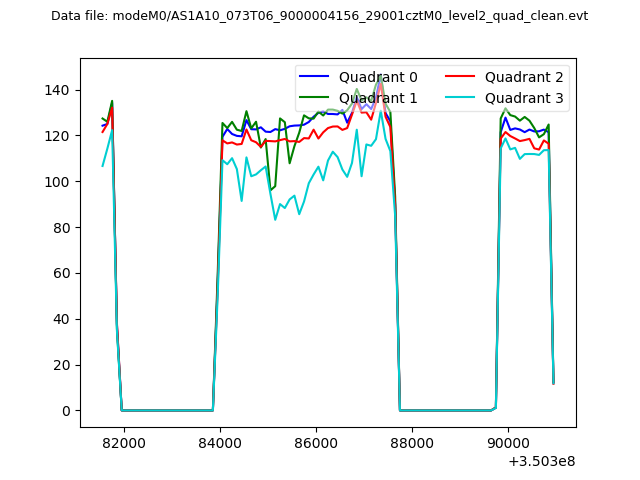 |
|
| Module-wise count rates for Quadrant A Data is divided into 100 sec bins |
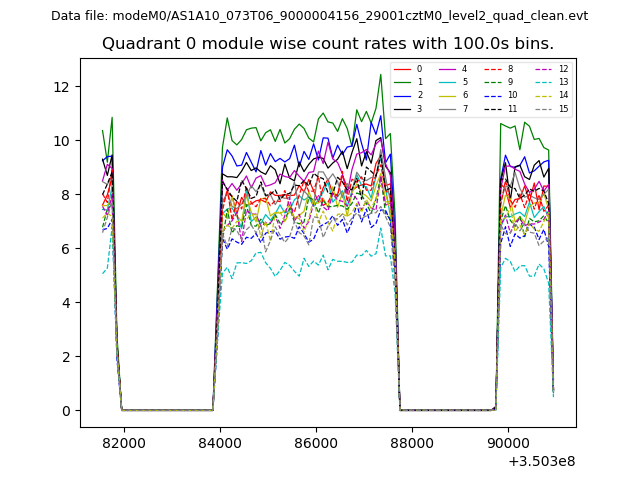 |
 |
| Module-wise count rates for Quadrant B Data is divided into 100 sec bins |
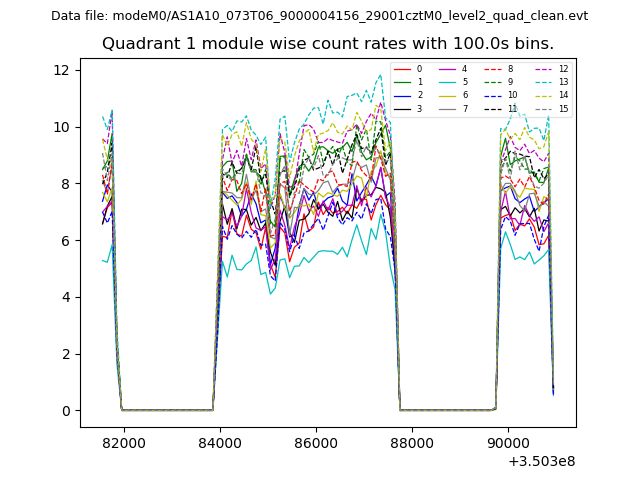 |
 |
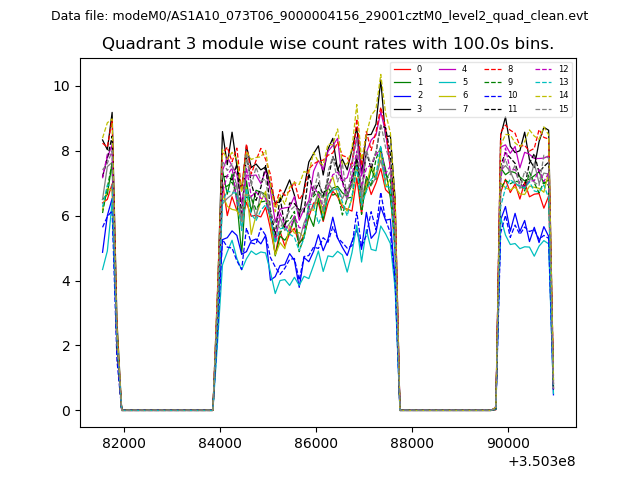
| Module-wise count rates for Quadrant C Data is divided into 100 sec bins |
 |
 |
| Module-wise count rates for Quadrant D Data is divided into 100 sec bins |
 |
 |
| Parameter | Plot |
|---|---|
| CZT HV Monitor |  |
| D_VDD | 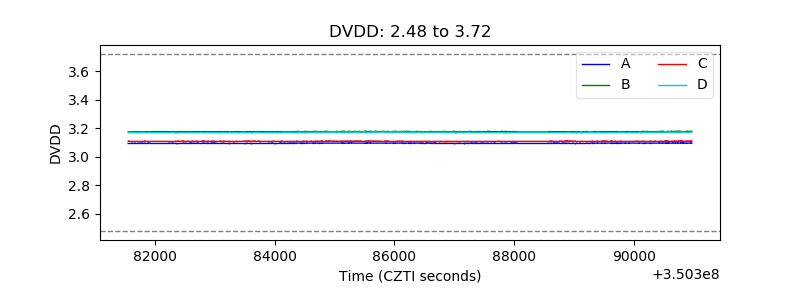 |
| Temperature 1 | 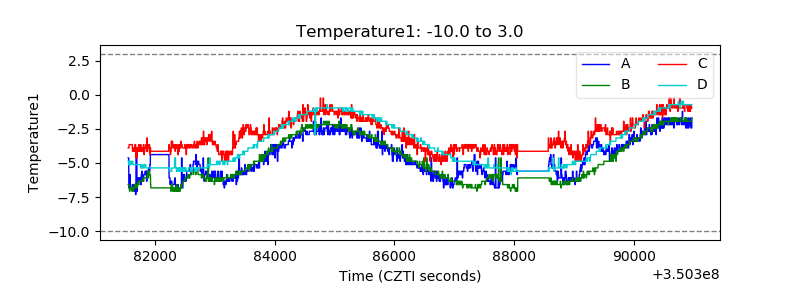 |
| Veto HV Monitor | 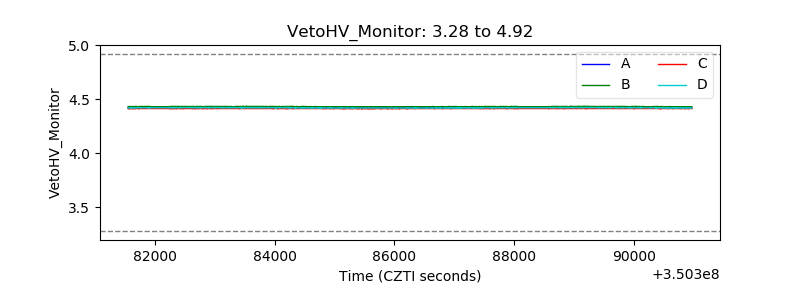 |
| Veto LLD | 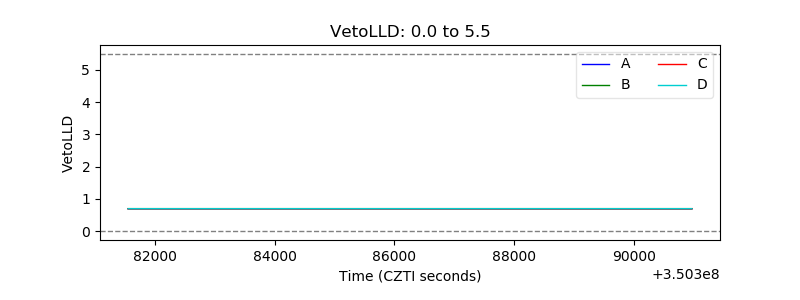 |
| Alpha Counter | 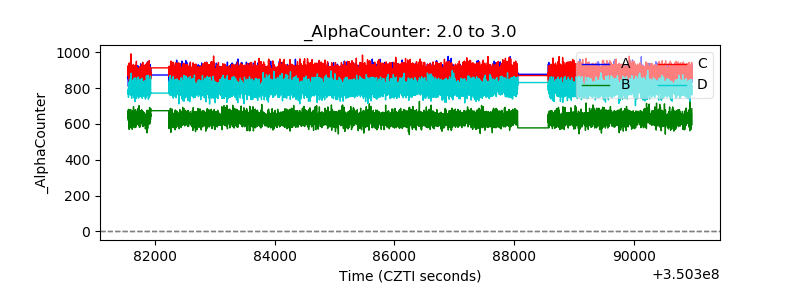 |
| _CPM_Rate | 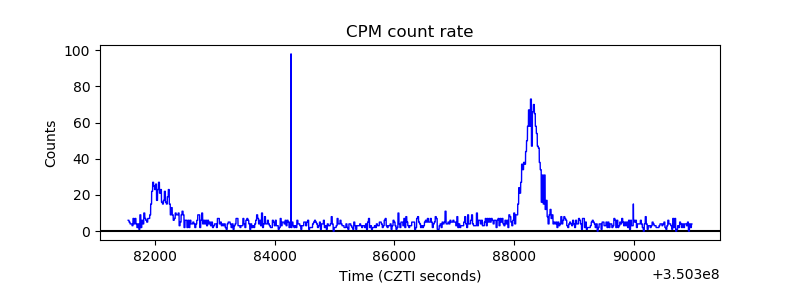 |
| CZT Counter | 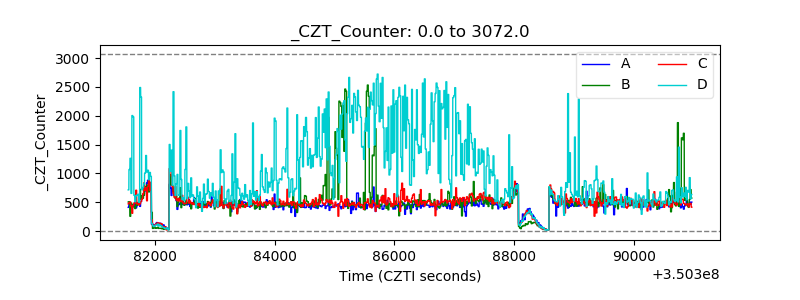 |
| +2.5 Volts monitor |  |
| +5 Volts monitor | 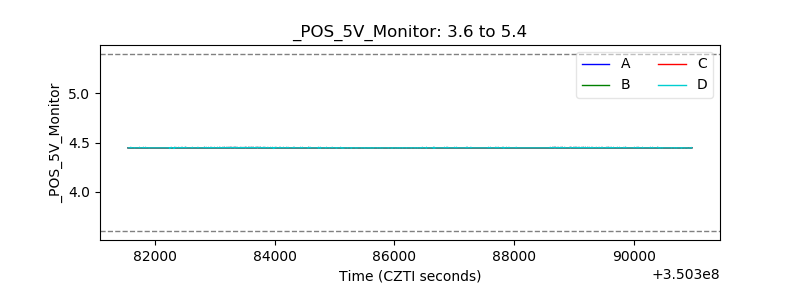 |
| _ROLL_ROT | 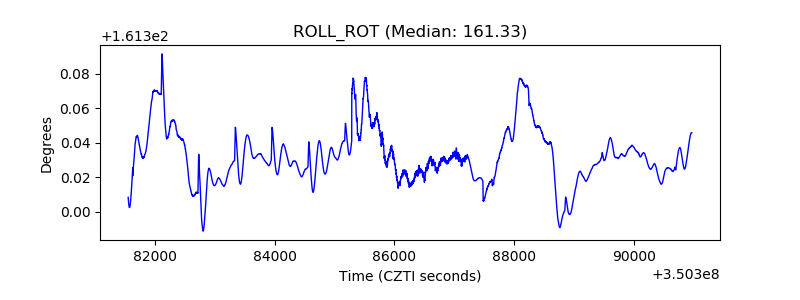 |
| _Roll_DEC | 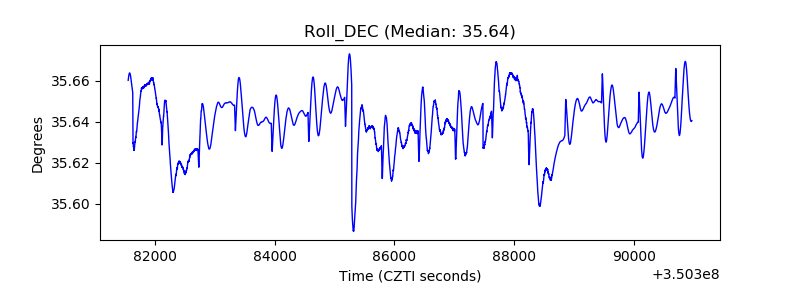 |
| _Roll_RA | 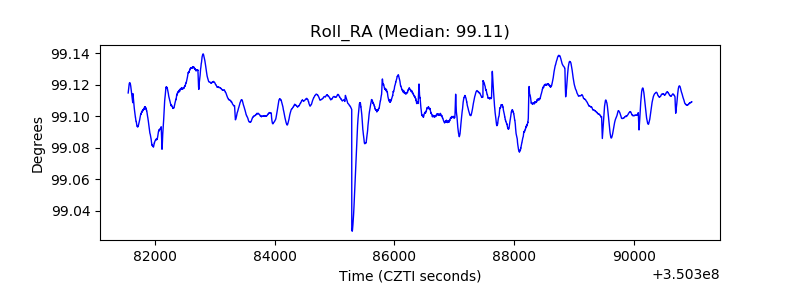 |
| Veto Counter | 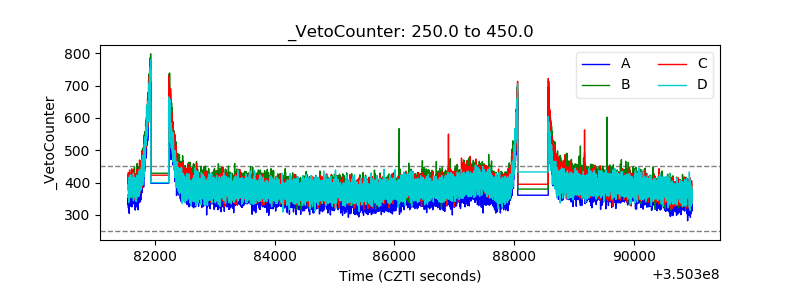 |