| Param | Original file | Final file |
|---|---|---|
| Filename | modeM0/AS1A10_073T06_9000004156_29002cztM0_level2.evt | modeM0/AS1A10_073T06_9000004156_29002cztM0_level2_quad_clean.evt |
| Size (bytes) | 575,890,560 | 100,702,080 |
| Size | 549.2 MB | 96.0 MB |
| Events in quadrant A | 3,185,325 | 668,740 |
| Events in quadrant B | 3,906,545 | 674,115 |
| Events in quadrant C | 4,053,828 | 636,478 |
| Events in quadrant D | 5,834,986 | 596,936 |
| Mode M9 | |||
|---|---|---|---|
| Quadrant | BADHDUFLAG | Total packets | Discarded packets |
| A | 0 | 7 | 0 |
| B | 0 | 7 | 0 |
| C | 0 | 7 | 0 |
| D | 0 | 7 | 0 |
| Mode SS | |||
|---|---|---|---|
| Quadrant | BADHDUFLAG | Total packets | Discarded packets |
| A | 0 | 138 | 0 |
| B | 0 | 138 | 0 |
| C | 0 | 138 | 0 |
| D | 0 | 138 | 0 |
| Mode M0 | |||
|---|---|---|---|
| Quadrant | BADHDUFLAG | Total packets | Discarded packets |
| A | 0 | 13847 | 1 |
| B | 0 | 15834 | 1 |
| C | 0 | 16669 | 1 |
| D | 0 | 21919 | 1 |
| Quadrant | Total seconds | Saturated seconds | Saturation percentage |
|---|---|---|---|
| A | 6790 | 63 | 0.927835% |
| B | 6790 | 261 | 3.843888% |
| C | 6791 | 125 | 1.840671% |
| D | 6791 | 479 | 7.053453% |
Noise dominated data is calculated using 1-second bins in cleaned event files. If a bin has >2000 counts, and if more than 50% of those come from <1% of pixels, then it is considered to be noise-dominated and hence unusable.
| Quadrant | # 1 sec bins | Bins with >0 counts | Bins with >2000 counts | High rate bins dominated by noise | Noise dominated (total time) | Noise dominated (detector-on time) | Marked lightcurve |
|---|---|---|---|---|---|---|---|
| A | 7475 | 6791 | 0 | 0 | 0.00% | 0.00% | 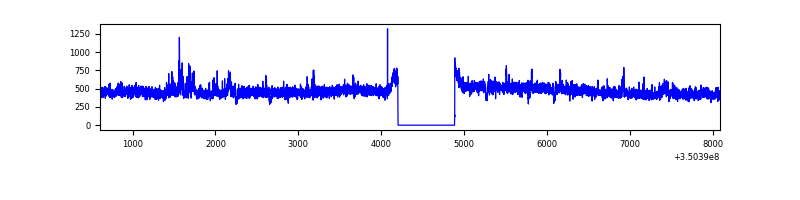 |
| B | 7475 | 6791 | 147 | 147 | 1.97% | 2.16% | 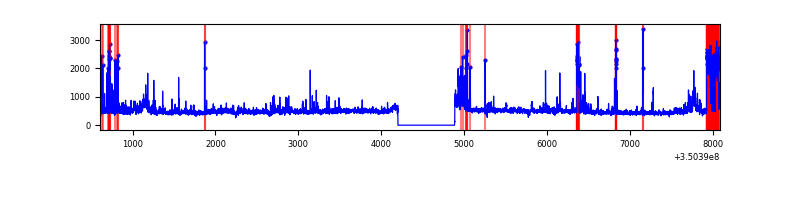 |
| C | 7476 | 6792 | 0 | 0 | 0.00% | 0.00% | 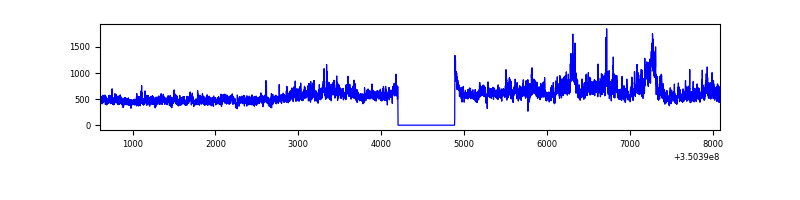 |
| D | 7476 | 6792 | 403 | 403 | 5.39% | 5.93% | 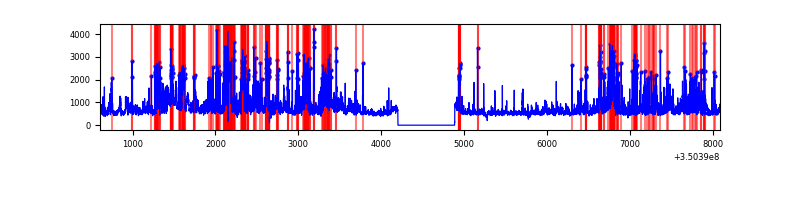 |
Top three noisy pixels from each quadrant. If the there are fewer than three noisy pixels in the level2.evt file, extra rows are filled as -1
| Pixel properties | Quadrant properties | ||||||
|---|---|---|---|---|---|---|---|
| Quadrant | DetID | PixID | Counts | Sigma | Mean | Median | Sigma |
| A | 12 | 16 | 44631 | 269.05 | 801 | 783 | 163.0 |
| A | 12 | 210 | 22845 | 135.37 | 801 | 783 | 163.0 |
| A | 12 | 194 | 13913 | 80.57 | 801 | 783 | 163.0 |
| B | 10 | 245 | 559526 | 3691.62 | 789 | 769 | 151.4 |
| B | 10 | 246 | 215903 | 1421.36 | 789 | 769 | 151.4 |
| B | 12 | 111 | 18781 | 119.0 | 789 | 769 | 151.4 |
| C | 3 | 233 | 936306 | 5213.13 | 764 | 768 | 179.5 |
| C | 14 | 238 | 123135 | 681.87 | 764 | 768 | 179.5 |
| C | 2 | 114 | 15966 | 84.69 | 764 | 768 | 179.5 |
| D | 1 | 52 | 1562279 | 8562.49 | 758 | 735 | 182.4 |
| D | 8 | 195 | 792887 | 4343.64 | 758 | 735 | 182.4 |
| D | 7 | 80 | 329088 | 1800.47 | 758 | 735 | 182.4 |
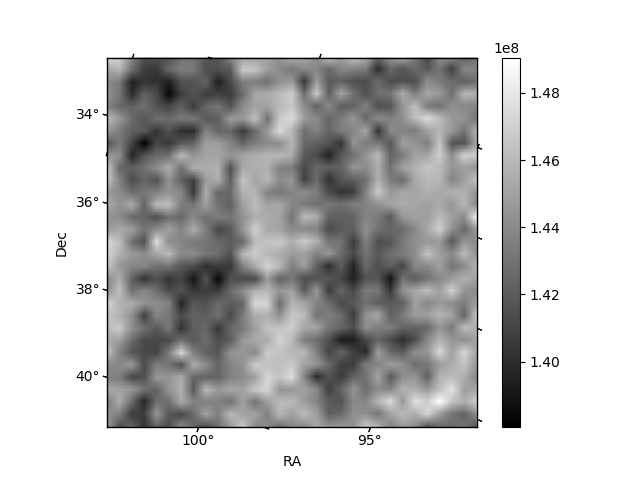
Histogram calculated using DETX and DETY for each event in the final _common_clean file
| Quadrant A | 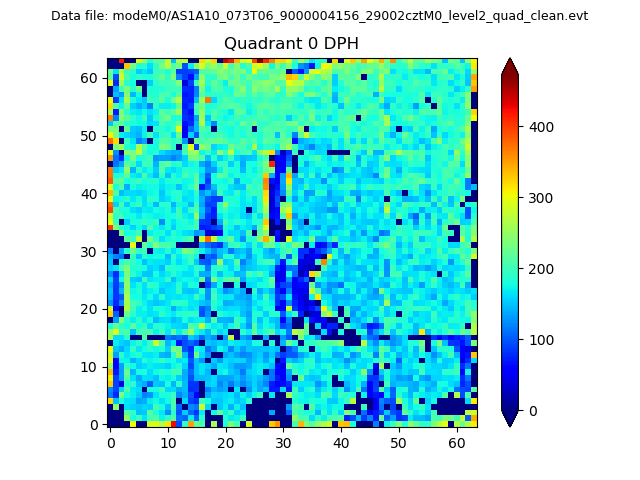 |
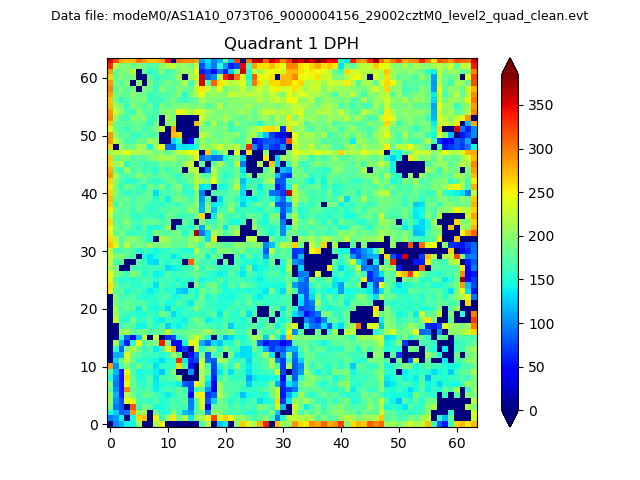 |
Quadrant B |
|---|---|---|---|
| Quadrant D |  |
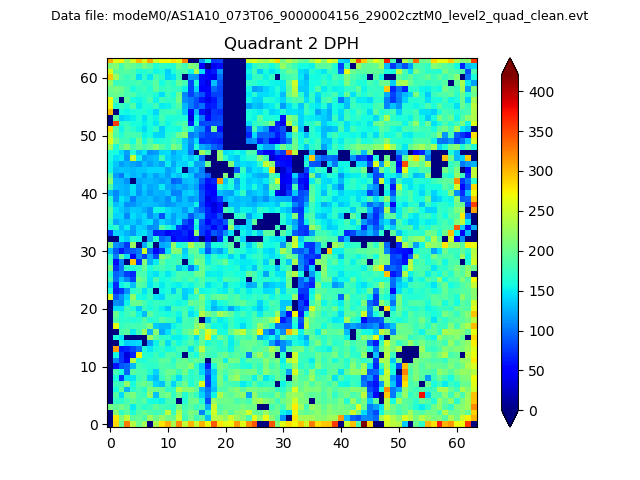 |
Quadrant C |
| Plot type | Count rate plots | Images |
|---|---|---|
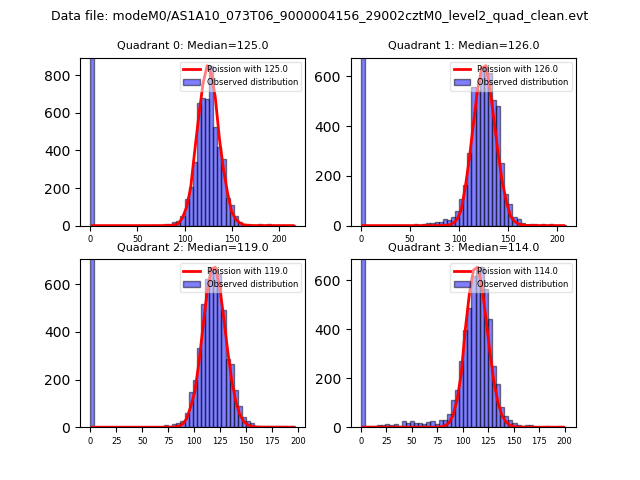
| Comparison with Poisson distribution Blue bars denote a histogram of data divided into 1 sec bins. Red curve is a Poisson curve with rate = median count rate of data. |
 |
 |
| Quadrant-wise count rates Data is divided into 100 sec bins |
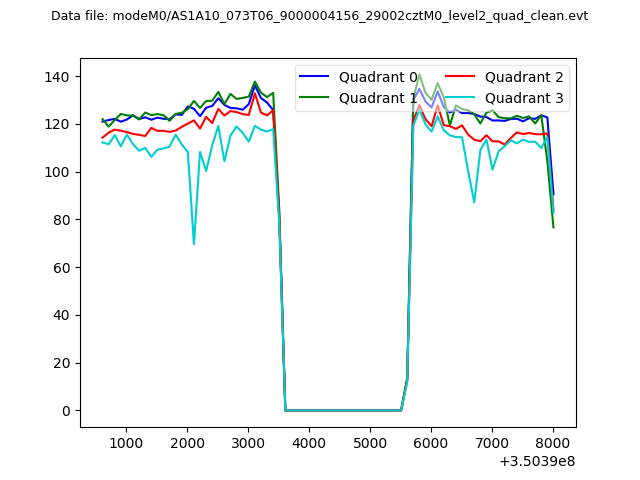 |
|
| Module-wise count rates for Quadrant A Data is divided into 100 sec bins |
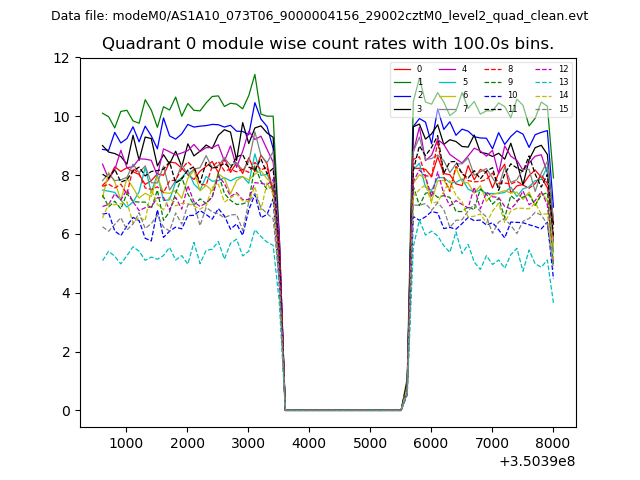 |
 |
| Module-wise count rates for Quadrant B Data is divided into 100 sec bins |
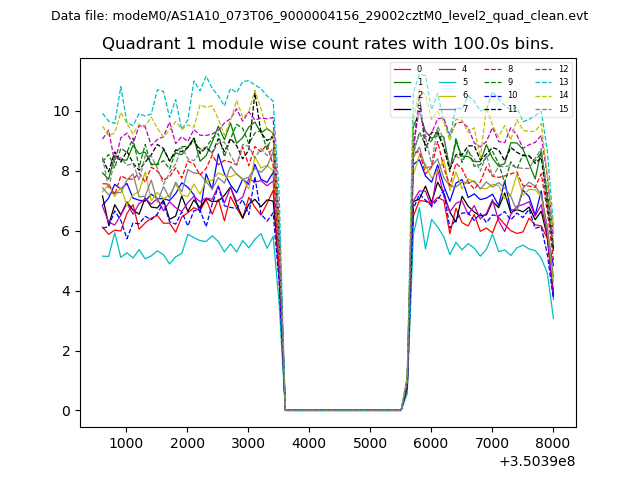 |
 |
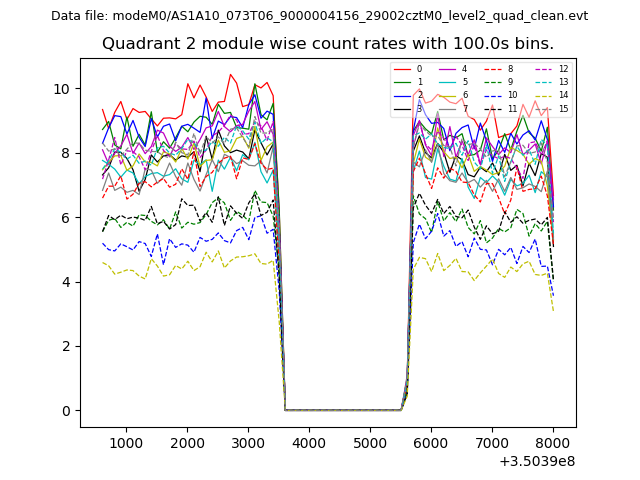
| Module-wise count rates for Quadrant C Data is divided into 100 sec bins |
 |
 |
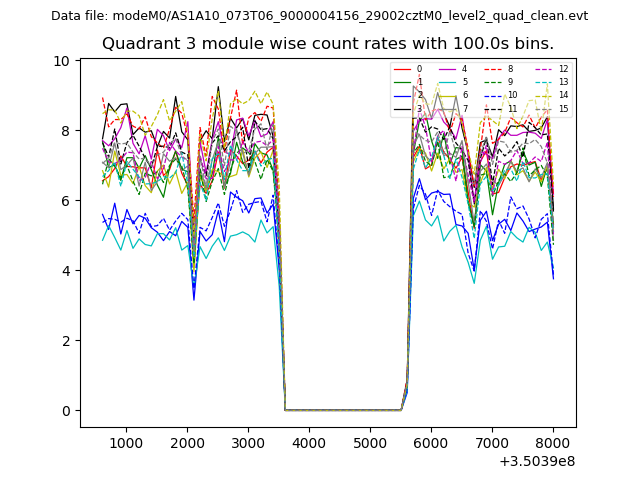
| Module-wise count rates for Quadrant D Data is divided into 100 sec bins |
 |
 |
| Parameter | Plot |
|---|---|
| CZT HV Monitor | 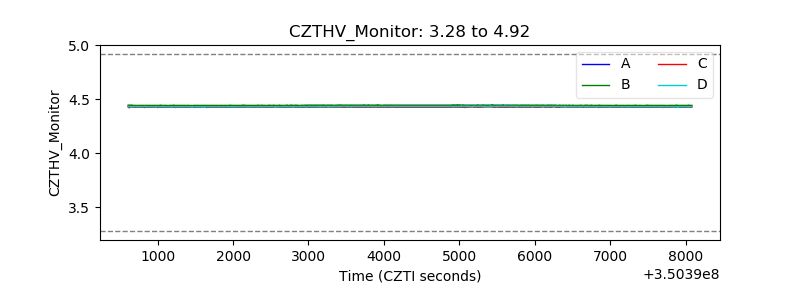 |
| D_VDD | 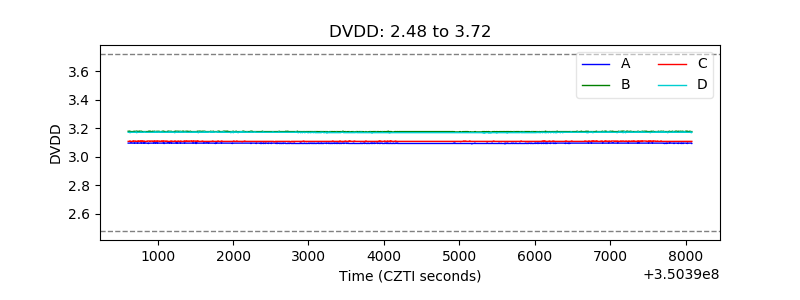 |
| Temperature 1 | 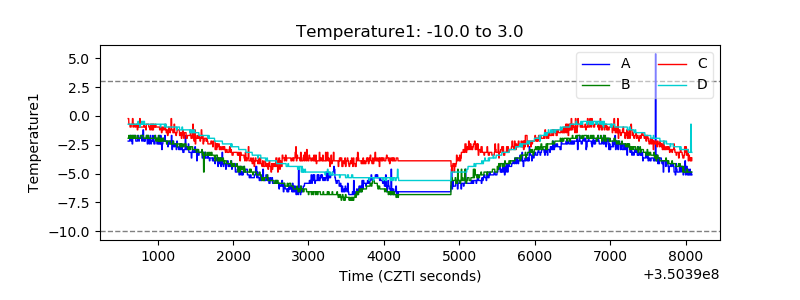 |
| Veto HV Monitor | 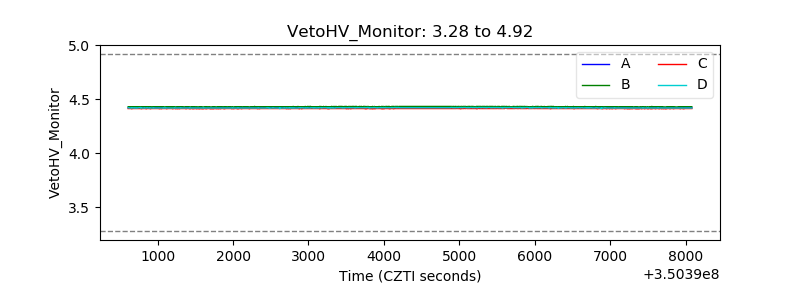 |
| Veto LLD | 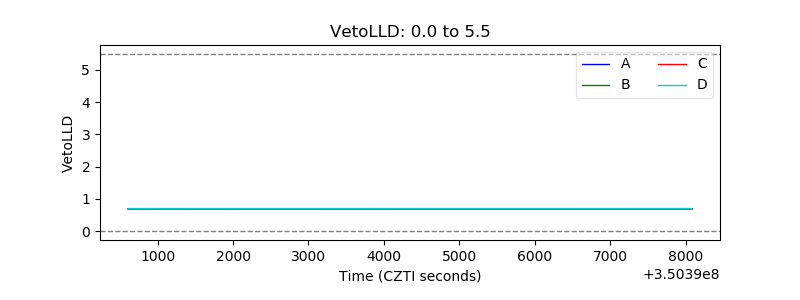 |
| Alpha Counter | 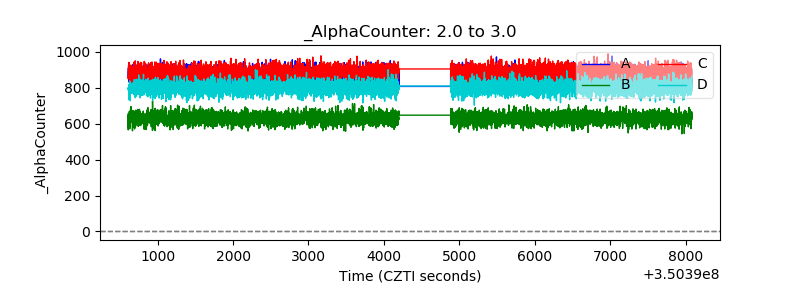 |
| _CPM_Rate | 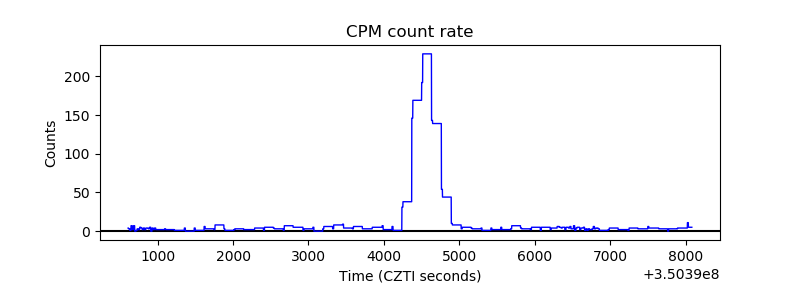 |
| CZT Counter |  |
| +2.5 Volts monitor |  |
| +5 Volts monitor |  |
| _ROLL_ROT | 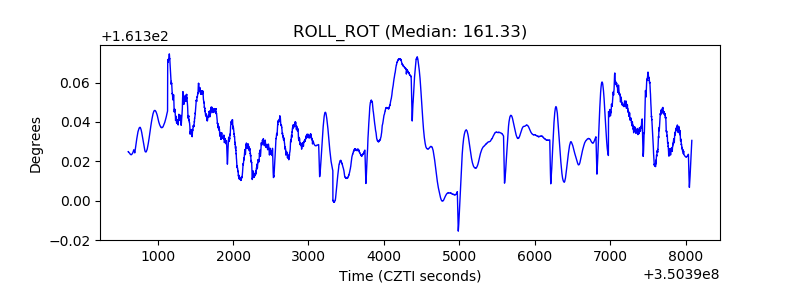 |
| _Roll_DEC | 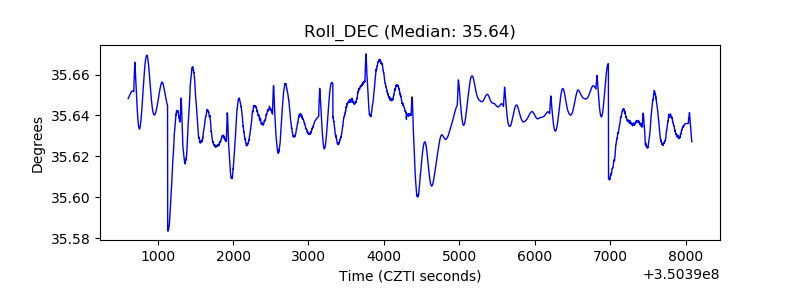 |
| _Roll_RA |  |
| Veto Counter | 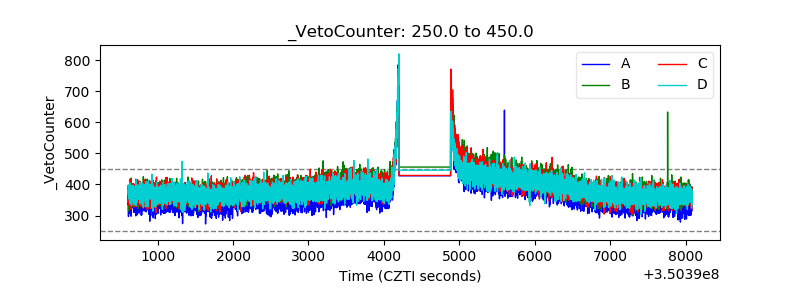 |