| Param | Original file | Final file |
|---|---|---|
| Filename | modeM0/AS1A10_103T04_9000004158cztM0_level2.fits | modeM0/AS1A10_103T04_9000004158cztM0_level2_quad_clean.evt |
| Size (bytes) | 740,914,560 | 612,858,240 |
| Size | 706.6 MB | 584.5 MB |
| Events in quadrant A | 4,616,802 | 3,606,183 |
| Events in quadrant B | 4,399,696 | 3,577,855 |
| Events in quadrant C | 4,468,370 | 3,356,714 |
| Events in quadrant D | 3,792,420 | 2,857,868 |
| Mode M9 | |||
|---|---|---|---|
| Quadrant | BADHDUFLAG | Total packets | Discarded packets |
| A | 0 | 120 | 0 |
| B | 0 | 120 | 0 |
| C | 0 | 120 | 0 |
| D | 0 | 120 | 0 |
| Mode M0 | |||
|---|---|---|---|
| Quadrant | BADHDUFLAG | Total packets | Discarded packets |
| A | 0 | 156833 | 0 |
| B | 0 | 163942 | 0 |
| C | 0 | 166600 | 0 |
| D | 0 | 223210 | 0 |
| Mode SS | |||
|---|---|---|---|
| Quadrant | BADHDUFLAG | Total packets | Discarded packets |
| A | 0 | 1532 | 0 |
| B | 0 | 1532 | 0 |
| C | 0 | 1532 | 0 |
| D | 0 | 1532 | 0 |
| Quadrant | Total seconds | Saturated seconds | Saturation percentage |
|---|---|---|---|
| A | 75258 | 803 | 1.066996% |
| B | 75258 | 1287 | 1.710117% |
| C | 75258 | 1359 | 1.805788% |
| D | 75258 | 4483 | 5.956842% |
Noise dominated data is calculated using 1-second bins in cleaned event files. If a bin has >2000 counts, and if more than 50% of those come from <1% of pixels, then it is considered to be noise-dominated and hence unusable.
| Quadrant | # 1 sec bins | Bins with >0 counts | Bins with >2000 counts | High rate bins dominated by noise | Noise dominated (total time) | Noise dominated (detector-on time) | Marked lightcurve |
|---|---|---|---|---|---|---|---|
| A | 87212 | 75252 | 0 | 0 | 0.00% | 0.00% |  |
| B | 87212 | 75250 | 0 | 0 | 0.00% | 0.00% |  |
| C | 87212 | 75253 | 0 | 0 | 0.00% | 0.00% |  |
| D | 87212 | 75207 | 0 | 0 | 0.00% | 0.00% | 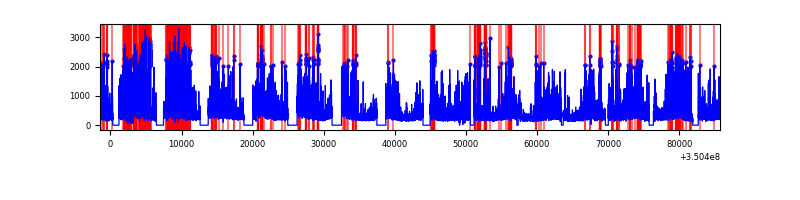 |
Top three noisy pixels from each quadrant. If the there are fewer than three noisy pixels in the level2.evt file, extra rows are filled as -1
| Pixel properties | Quadrant properties | ||||||
|---|---|---|---|---|---|---|---|
| Quadrant | DetID | PixID | Counts | Sigma | Mean | Median | Sigma |
| A | 0 | 29 | 4404 | 11.11 | 1202 | 1128 | 295.0 |
| A | 7 | 110 | 3778 | 8.98 | 1202 | 1128 | 295.0 |
| A | 9 | 19 | 3477 | 7.96 | 1202 | 1128 | 295.0 |
| B | 2 | 9 | 3514 | 10.52 | 1163 | 1112 | 228.3 |
| B | 2 | 8 | 2952 | 8.06 | 1163 | 1112 | 228.3 |
| B | 5 | 255 | 2867 | 7.69 | 1163 | 1112 | 228.3 |
| C | 12 | 241 | 3105 | 6.68 | 1180 | 1106 | 299.2 |
| C | 3 | 187 | 2964 | 6.21 | 1180 | 1106 | 299.2 |
| C | 9 | 233 | 2958 | 6.19 | 1180 | 1106 | 299.2 |
| D | 15 | 46 | 2808 | 6.45 | 1082 | 988 | 282.4 |
| D | 3 | 14 | 2788 | 6.37 | 1082 | 988 | 282.4 |
| D | 10 | 189 | 2648 | 5.88 | 1082 | 988 | 282.4 |
Histogram calculated using DETX and DETY for each event in the final _common_clean file
| Quadrant A | 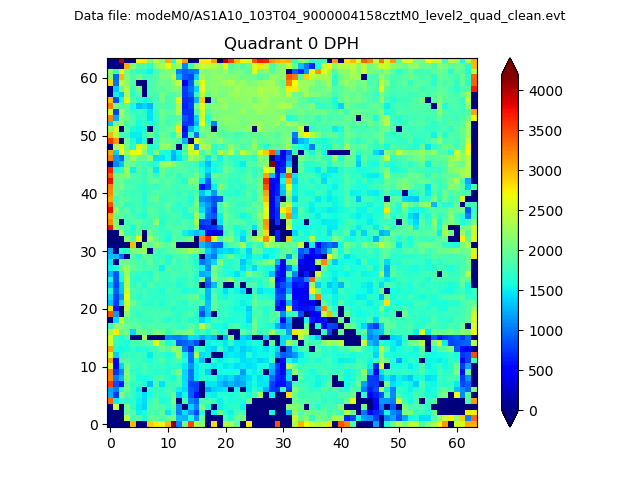 |
 |
Quadrant B |
|---|---|---|---|
| Quadrant D | 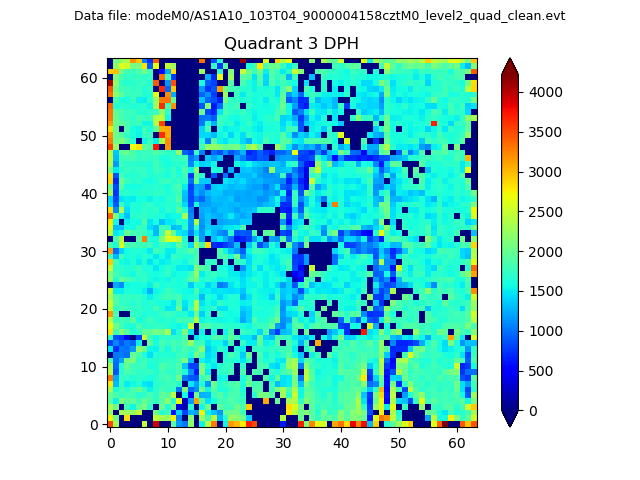 |
 |
Quadrant C |
| Plot type | Count rate plots | Images |
|---|---|---|
| Comparison with Poisson distribution Blue bars denote a histogram of data divided into 1 sec bins. Red curve is a Poisson curve with rate = median count rate of data. |
 |
 |
| Quadrant-wise count rates Data is divided into 100 sec bins |
 |
|
| Module-wise count rates for Quadrant A Data is divided into 100 sec bins |
 |
 |
| Module-wise count rates for Quadrant B Data is divided into 100 sec bins |
 |
 |
| Module-wise count rates for Quadrant C Data is divided into 100 sec bins |
 |
 |
| Module-wise count rates for Quadrant D Data is divided into 100 sec bins |
 |
 |
| Parameter | Plot |
|---|---|
| CZT HV Monitor |  |
| D_VDD |  |
| Temperature 1 |  |
| Veto HV Monitor |  |
| Veto LLD |  |
| Alpha Counter |  |
| _CPM_Rate |  |
| CZT Counter |  |
| +2.5 Volts monitor |  |
| +5 Volts monitor |  |
| _ROLL_ROT | 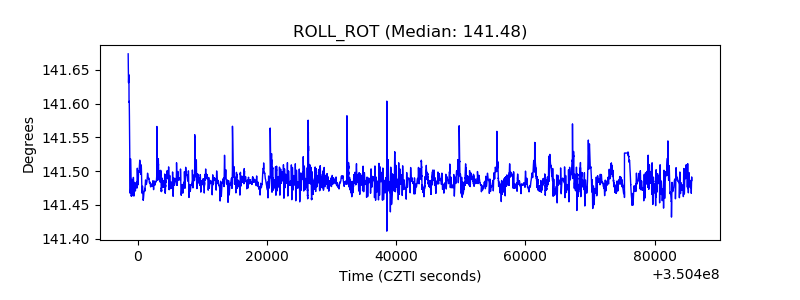 |
| _Roll_DEC | 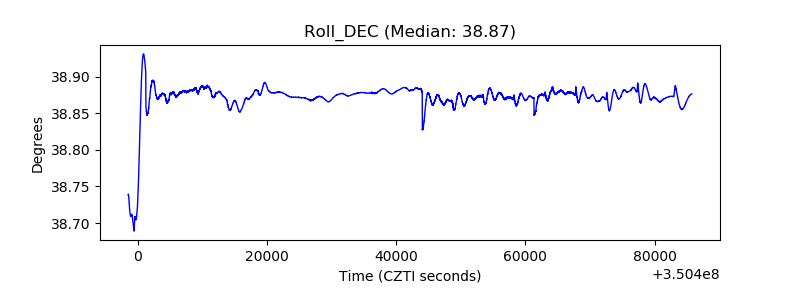 |
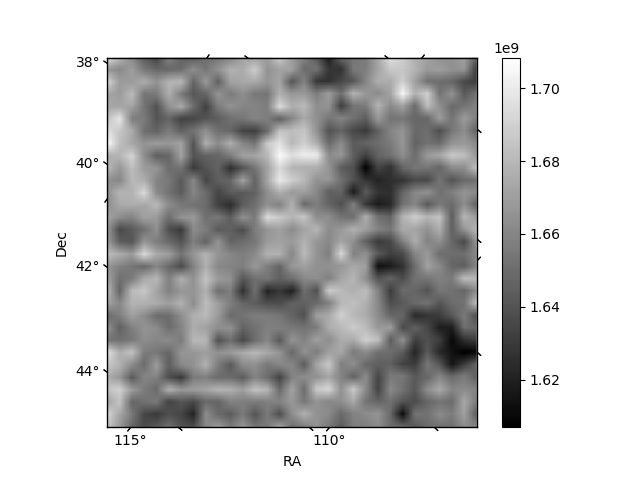
| _Roll_RA |  |
| Veto Counter |  |