| Param | Original file | Final file |
|---|---|---|
| Filename | modeM0/AS1A10_103T04_9000004158_29003cztM0_level2.evt | modeM0/AS1A10_103T04_9000004158_29003cztM0_level2_quad_clean.evt |
| Size (bytes) | 642,104,640 | 98,337,600 |
| Size | 612.4 MB | 93.8 MB |
| Events in quadrant A | 3,221,984 | 677,919 |
| Events in quadrant B | 4,102,881 | 674,206 |
| Events in quadrant C | 4,112,720 | 636,695 |
| Events in quadrant D | 7,565,596 | 532,087 |
| Mode M9 | |||
|---|---|---|---|
| Quadrant | BADHDUFLAG | Total packets | Discarded packets |
| A | 0 | 10 | 0 |
| B | 0 | 10 | 0 |
| C | 0 | 10 | 0 |
| D | 0 | 10 | 0 |
| Mode M0 | |||
|---|---|---|---|
| Quadrant | BADHDUFLAG | Total packets | Discarded packets |
| A | 0 | 13871 | 1 |
| B | 0 | 16472 | 1 |
| C | 0 | 16715 | 1 |
| D | 0 | 27060 | 1 |
| Mode SS | |||
|---|---|---|---|
| Quadrant | BADHDUFLAG | Total packets | Discarded packets |
| A | 0 | 132 | 0 |
| B | 0 | 132 | 0 |
| C | 0 | 132 | 0 |
| D | 0 | 132 | 0 |
| Quadrant | Total seconds | Saturated seconds | Saturation percentage |
|---|---|---|---|
| A | 6551 | 66 | 1.007480% |
| B | 6551 | 146 | 2.228667% |
| C | 6551 | 144 | 2.198138% |
| D | 6551 | 1346 | 20.546481% |
Noise dominated data is calculated using 1-second bins in cleaned event files. If a bin has >2000 counts, and if more than 50% of those come from <1% of pixels, then it is considered to be noise-dominated and hence unusable.
| Quadrant | # 1 sec bins | Bins with >0 counts | Bins with >2000 counts | High rate bins dominated by noise | Noise dominated (total time) | Noise dominated (detector-on time) | Marked lightcurve |
|---|---|---|---|---|---|---|---|
| A | 7551 | 6552 | 0 | 0 | 0.00% | 0.00% | 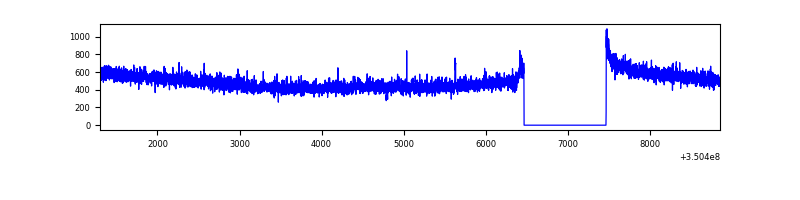 |
| B | 7551 | 6552 | 74 | 74 | 0.98% | 1.13% | 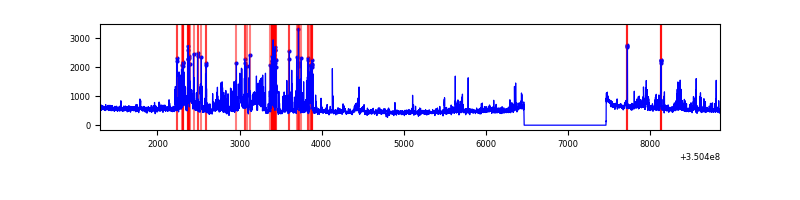 |
| C | 7551 | 6552 | 0 | 0 | 0.00% | 0.00% | 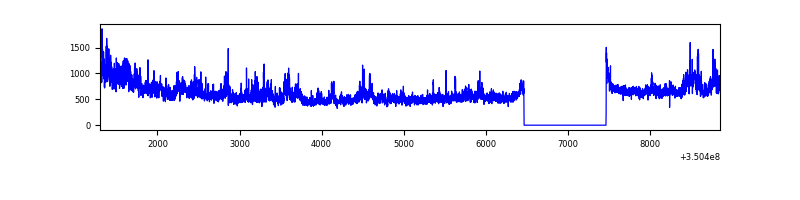 |
| D | 7551 | 6552 | 1145 | 1145 | 15.16% | 17.48% |  |
Top three noisy pixels from each quadrant. If the there are fewer than three noisy pixels in the level2.evt file, extra rows are filled as -1
| Pixel properties | Quadrant properties | ||||||
|---|---|---|---|---|---|---|---|
| Quadrant | DetID | PixID | Counts | Sigma | Mean | Median | Sigma |
| A | 13 | 254 | 11310 | 62.77 | 830 | 817 | 167.2 |
| A | 3 | 137 | 7875 | 42.22 | 830 | 817 | 167.2 |
| A | 0 | 226 | 7137 | 37.8 | 830 | 817 | 167.2 |
| B | 10 | 245 | 686409 | 4393.3 | 814 | 794 | 156.1 |
| B | 10 | 246 | 213348 | 1362.01 | 814 | 794 | 156.1 |
| B | 12 | 111 | 19204 | 117.97 | 814 | 794 | 156.1 |
| C | 3 | 233 | 906727 | 4889.56 | 787 | 792 | 185.3 |
| C | 14 | 238 | 124357 | 666.91 | 787 | 792 | 185.3 |
| C | 2 | 114 | 15246 | 78.01 | 787 | 792 | 185.3 |
| D | 1 | 52 | 3469790 | 19856.05 | 729 | 709 | 174.7 |
| D | 8 | 195 | 580940 | 3321.08 | 729 | 709 | 174.7 |
| D | 7 | 80 | 463938 | 2651.39 | 729 | 709 | 174.7 |
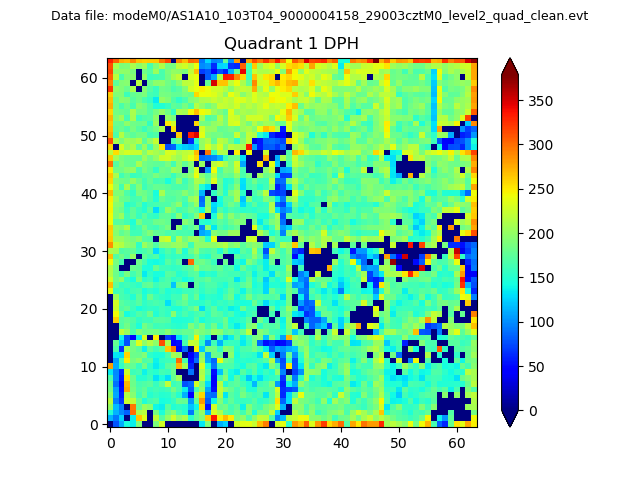
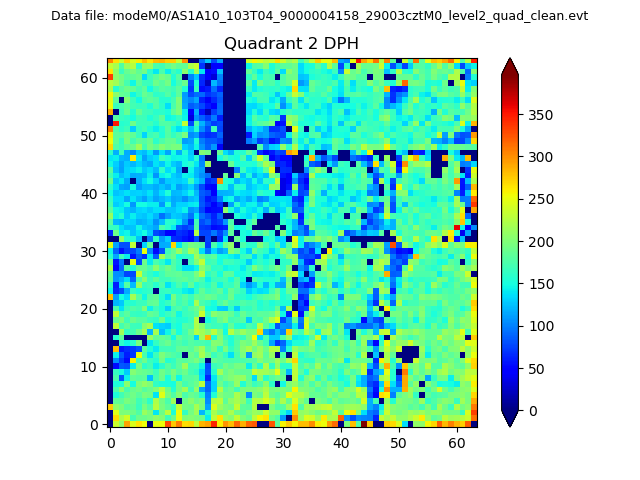
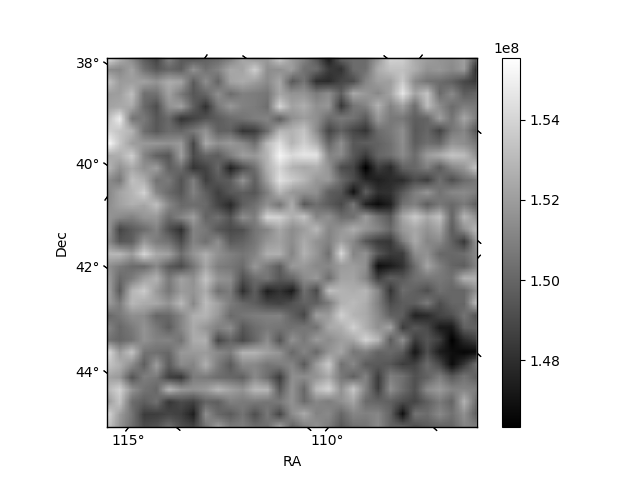
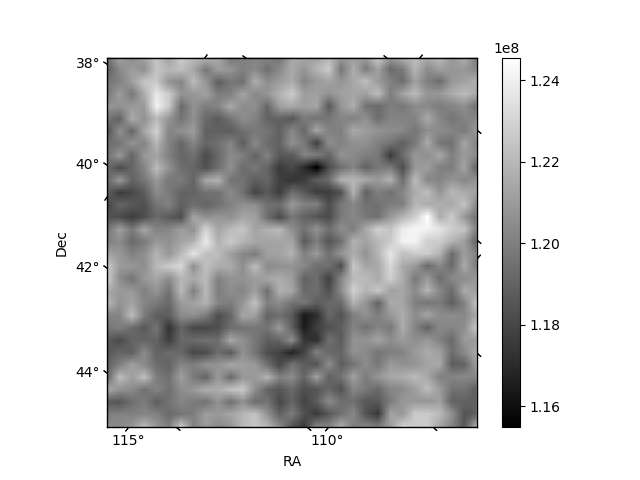
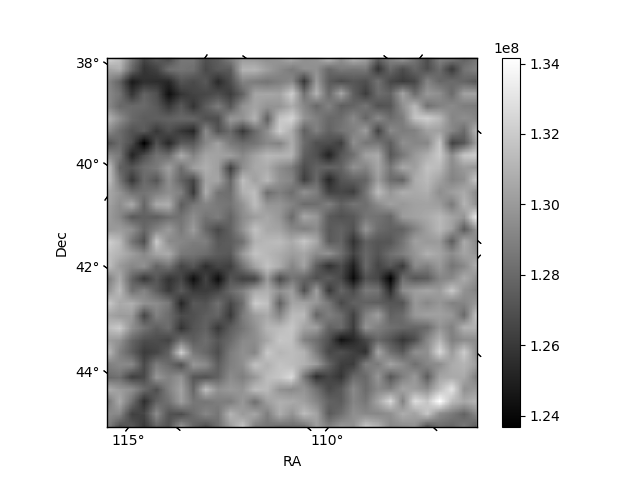
Histogram calculated using DETX and DETY for each event in the final _common_clean file
| Quadrant A | 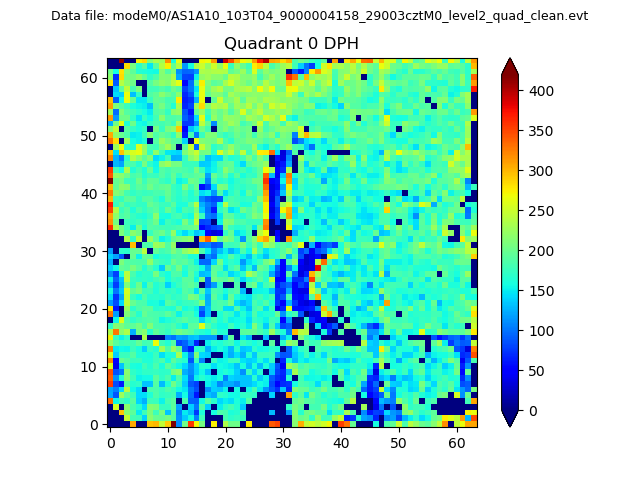 |
 |
Quadrant B |
|---|---|---|---|
| Quadrant D | 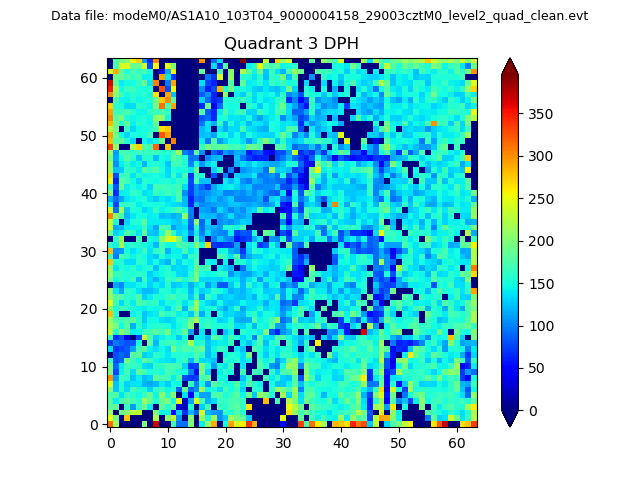 |
 |
Quadrant C |
| Plot type | Count rate plots | Images |
|---|---|---|
| Comparison with Poisson distribution Blue bars denote a histogram of data divided into 1 sec bins. Red curve is a Poisson curve with rate = median count rate of data. |
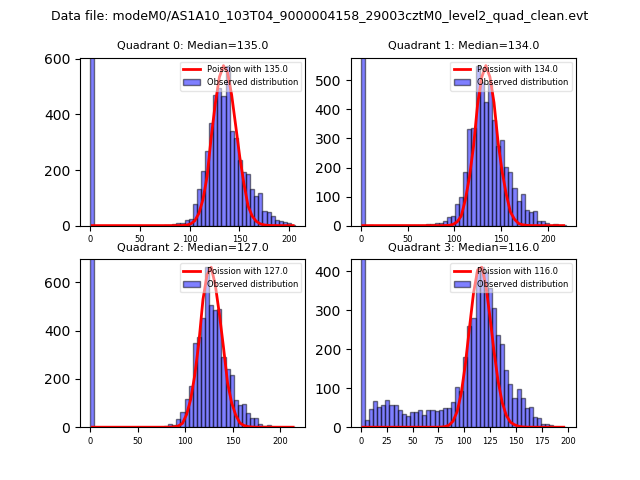 |
 |
| Quadrant-wise count rates Data is divided into 100 sec bins |
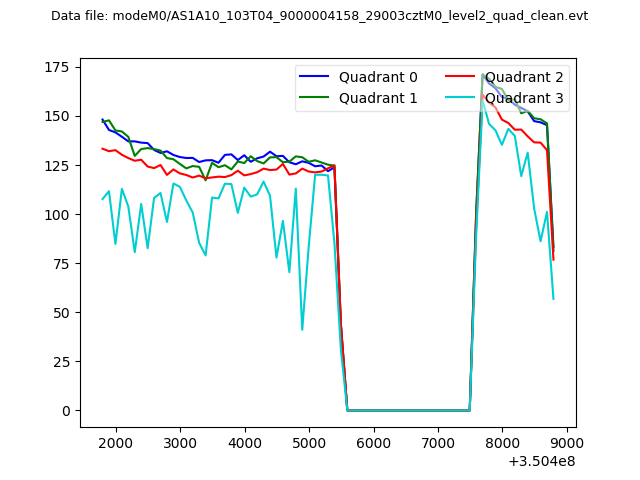 |
|
| Module-wise count rates for Quadrant A Data is divided into 100 sec bins |
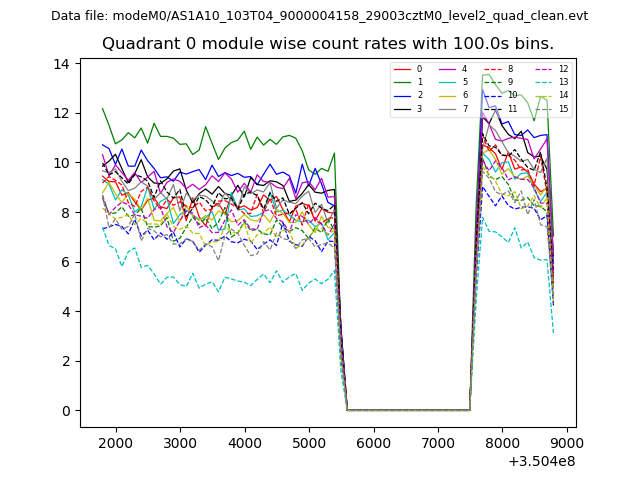 |
 |
| Module-wise count rates for Quadrant B Data is divided into 100 sec bins |
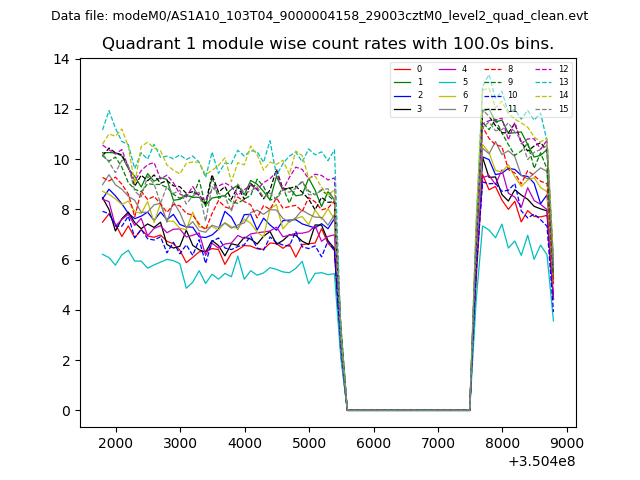 |
 |
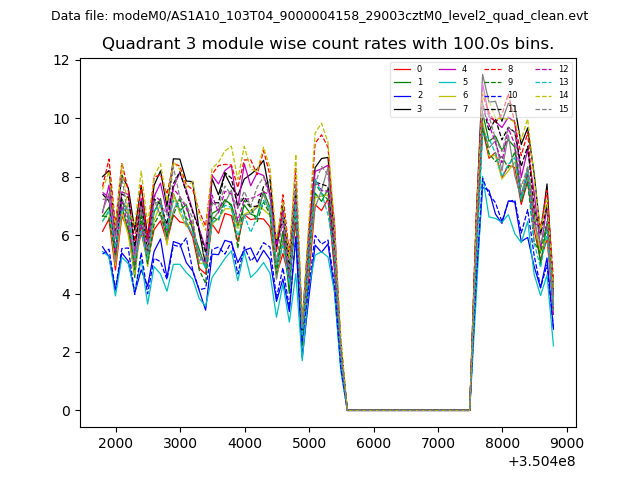
| Module-wise count rates for Quadrant C Data is divided into 100 sec bins |
 |
 |
| Module-wise count rates for Quadrant D Data is divided into 100 sec bins |
 |
 |
| Parameter | Plot |
|---|---|
| CZT HV Monitor | 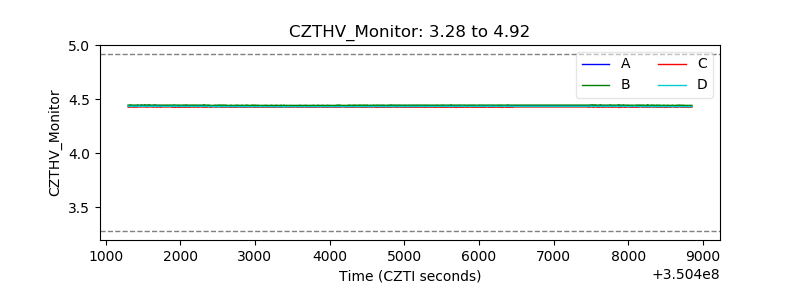 |
| D_VDD |  |
| Temperature 1 | 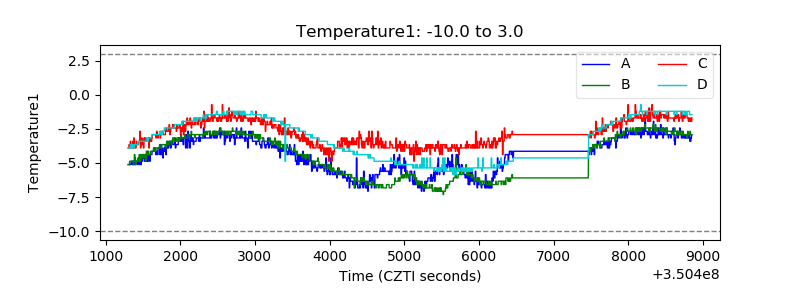 |
| Veto HV Monitor |  |
| Veto LLD | 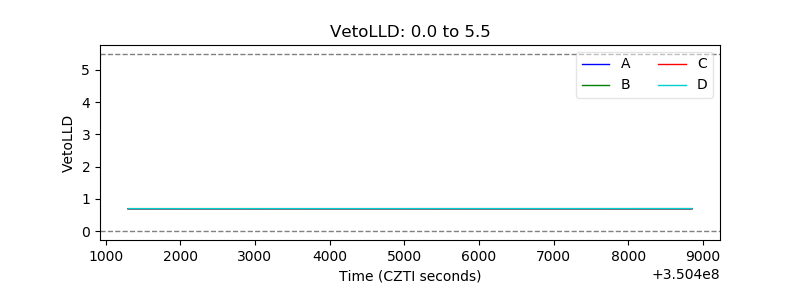 |
| Alpha Counter | 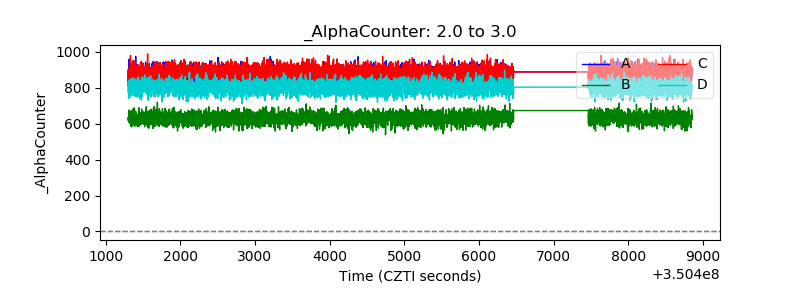 |
| _CPM_Rate |  |
| CZT Counter | 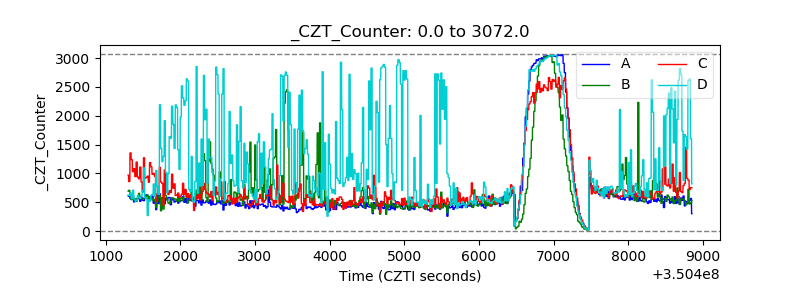 |
| +2.5 Volts monitor |  |
| +5 Volts monitor |  |
| _ROLL_ROT | 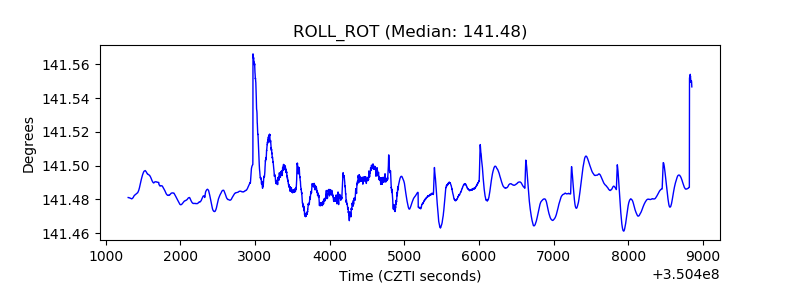 |
| _Roll_DEC | 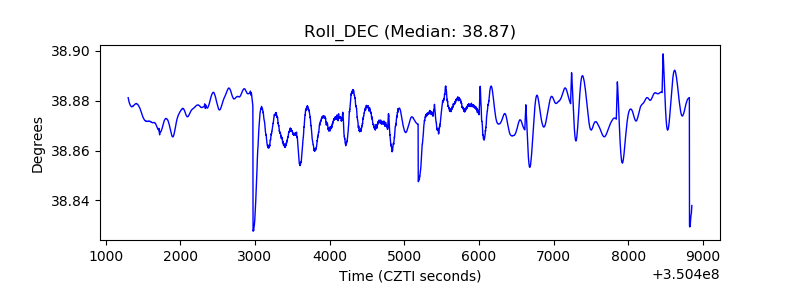 |
| _Roll_RA |  |
| Veto Counter | 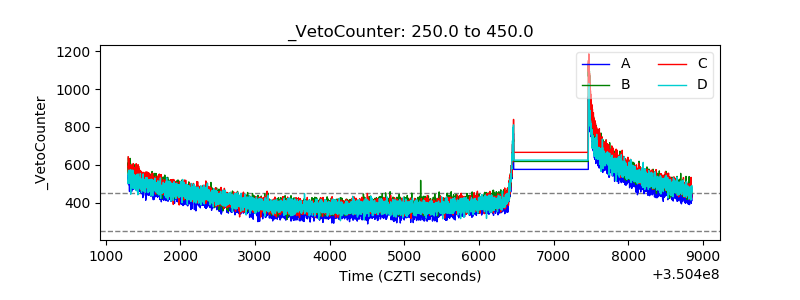 |