| Param | Original file | Final file |
|---|---|---|
| Filename | modeM0/AS1A10_103T04_9000004158_29006cztM0_level2.evt | modeM0/AS1A10_103T04_9000004158_29006cztM0_level2_quad_clean.evt |
| Size (bytes) | 552,562,560 | 104,734,080 |
| Size | 527.0 MB | 99.9 MB |
| Events in quadrant A | 3,146,353 | 715,199 |
| Events in quadrant B | 3,881,655 | 711,573 |
| Events in quadrant C | 4,278,998 | 678,418 |
| Events in quadrant D | 5,017,398 | 643,672 |
| Mode M9 | |||
|---|---|---|---|
| Quadrant | BADHDUFLAG | Total packets | Discarded packets |
| A | 0 | 12 | 0 |
| B | 0 | 12 | 0 |
| C | 0 | 12 | 0 |
| D | 0 | 12 | 0 |
| Mode M0 | |||
|---|---|---|---|
| Quadrant | BADHDUFLAG | Total packets | Discarded packets |
| A | 0 | 13379 | 1 |
| B | 0 | 15431 | 1 |
| C | 0 | 17287 | 1 |
| D | 0 | 19076 | 1 |
| Mode SS | |||
|---|---|---|---|
| Quadrant | BADHDUFLAG | Total packets | Discarded packets |
| A | 0 | 124 | 0 |
| B | 0 | 124 | 0 |
| C | 0 | 124 | 0 |
| D | 0 | 124 | 0 |
| Quadrant | Total seconds | Saturated seconds | Saturation percentage |
|---|---|---|---|
| A | 6054 | 61 | 1.007598% |
| B | 6055 | 211 | 3.484723% |
| C | 6055 | 146 | 2.411230% |
| D | 6055 | 258 | 4.260941% |
Noise dominated data is calculated using 1-second bins in cleaned event files. If a bin has >2000 counts, and if more than 50% of those come from <1% of pixels, then it is considered to be noise-dominated and hence unusable.
| Quadrant | # 1 sec bins | Bins with >0 counts | Bins with >2000 counts | High rate bins dominated by noise | Noise dominated (total time) | Noise dominated (detector-on time) | Marked lightcurve |
|---|---|---|---|---|---|---|---|
| A | 7299 | 6055 | 0 | 0 | 0.00% | 0.00% | 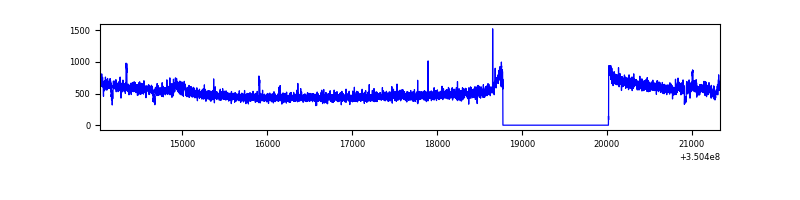 |
| B | 7300 | 6056 | 127 | 127 | 1.74% | 2.10% | 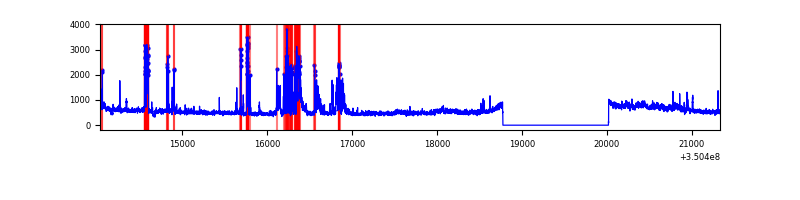 |
| C | 7300 | 6056 | 1 | 1 | 0.01% | 0.02% | 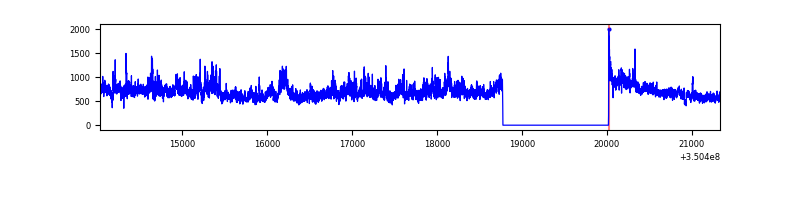 |
| D | 7300 | 6056 | 173 | 173 | 2.37% | 2.86% | 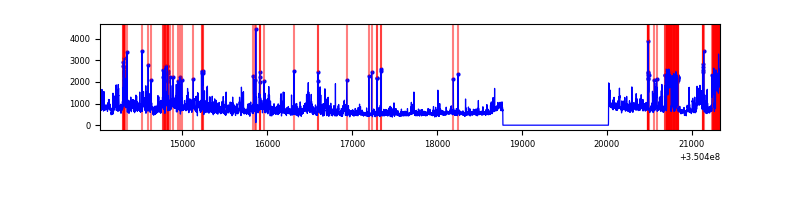 |
Top three noisy pixels from each quadrant. If the there are fewer than three noisy pixels in the level2.evt file, extra rows are filled as -1
| Pixel properties | Quadrant properties | ||||||
|---|---|---|---|---|---|---|---|
| Quadrant | DetID | PixID | Counts | Sigma | Mean | Median | Sigma |
| A | 1 | 113 | 23685 | 143.96 | 803 | 790 | 159.0 |
| A | 12 | 210 | 19904 | 120.19 | 803 | 790 | 159.0 |
| A | 13 | 254 | 10811 | 63.01 | 803 | 790 | 159.0 |
| B | 10 | 245 | 775540 | 5311.5 | 783 | 765 | 145.9 |
| B | 0 | 229 | 24971 | 165.95 | 783 | 765 | 145.9 |
| B | 12 | 111 | 17179 | 112.53 | 783 | 765 | 145.9 |
| C | 3 | 233 | 1138572 | 6334.85 | 770 | 776 | 179.6 |
| C | 14 | 238 | 124024 | 686.2 | 770 | 776 | 179.6 |
| C | 2 | 114 | 14894 | 78.6 | 770 | 776 | 179.6 |
| D | 8 | 195 | 1071513 | 5874.81 | 771 | 751 | 182.3 |
| D | 1 | 52 | 872633 | 4783.64 | 771 | 751 | 182.3 |
| D | 13 | 104 | 81036 | 440.49 | 771 | 751 | 182.3 |
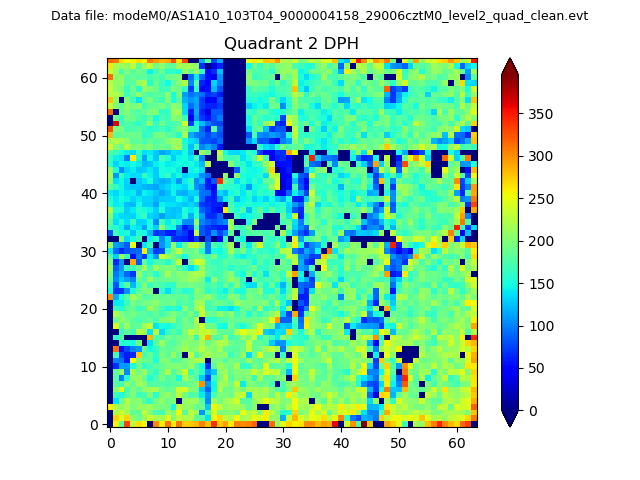
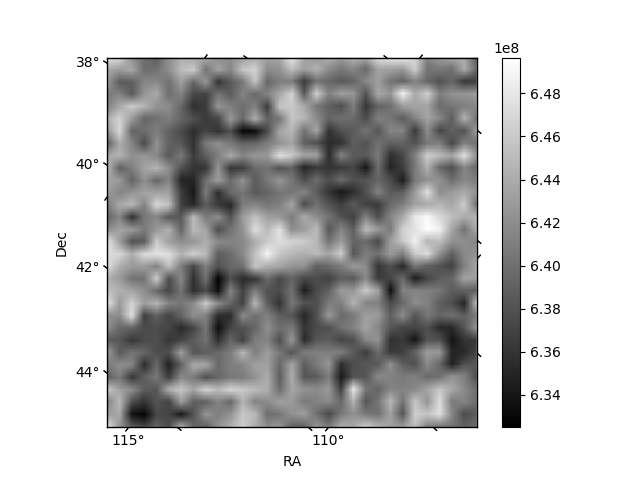
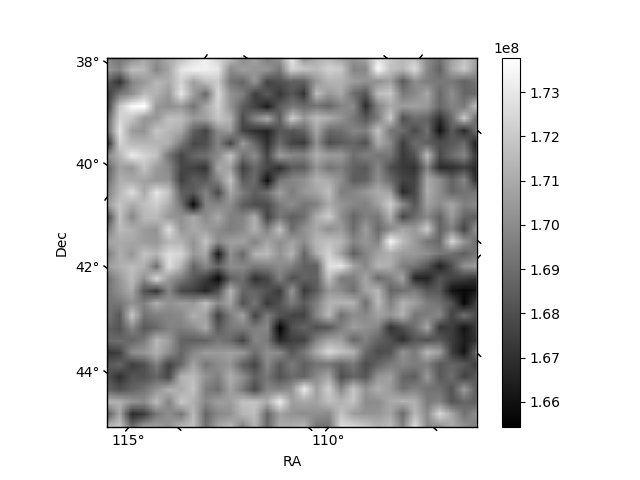
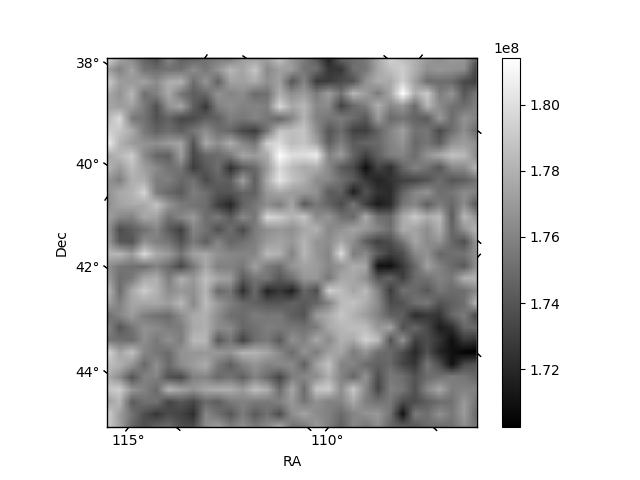
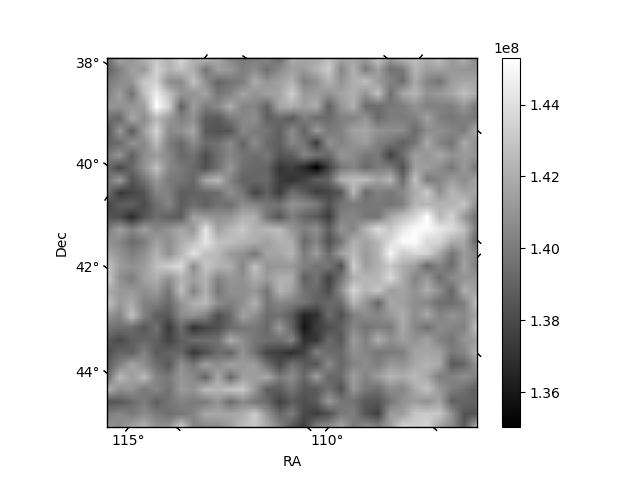
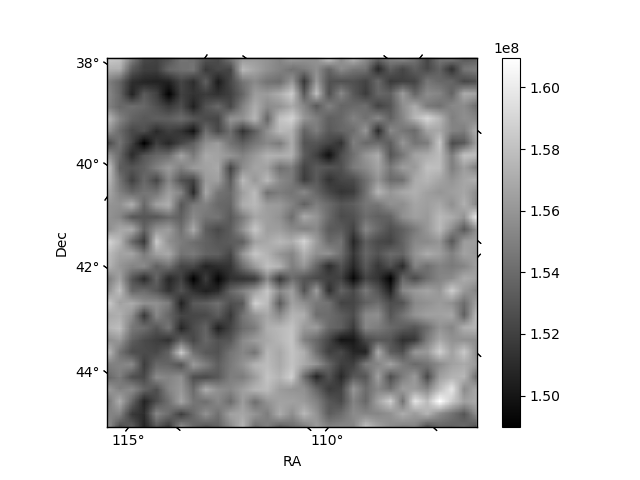
Histogram calculated using DETX and DETY for each event in the final _common_clean file
| Quadrant A | 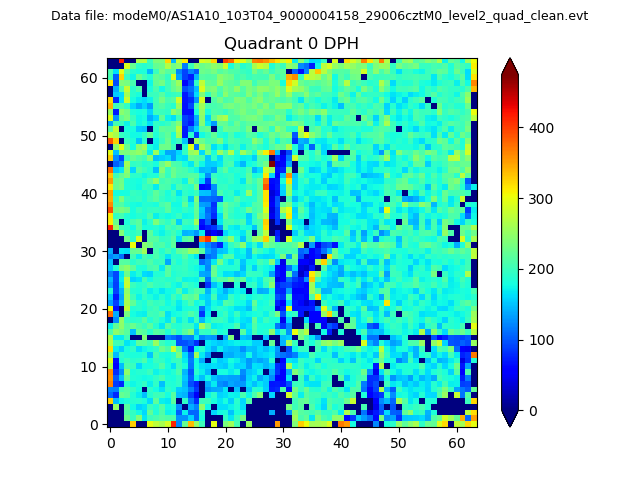 |
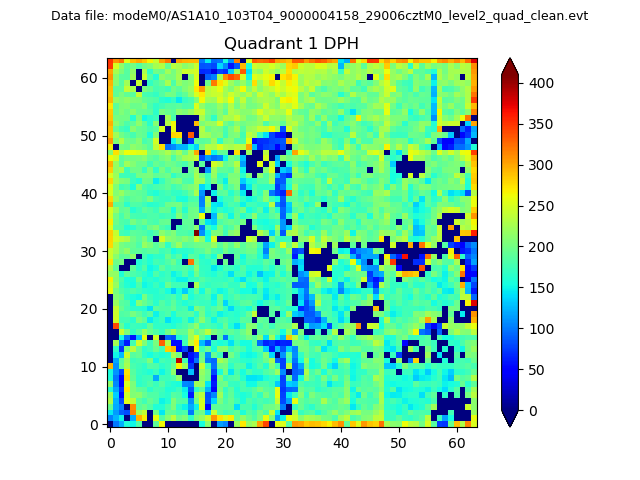 |
Quadrant B |
|---|---|---|---|
| Quadrant D | 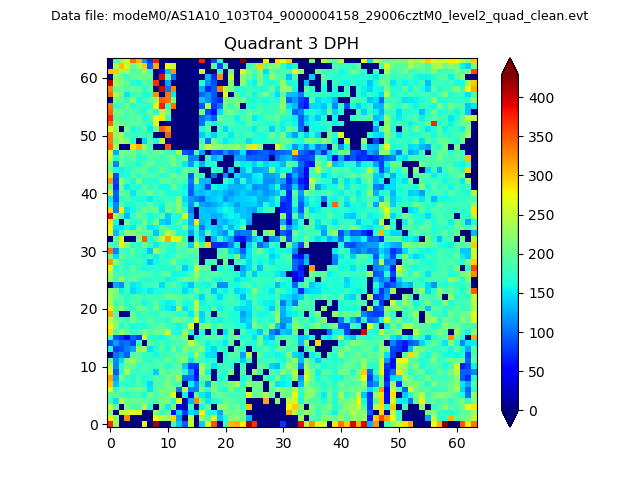 |
 |
Quadrant C |
| Plot type | Count rate plots | Images |
|---|---|---|
| Comparison with Poisson distribution Blue bars denote a histogram of data divided into 1 sec bins. Red curve is a Poisson curve with rate = median count rate of data. |
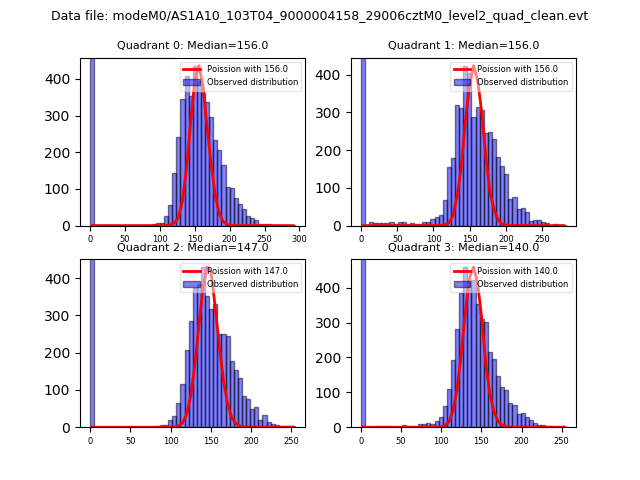 |
 |
| Quadrant-wise count rates Data is divided into 100 sec bins |
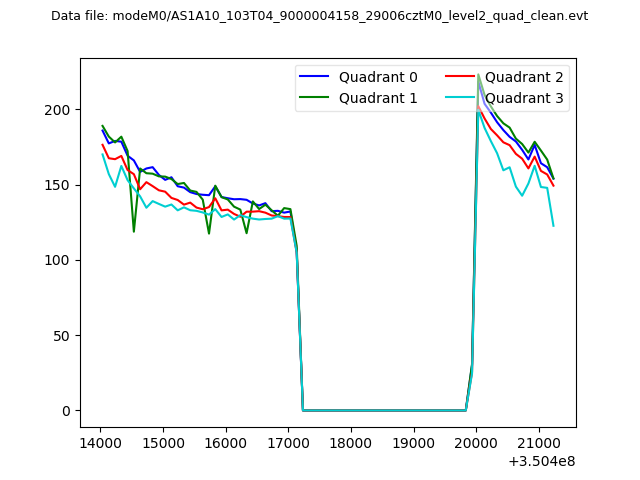 |
|
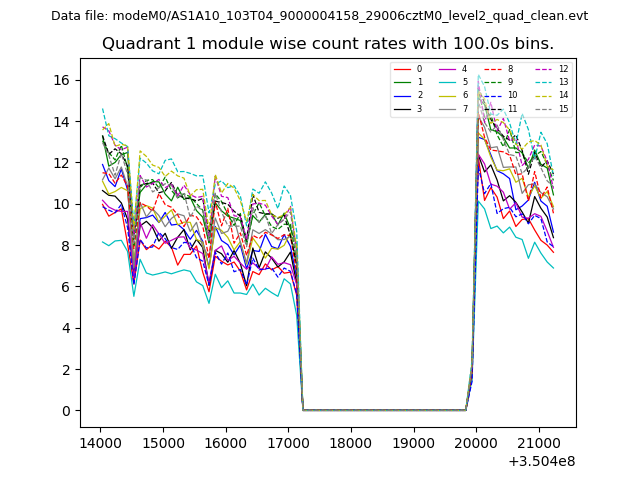
| Module-wise count rates for Quadrant A Data is divided into 100 sec bins |
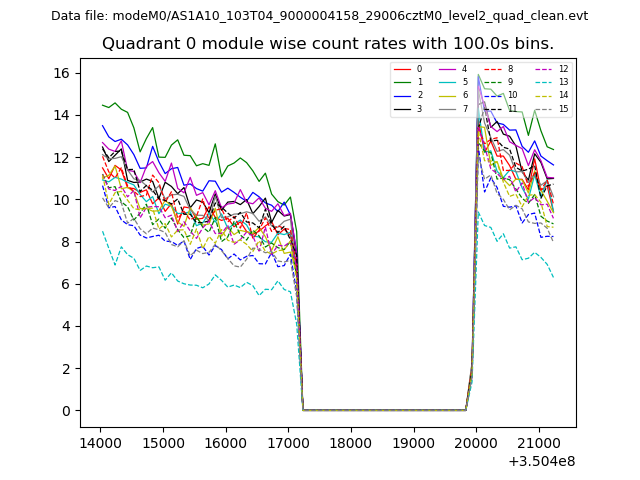 |
 |
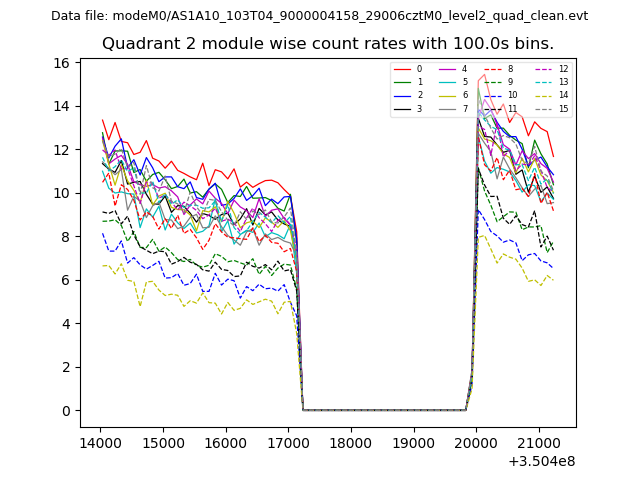
| Module-wise count rates for Quadrant B Data is divided into 100 sec bins |
 |
 |
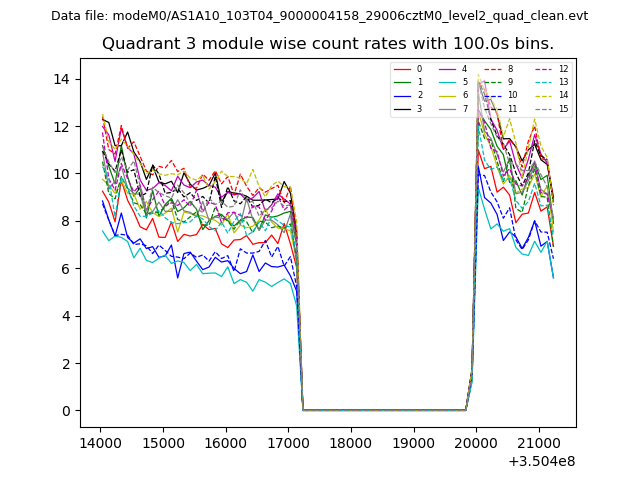
| Module-wise count rates for Quadrant C Data is divided into 100 sec bins |
 |
 |
| Module-wise count rates for Quadrant D Data is divided into 100 sec bins |
 |
 |
| Parameter | Plot |
|---|---|
| CZT HV Monitor | 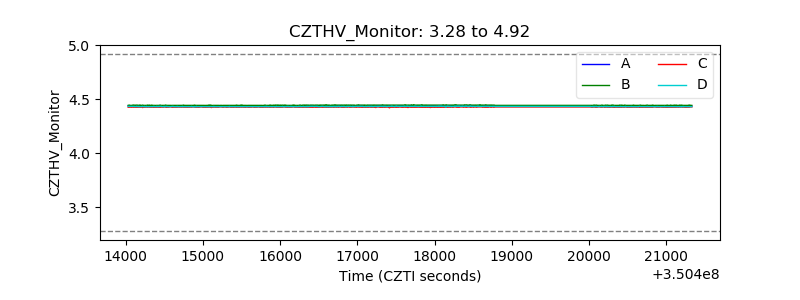 |
| D_VDD | 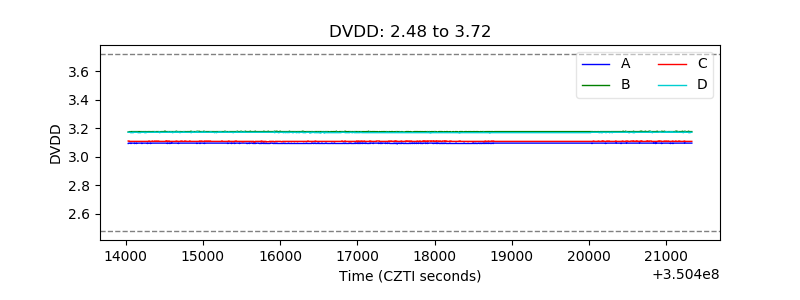 |
| Temperature 1 | 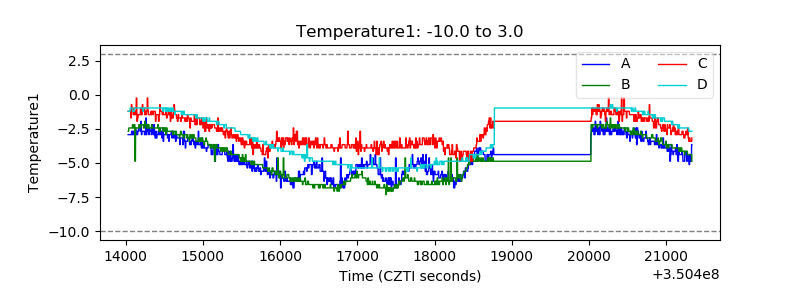 |
| Veto HV Monitor | 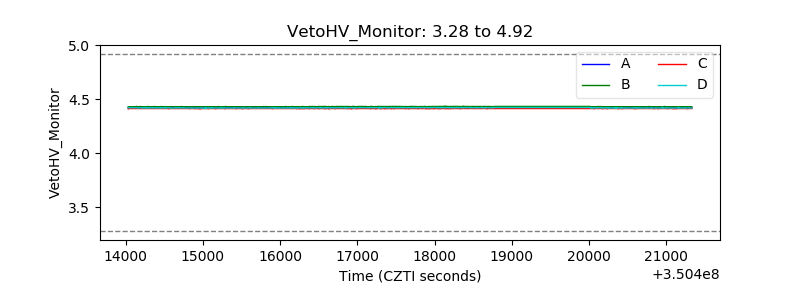 |
| Veto LLD | 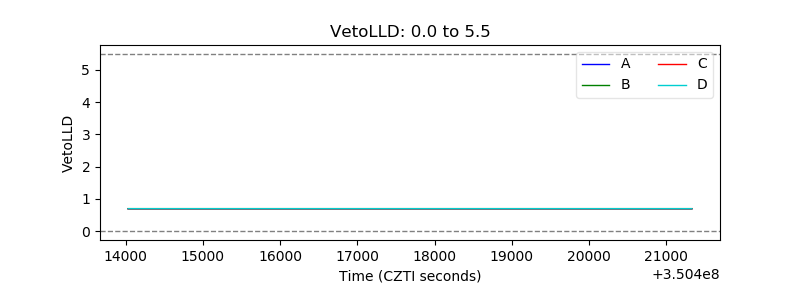 |
| Alpha Counter | 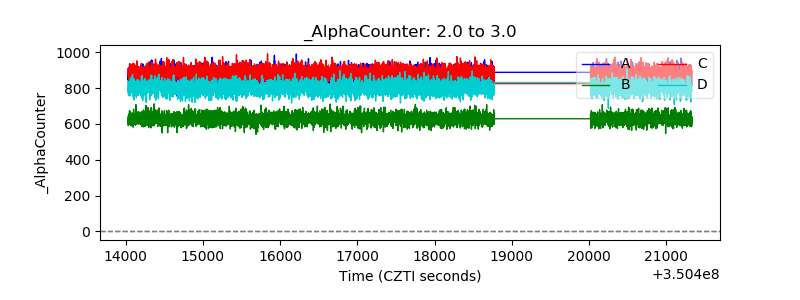 |
| _CPM_Rate | 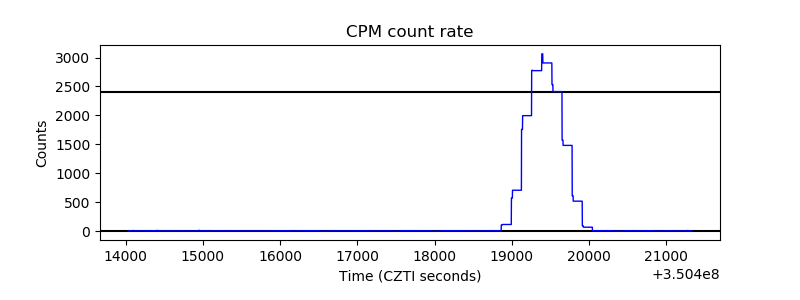 |
| CZT Counter | 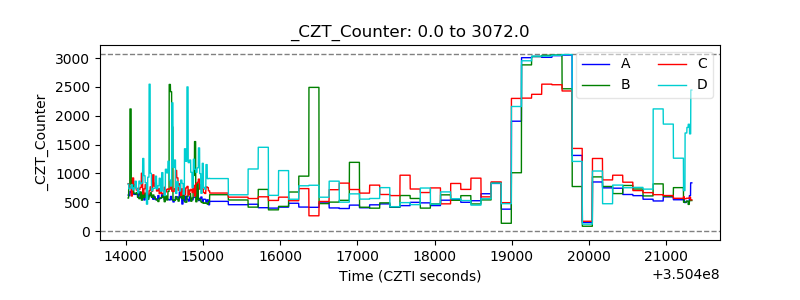 |
| +2.5 Volts monitor | 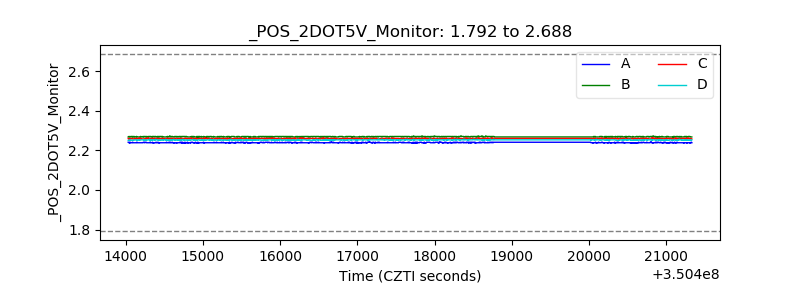 |
| +5 Volts monitor |  |
| _ROLL_ROT | 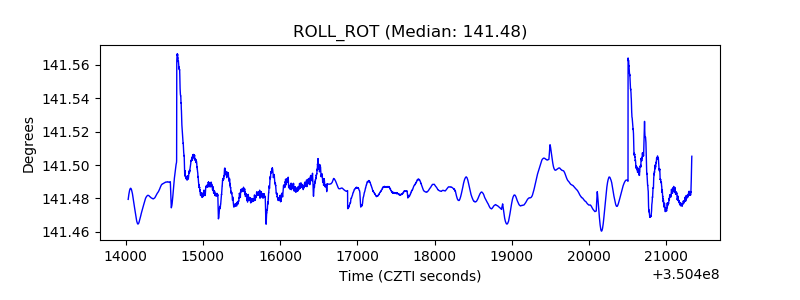 |
| _Roll_DEC | 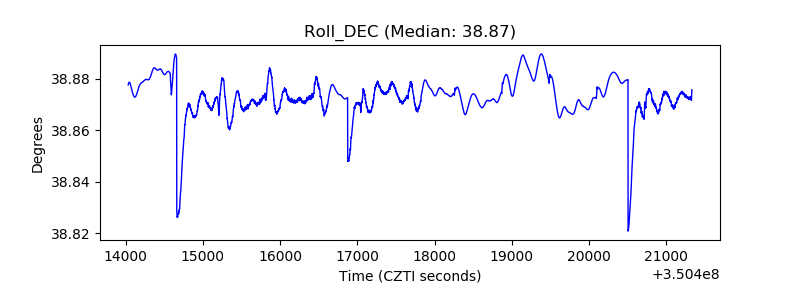 |
| _Roll_RA | 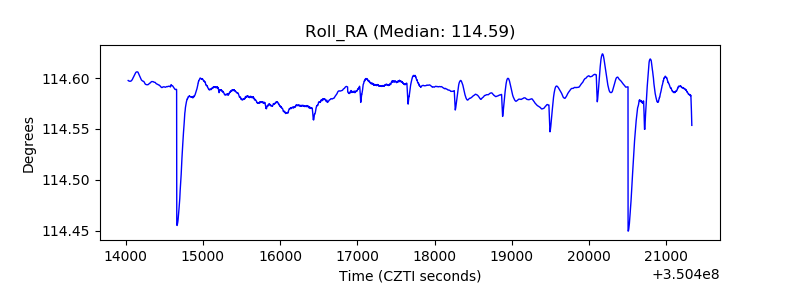 |
| Veto Counter | 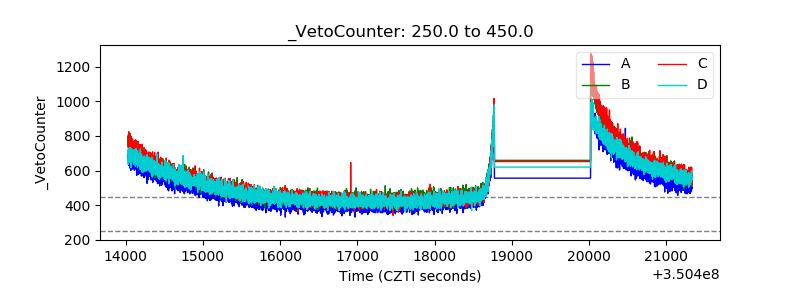 |