| Param | Original file | Final file |
|---|---|---|
| Filename | modeM0/AS1A10_103T04_9000004158_29010cztM0_level2.evt | modeM0/AS1A10_103T04_9000004158_29010cztM0_level2_quad_clean.evt |
| Size (bytes) | 472,443,840 | 97,263,360 |
| Size | 450.6 MB | 92.8 MB |
| Events in quadrant A | 3,176,414 | 636,774 |
| Events in quadrant B | 3,270,356 | 650,079 |
| Events in quadrant C | 3,221,238 | 612,879 |
| Events in quadrant D | 4,188,742 | 582,783 |
| Mode M9 | |||
|---|---|---|---|
| Quadrant | BADHDUFLAG | Total packets | Discarded packets |
| A | 0 | 14 | 0 |
| B | 0 | 15 | 0 |
| C | 0 | 15 | 0 |
| D | 0 | 15 | 0 |
| Mode M0 | |||
|---|---|---|---|
| Quadrant | BADHDUFLAG | Total packets | Discarded packets |
| A | 0 | 13716 | 2 |
| B | 0 | 13901 | 2 |
| C | 0 | 13751 | 2 |
| D | 0 | 16951 | 2 |
| Mode SS | |||
|---|---|---|---|
| Quadrant | BADHDUFLAG | Total packets | Discarded packets |
| A | 0 | 136 | 0 |
| B | 0 | 136 | 0 |
| C | 0 | 136 | 0 |
| D | 0 | 136 | 0 |
| Quadrant | Total seconds | Saturated seconds | Saturation percentage |
|---|---|---|---|
| A | 6639 | 15 | 0.225938% |
| B | 6639 | 19 | 0.286188% |
| C | 6639 | 45 | 0.677813% |
| D | 6639 | 131 | 1.973189% |
Noise dominated data is calculated using 1-second bins in cleaned event files. If a bin has >2000 counts, and if more than 50% of those come from <1% of pixels, then it is considered to be noise-dominated and hence unusable.
| Quadrant | # 1 sec bins | Bins with >0 counts | Bins with >2000 counts | High rate bins dominated by noise | Noise dominated (total time) | Noise dominated (detector-on time) | Marked lightcurve |
|---|---|---|---|---|---|---|---|
| A | 7649 | 6640 | 0 | 0 | 0.00% | 0.00% | 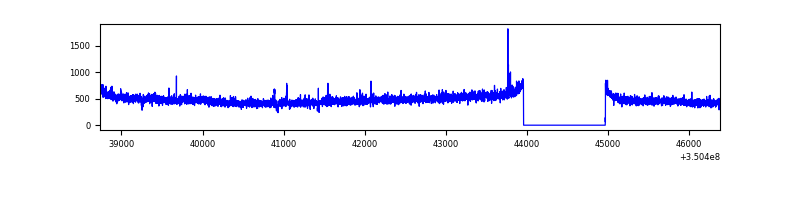 |
| B | 7649 | 6640 | 1 | 1 | 0.01% | 0.02% | 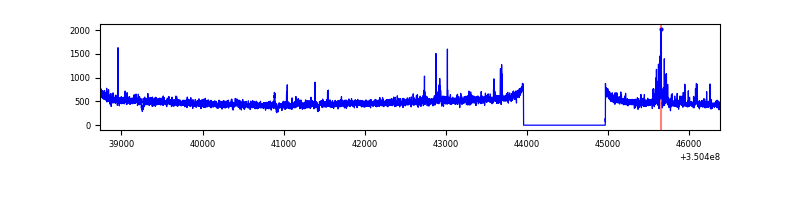 |
| C | 7649 | 6640 | 0 | 0 | 0.00% | 0.00% |  |
| D | 7649 | 6640 | 104 | 104 | 1.36% | 1.57% | 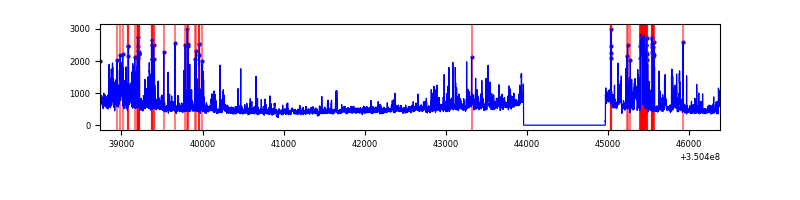 |
Top three noisy pixels from each quadrant. If the there are fewer than three noisy pixels in the level2.evt file, extra rows are filled as -1
| Pixel properties | Quadrant properties | ||||||
|---|---|---|---|---|---|---|---|
| Quadrant | DetID | PixID | Counts | Sigma | Mean | Median | Sigma |
| A | 1 | 113 | 19778 | 117.39 | 812 | 797 | 161.7 |
| A | 12 | 210 | 14321 | 83.64 | 812 | 797 | 161.7 |
| A | 13 | 254 | 11589 | 66.74 | 812 | 797 | 161.7 |
| B | 10 | 246 | 46206 | 294.09 | 812 | 790 | 154.4 |
| B | 0 | 190 | 24125 | 151.11 | 812 | 790 | 154.4 |
| B | 12 | 111 | 18723 | 116.13 | 812 | 790 | 154.4 |
| C | 14 | 238 | 126065 | 683.06 | 784 | 789 | 183.4 |
| C | 3 | 233 | 15788 | 81.78 | 784 | 789 | 183.4 |
| C | 2 | 114 | 15347 | 79.38 | 784 | 789 | 183.4 |
| D | 1 | 52 | 665567 | 3616.62 | 774 | 755 | 183.8 |
| D | 8 | 195 | 447096 | 2428.12 | 774 | 755 | 183.8 |
| D | 13 | 104 | 110891 | 599.15 | 774 | 755 | 183.8 |
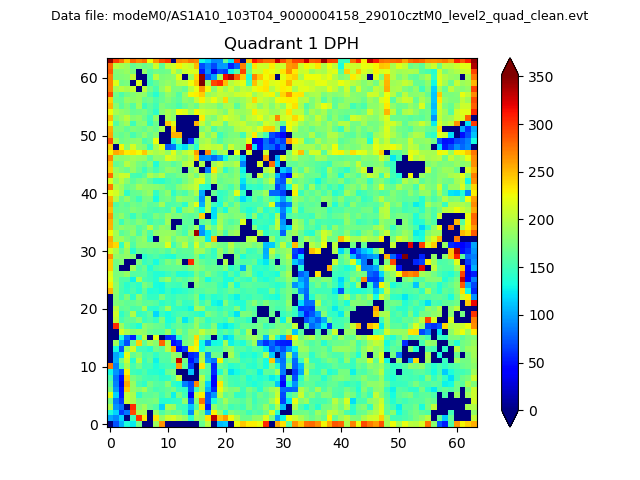
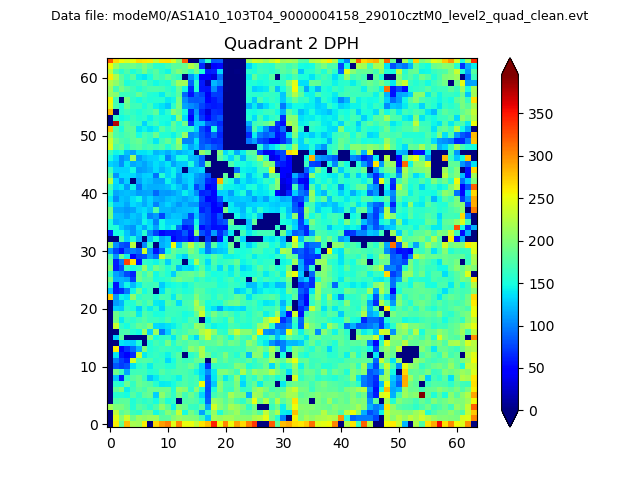
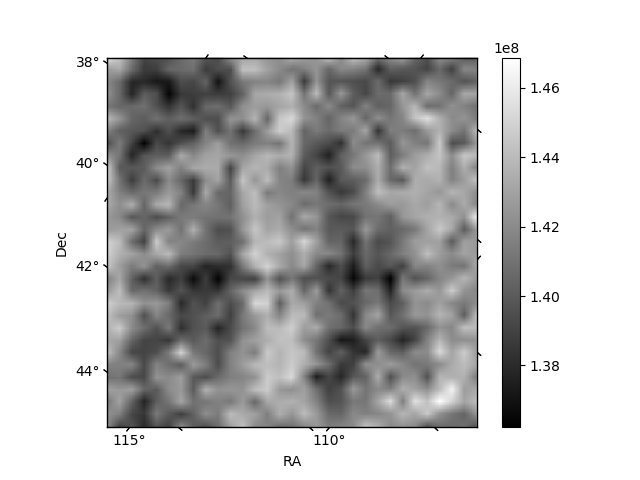
Histogram calculated using DETX and DETY for each event in the final _common_clean file
| Quadrant A | 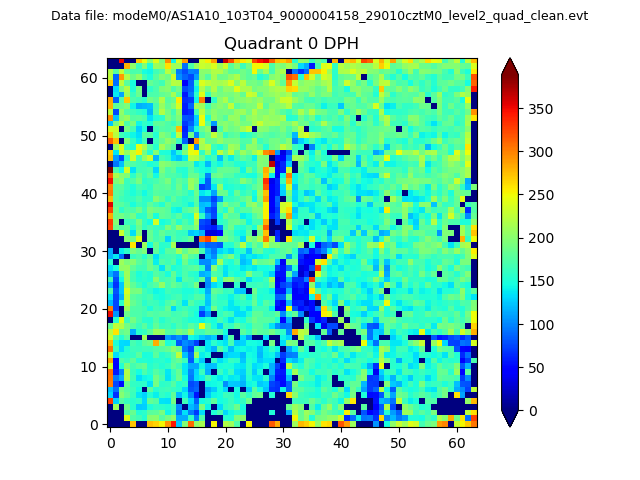 |
 |
Quadrant B |
|---|---|---|---|
| Quadrant D | 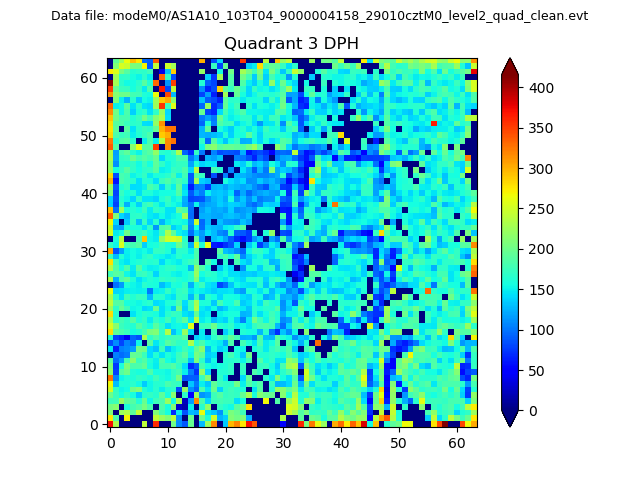 |
 |
Quadrant C |
| Plot type | Count rate plots | Images |
|---|---|---|
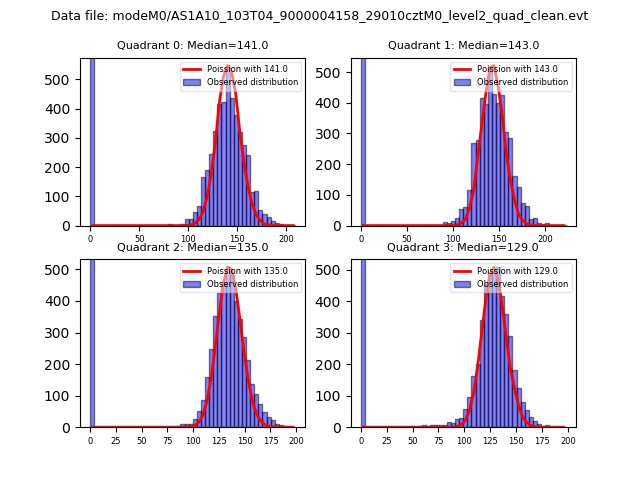
| Comparison with Poisson distribution Blue bars denote a histogram of data divided into 1 sec bins. Red curve is a Poisson curve with rate = median count rate of data. |
 |
 |
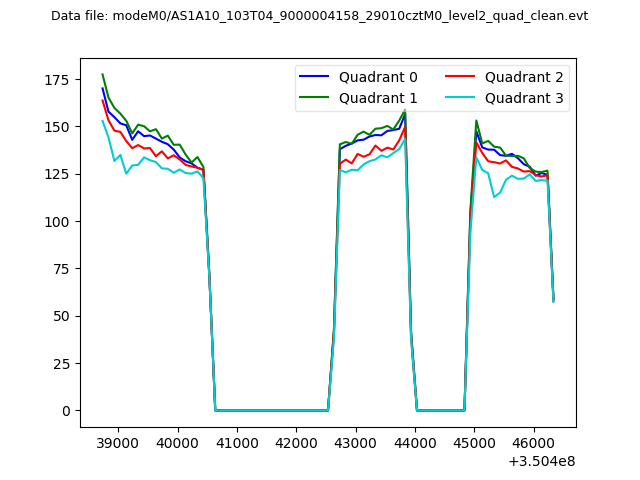
| Quadrant-wise count rates Data is divided into 100 sec bins |
 |
|
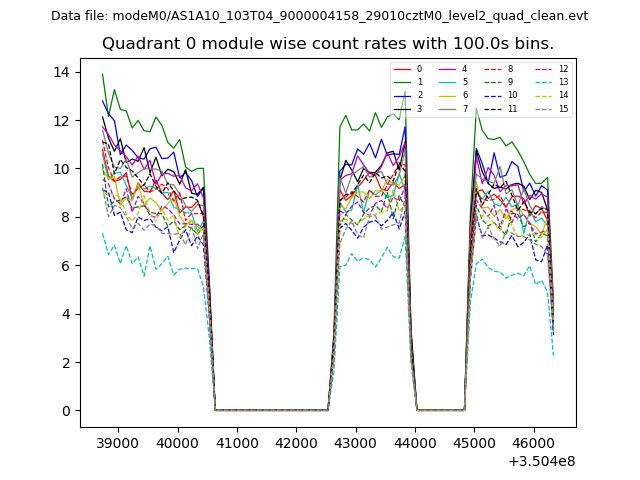
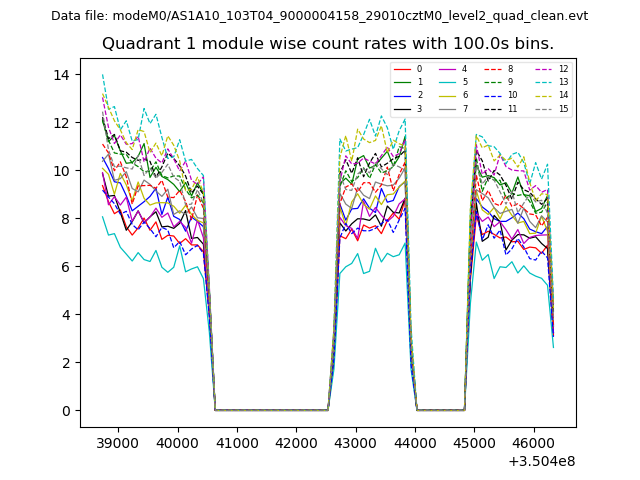
| Module-wise count rates for Quadrant A Data is divided into 100 sec bins |
 |
 |
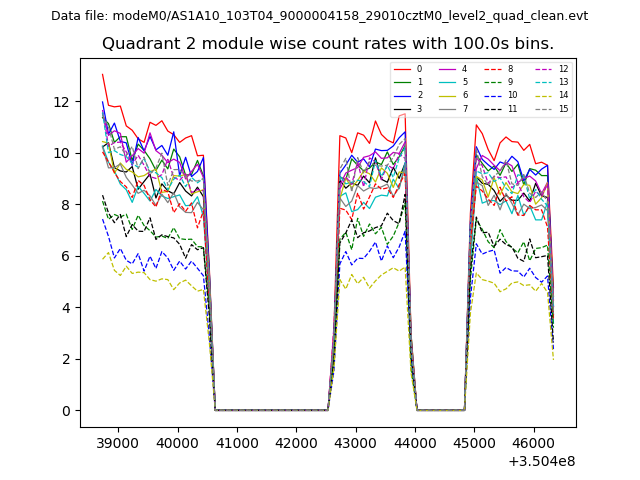
| Module-wise count rates for Quadrant B Data is divided into 100 sec bins |
 |
 |
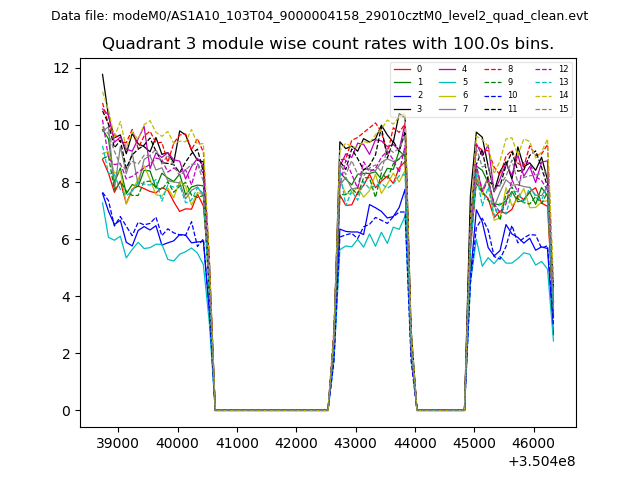
| Module-wise count rates for Quadrant C Data is divided into 100 sec bins |
 |
 |
| Module-wise count rates for Quadrant D Data is divided into 100 sec bins |
 |
 |
| Parameter | Plot |
|---|---|
| CZT HV Monitor | 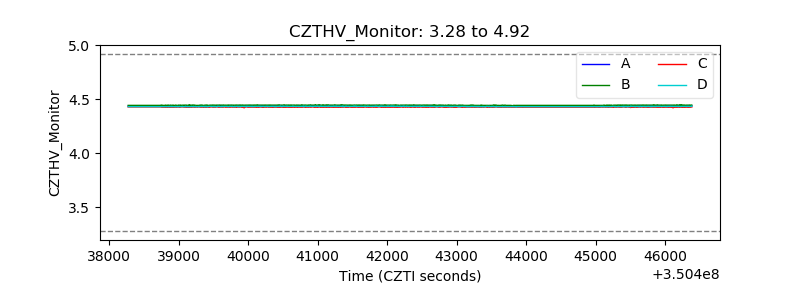 |
| D_VDD | 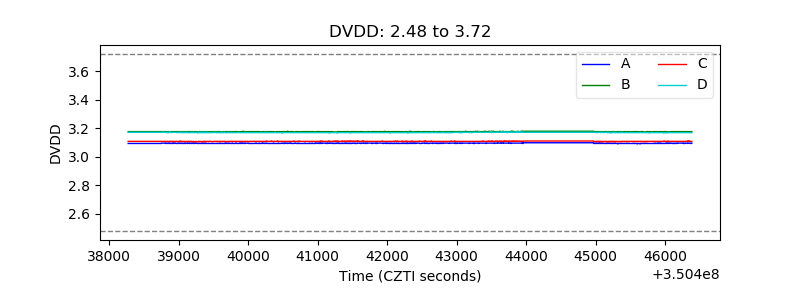 |
| Temperature 1 | 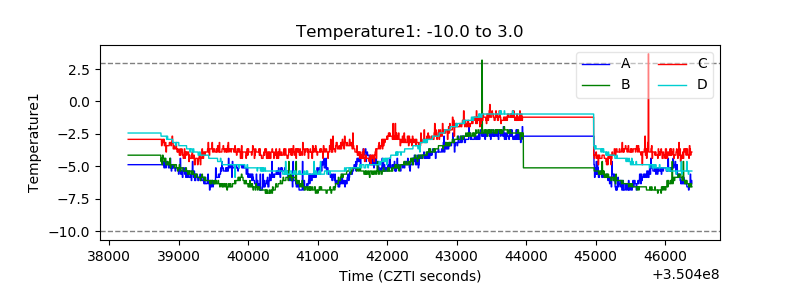 |
| Veto HV Monitor | 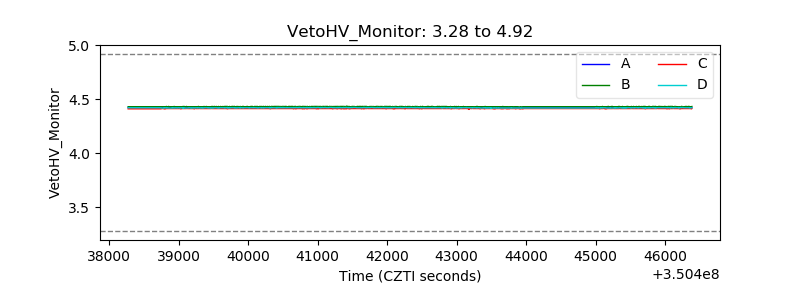 |
| Veto LLD | 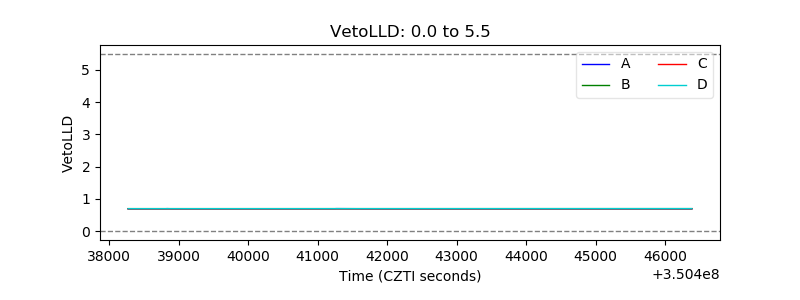 |
| Alpha Counter | 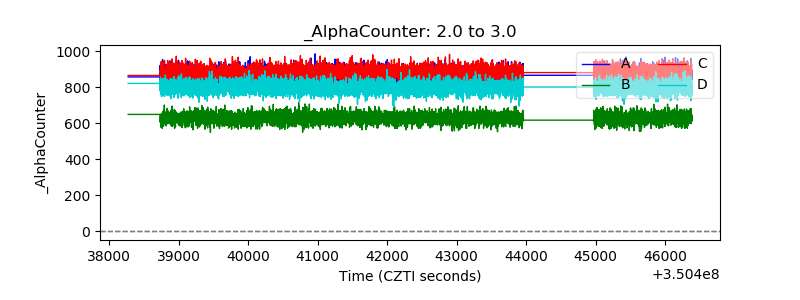 |
| _CPM_Rate | 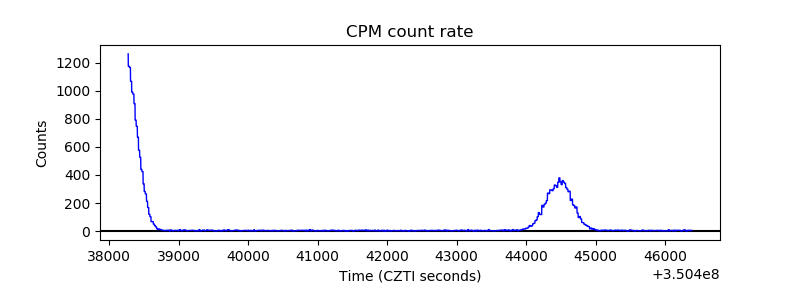 |
| CZT Counter | 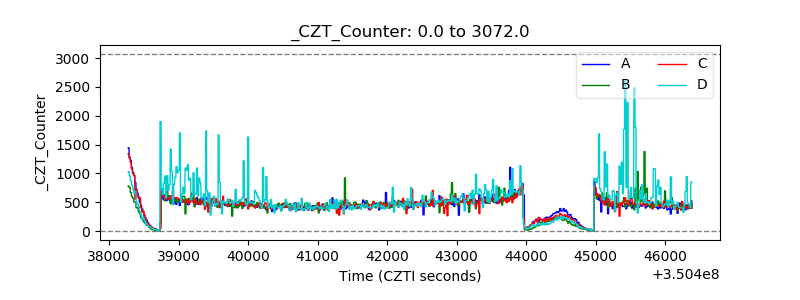 |
| +2.5 Volts monitor |  |
| +5 Volts monitor | 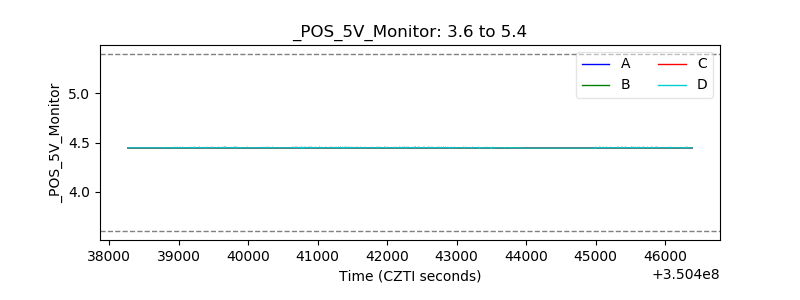 |
| _ROLL_ROT | 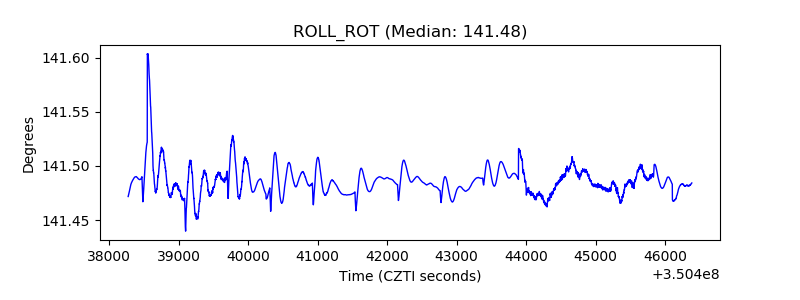 |
| _Roll_DEC |  |
| _Roll_RA | 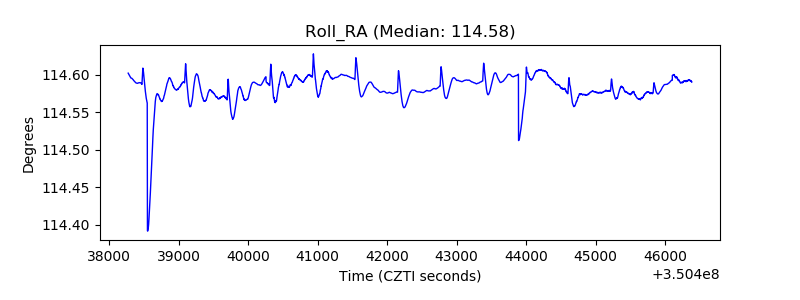 |
| Veto Counter | 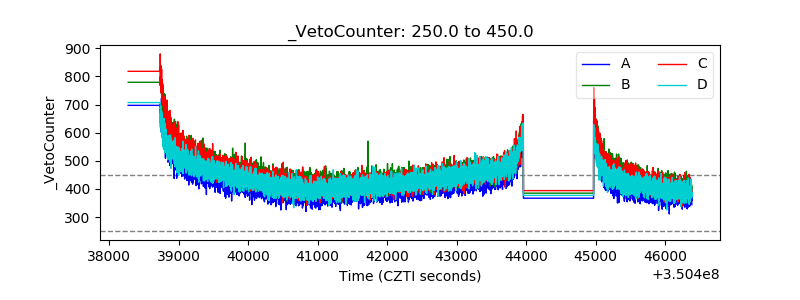 |