| Param | Original file | Final file |
|---|---|---|
| Filename | modeM0/AS1A10_103T04_9000004158_29011cztM0_level2.evt | modeM0/AS1A10_103T04_9000004158_29011cztM0_level2_quad_clean.evt |
| Size (bytes) | 518,659,200 | 97,421,760 |
| Size | 494.6 MB | 92.9 MB |
| Events in quadrant A | 3,345,484 | 633,585 |
| Events in quadrant B | 3,597,688 | 639,253 |
| Events in quadrant C | 3,425,732 | 608,917 |
| Events in quadrant D | 4,853,016 | 570,287 |
| Mode M9 | |||
|---|---|---|---|
| Quadrant | BADHDUFLAG | Total packets | Discarded packets |
| A | 0 | 5 | 0 |
| B | 0 | 5 | 0 |
| C | 0 | 5 | 0 |
| D | 0 | 5 | 0 |
| Mode M0 | |||
|---|---|---|---|
| Quadrant | BADHDUFLAG | Total packets | Discarded packets |
| A | 0 | 14660 | 2 |
| B | 0 | 15328 | 2 |
| C | 0 | 14726 | 2 |
| D | 0 | 19244 | 2 |
| Mode SS | |||
|---|---|---|---|
| Quadrant | BADHDUFLAG | Total packets | Discarded packets |
| A | 0 | 146 | 0 |
| B | 0 | 146 | 0 |
| C | 0 | 146 | 0 |
| D | 0 | 146 | 0 |
| Quadrant | Total seconds | Saturated seconds | Saturation percentage |
|---|---|---|---|
| A | 7151 | 53 | 0.741155% |
| B | 7152 | 107 | 1.496085% |
| C | 7151 | 91 | 1.272549% |
| D | 7151 | 325 | 4.544819% |
Noise dominated data is calculated using 1-second bins in cleaned event files. If a bin has >2000 counts, and if more than 50% of those come from <1% of pixels, then it is considered to be noise-dominated and hence unusable.
| Quadrant | # 1 sec bins | Bins with >0 counts | Bins with >2000 counts | High rate bins dominated by noise | Noise dominated (total time) | Noise dominated (detector-on time) | Marked lightcurve |
|---|---|---|---|---|---|---|---|
| A | 7681 | 7152 | 0 | 0 | 0.00% | 0.00% | 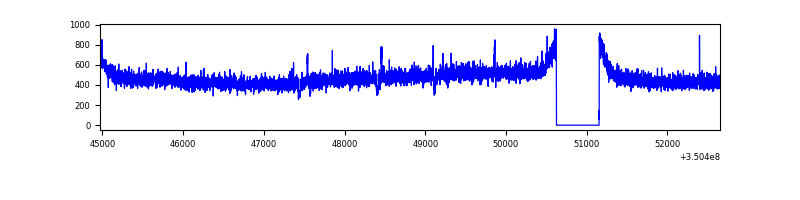 |
| B | 7682 | 7153 | 13 | 13 | 0.17% | 0.18% | 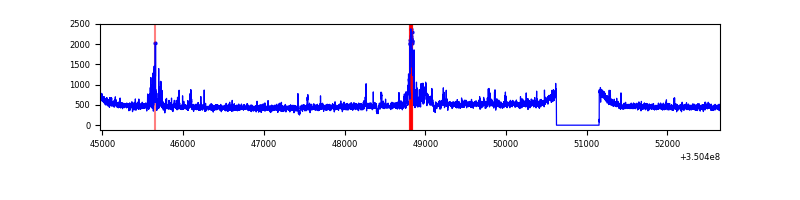 |
| C | 7681 | 7152 | 0 | 0 | 0.00% | 0.00% | 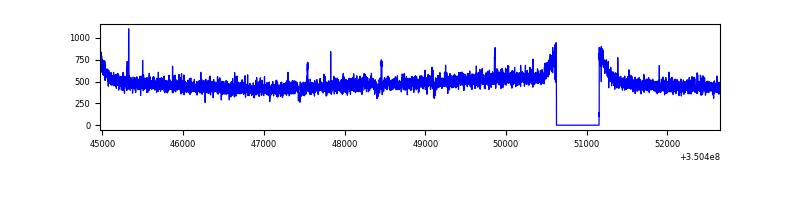 |
| D | 7681 | 7151 | 245 | 245 | 3.19% | 3.43% | 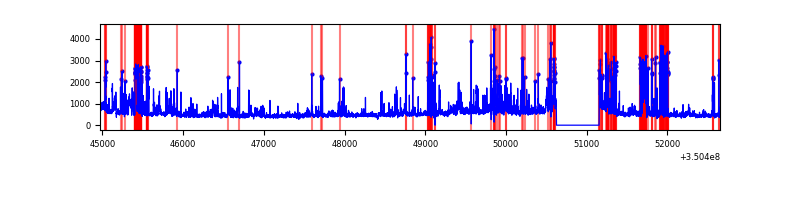 |
Top three noisy pixels from each quadrant. If the there are fewer than three noisy pixels in the level2.evt file, extra rows are filled as -1
| Pixel properties | Quadrant properties | ||||||
|---|---|---|---|---|---|---|---|
| Quadrant | DetID | PixID | Counts | Sigma | Mean | Median | Sigma |
| A | 13 | 254 | 11529 | 61.59 | 865 | 848 | 173.4 |
| A | 3 | 137 | 8833 | 46.05 | 865 | 848 | 173.4 |
| A | 0 | 226 | 7338 | 37.43 | 865 | 848 | 173.4 |
| B | 4 | 80 | 123119 | 742.43 | 861 | 840 | 164.7 |
| B | 10 | 246 | 52249 | 312.14 | 861 | 840 | 164.7 |
| B | 0 | 190 | 24877 | 145.94 | 861 | 840 | 164.7 |
| C | 14 | 238 | 132880 | 666.17 | 836 | 840 | 198.2 |
| C | 2 | 114 | 16733 | 80.18 | 836 | 840 | 198.2 |
| C | 3 | 233 | 13710 | 64.93 | 836 | 840 | 198.2 |
| D | 1 | 52 | 1214056 | 6248.24 | 815 | 793 | 194.2 |
| D | 8 | 195 | 482165 | 2479.04 | 815 | 793 | 194.2 |
| D | 2 | 250 | 50595 | 256.48 | 815 | 793 | 194.2 |
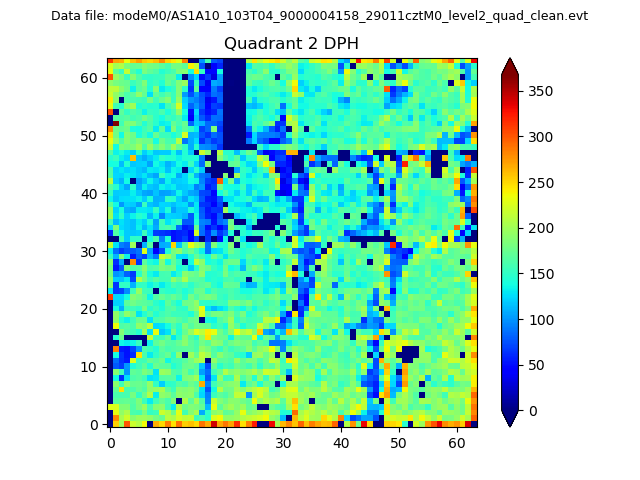
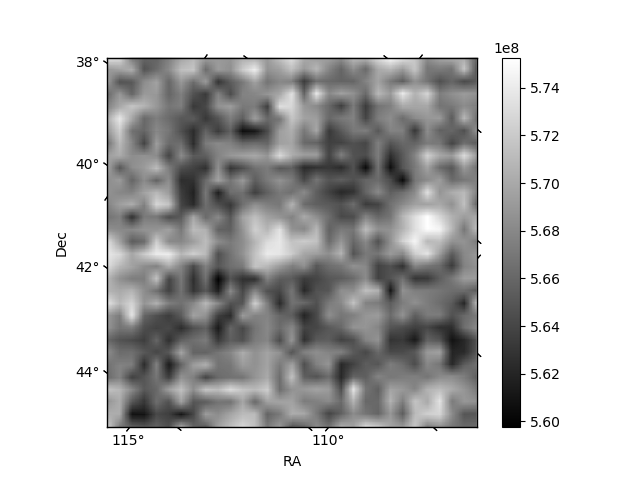
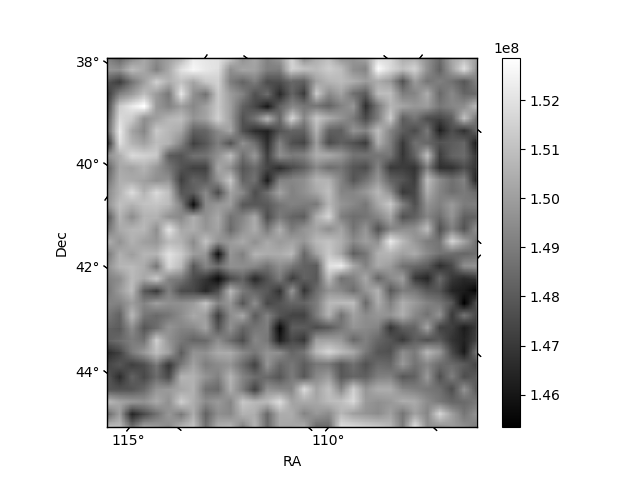
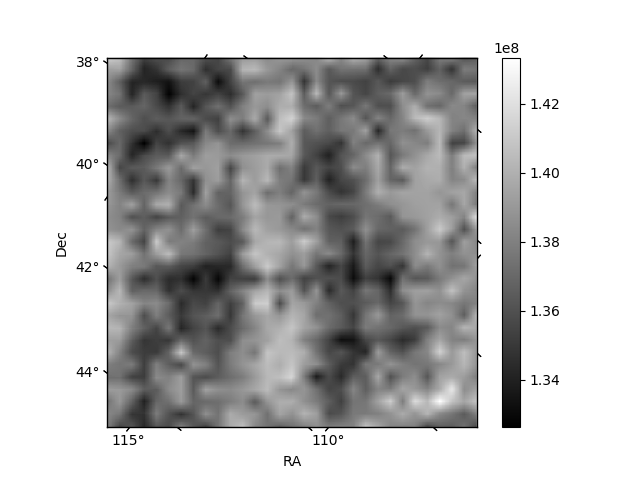
Histogram calculated using DETX and DETY for each event in the final _common_clean file
| Quadrant A | 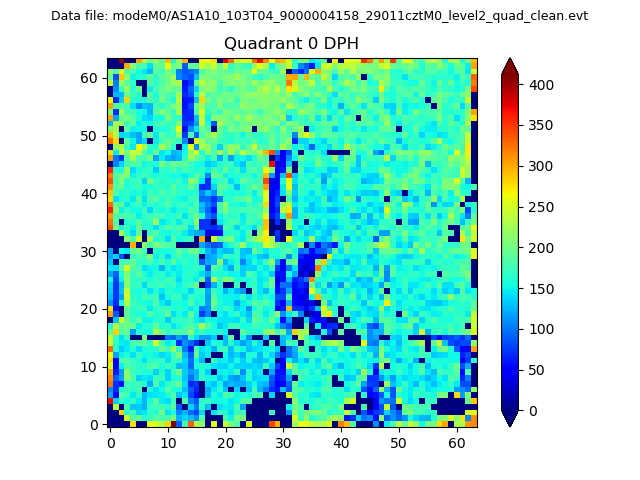 |
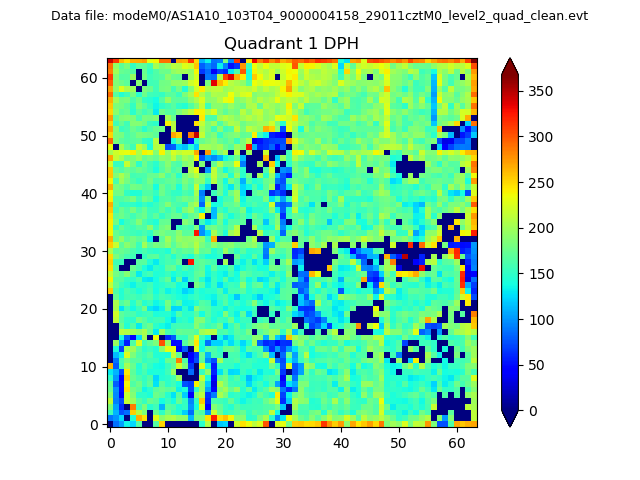 |
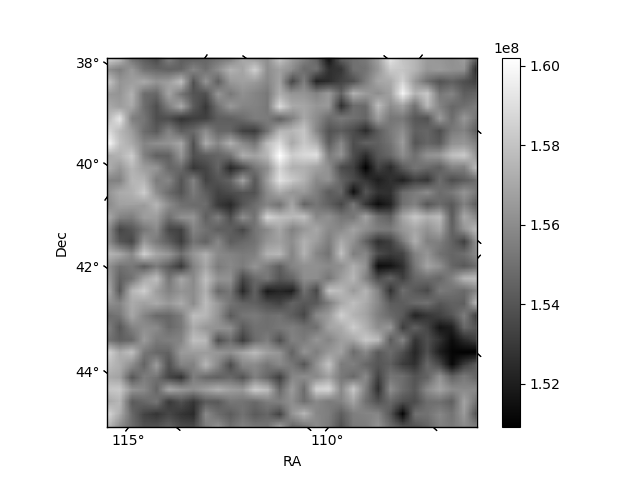
Quadrant B |
|---|---|---|---|
| Quadrant D | 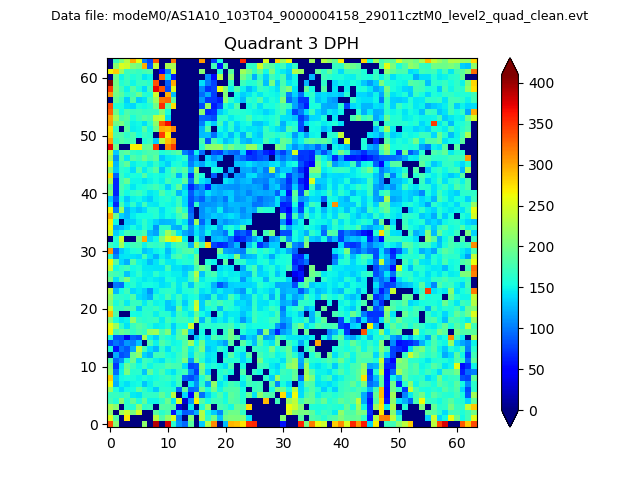 |
 |
Quadrant C |
| Plot type | Count rate plots | Images |
|---|---|---|
| Comparison with Poisson distribution Blue bars denote a histogram of data divided into 1 sec bins. Red curve is a Poisson curve with rate = median count rate of data. |
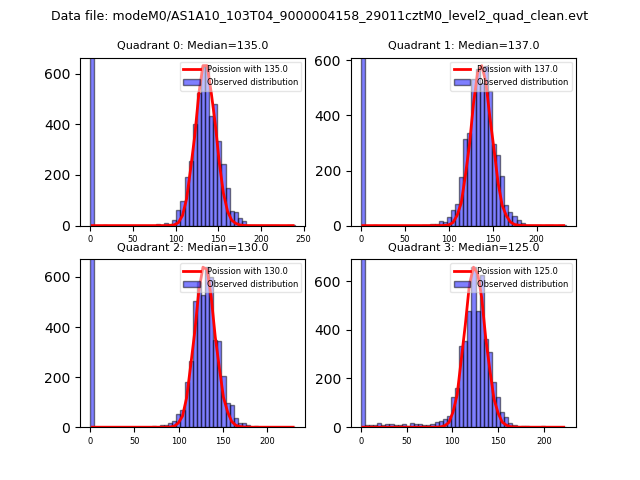 |
 |
| Quadrant-wise count rates Data is divided into 100 sec bins |
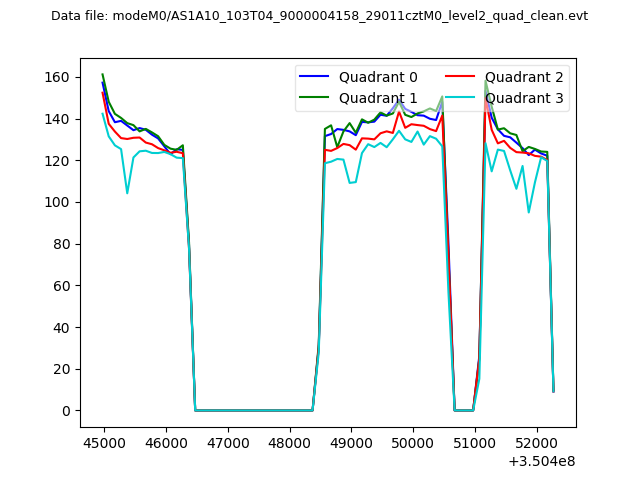 |
|
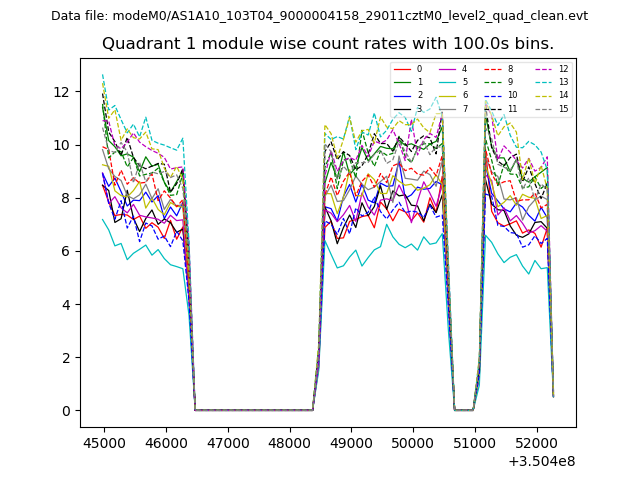
| Module-wise count rates for Quadrant A Data is divided into 100 sec bins |
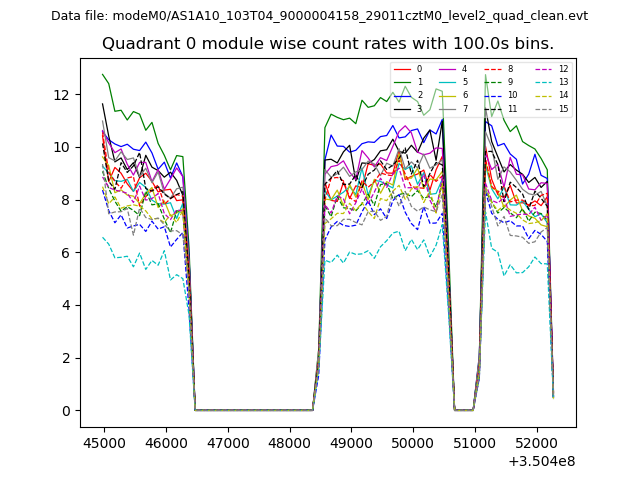 |
 |
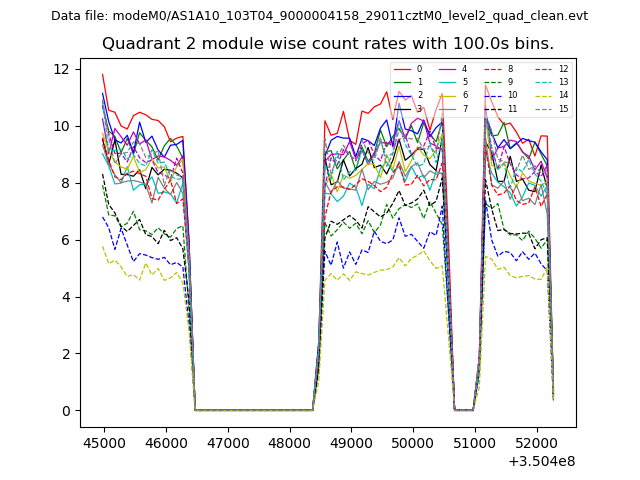
| Module-wise count rates for Quadrant B Data is divided into 100 sec bins |
 |
 |
| Module-wise count rates for Quadrant C Data is divided into 100 sec bins |
 |
 |
| Module-wise count rates for Quadrant D Data is divided into 100 sec bins |
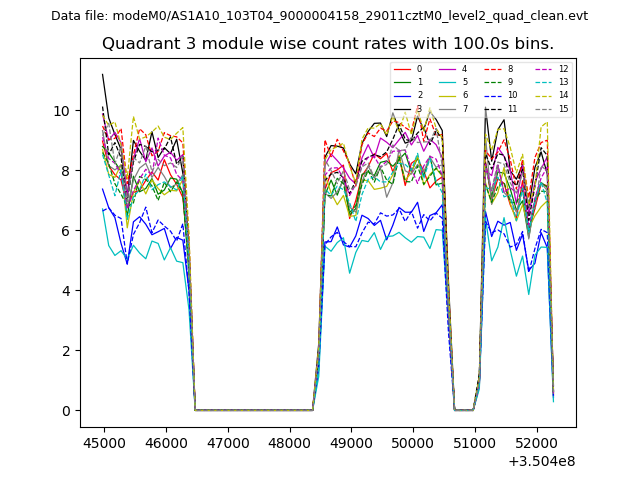 |
 |
| Parameter | Plot |
|---|---|
| CZT HV Monitor | 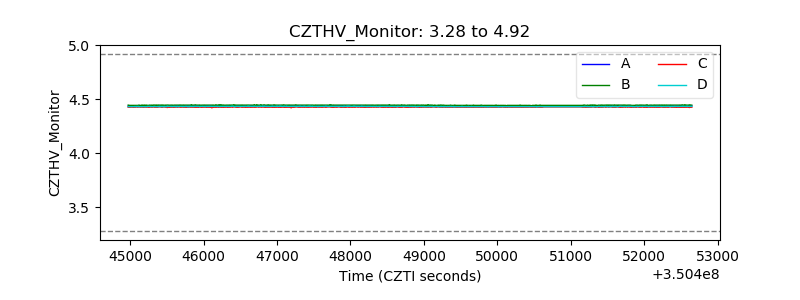 |
| D_VDD | 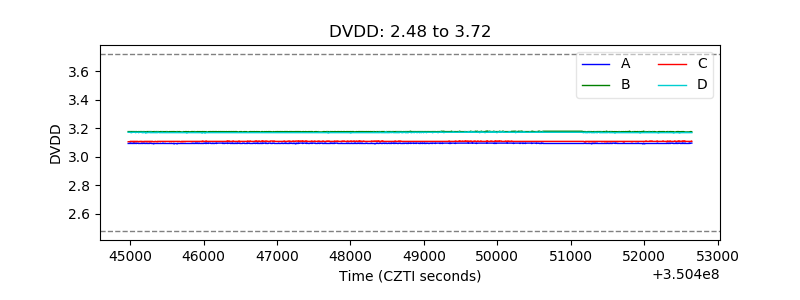 |
| Temperature 1 | 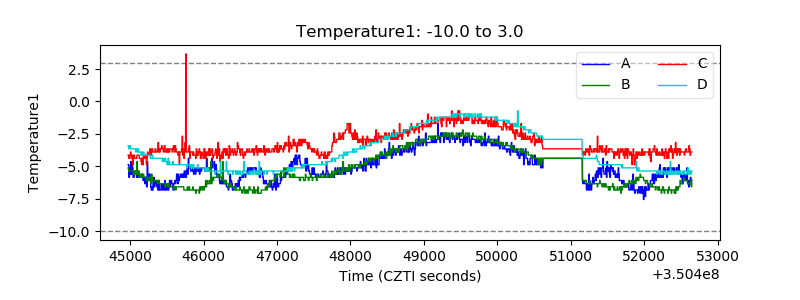 |
| Veto HV Monitor | 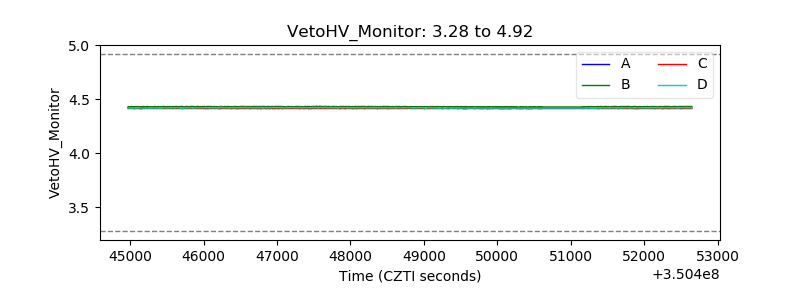 |
| Veto LLD | 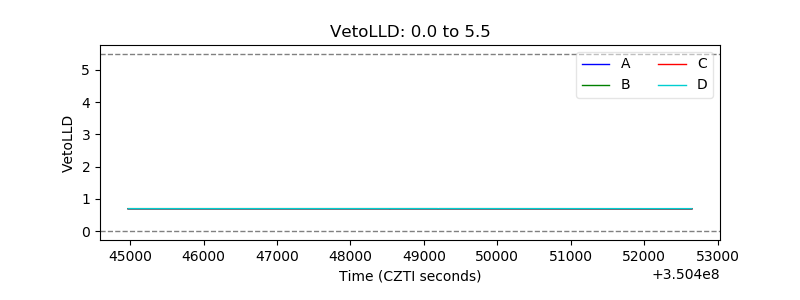 |
| Alpha Counter | 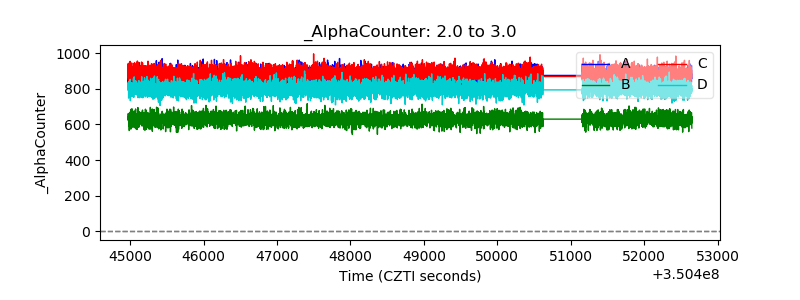 |
| _CPM_Rate | 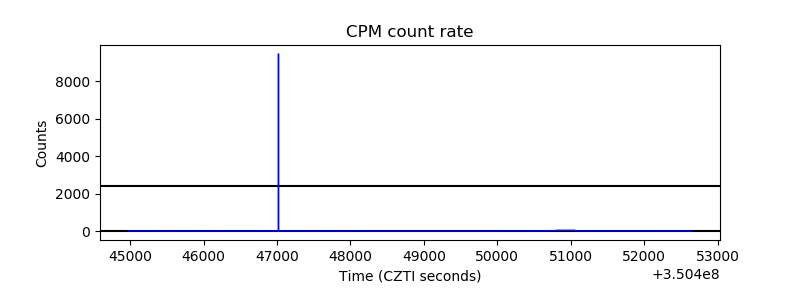 |
| CZT Counter | 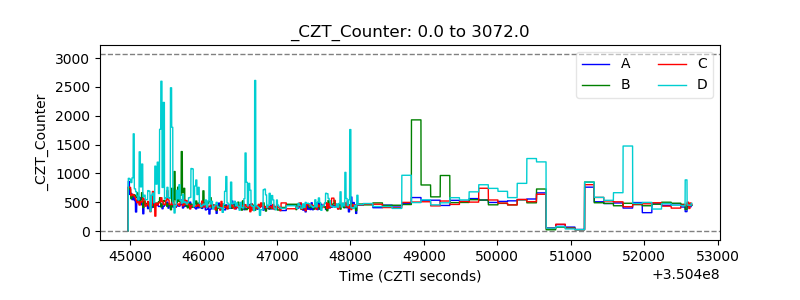 |
| +2.5 Volts monitor |  |
| +5 Volts monitor |  |
| _ROLL_ROT | 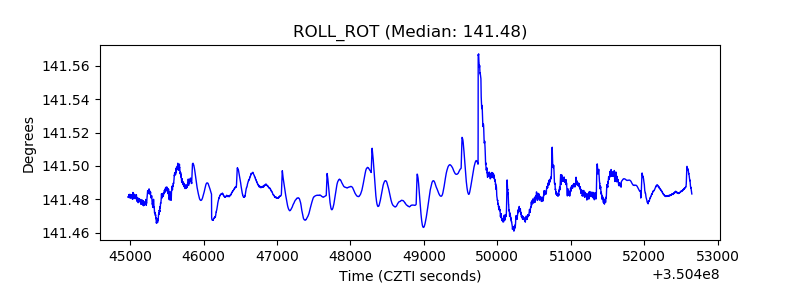 |
| _Roll_DEC | 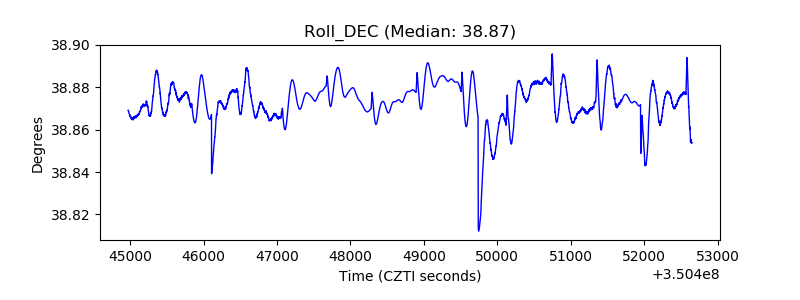 |
| _Roll_RA | 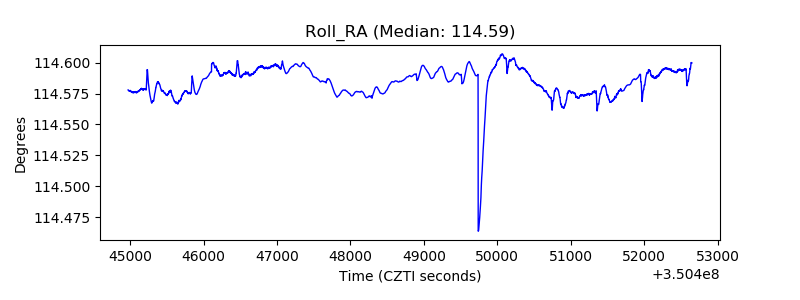 |
| Veto Counter | 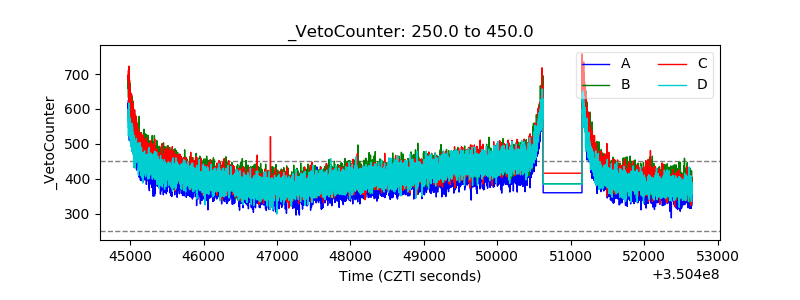 |