| Param | Original file | Final file |
|---|---|---|
| Filename | modeM0/AS1A10_103T04_9000004158_29012cztM0_level2.evt | modeM0/AS1A10_103T04_9000004158_29012cztM0_level2_quad_clean.evt |
| Size (bytes) | 614,352,960 | 112,760,640 |
| Size | 585.9 MB | 107.5 MB |
| Events in quadrant A | 3,986,940 | 731,825 |
| Events in quadrant B | 4,107,392 | 739,418 |
| Events in quadrant C | 4,084,343 | 700,595 |
| Events in quadrant D | 5,858,559 | 660,515 |
| Mode M9 | |||
|---|---|---|---|
| Quadrant | BADHDUFLAG | Total packets | Discarded packets |
| A | 0 | 7 | 0 |
| B | 0 | 7 | 0 |
| C | 0 | 7 | 0 |
| D | 0 | 7 | 0 |
| Mode M0 | |||
|---|---|---|---|
| Quadrant | BADHDUFLAG | Total packets | Discarded packets |
| A | 0 | 17337 | 2 |
| B | 0 | 17512 | 2 |
| C | 0 | 17465 | 2 |
| D | 0 | 23131 | 2 |
| Mode SS | |||
|---|---|---|---|
| Quadrant | BADHDUFLAG | Total packets | Discarded packets |
| A | 0 | 174 | 0 |
| B | 0 | 174 | 0 |
| C | 0 | 174 | 0 |
| D | 0 | 174 | 0 |
| Quadrant | Total seconds | Saturated seconds | Saturation percentage |
|---|---|---|---|
| A | 8375 | 117 | 1.397015% |
| B | 8376 | 193 | 2.304202% |
| C | 8376 | 184 | 2.196753% |
| D | 8376 | 372 | 4.441261% |
Noise dominated data is calculated using 1-second bins in cleaned event files. If a bin has >2000 counts, and if more than 50% of those come from <1% of pixels, then it is considered to be noise-dominated and hence unusable.
| Quadrant | # 1 sec bins | Bins with >0 counts | Bins with >2000 counts | High rate bins dominated by noise | Noise dominated (total time) | Noise dominated (detector-on time) | Marked lightcurve |
|---|---|---|---|---|---|---|---|
| A | 9105 | 8377 | 0 | 0 | 0.00% | 0.00% | 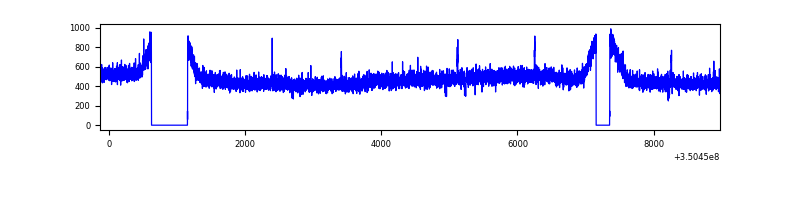 |
| B | 9106 | 8378 | 0 | 0 | 0.00% | 0.00% | 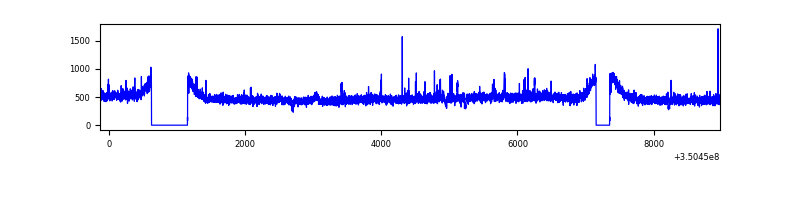 |
| C | 9106 | 8378 | 0 | 0 | 0.00% | 0.00% | 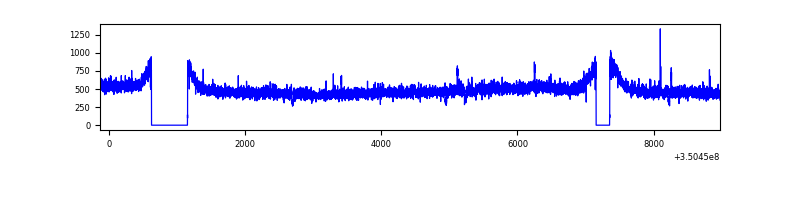 |
| D | 9106 | 8378 | 264 | 264 | 2.90% | 3.15% | 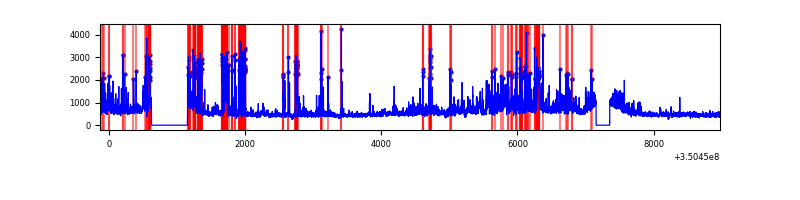 |
Top three noisy pixels from each quadrant. If the there are fewer than three noisy pixels in the level2.evt file, extra rows are filled as -1
| Pixel properties | Quadrant properties | ||||||
|---|---|---|---|---|---|---|---|
| Quadrant | DetID | PixID | Counts | Sigma | Mean | Median | Sigma |
| A | 13 | 254 | 12935 | 57.03 | 1033 | 1008 | 209.1 |
| A | 3 | 137 | 10508 | 45.43 | 1033 | 1008 | 209.1 |
| A | 0 | 226 | 8685 | 36.71 | 1033 | 1008 | 209.1 |
| B | 12 | 111 | 25568 | 124.15 | 1027 | 1000 | 197.9 |
| B | 0 | 229 | 24225 | 117.36 | 1027 | 1000 | 197.9 |
| B | 11 | 111 | 22905 | 110.69 | 1027 | 1000 | 197.9 |
| C | 14 | 238 | 156605 | 660.47 | 998 | 1005 | 235.6 |
| C | 2 | 114 | 19946 | 80.4 | 998 | 1005 | 235.6 |
| C | 3 | 233 | 10257 | 39.27 | 998 | 1005 | 235.6 |
| D | 1 | 52 | 1282901 | 5432.63 | 980 | 952 | 236.0 |
| D | 8 | 195 | 653137 | 2763.82 | 980 | 952 | 236.0 |
| D | 7 | 80 | 71102 | 297.28 | 980 | 952 | 236.0 |
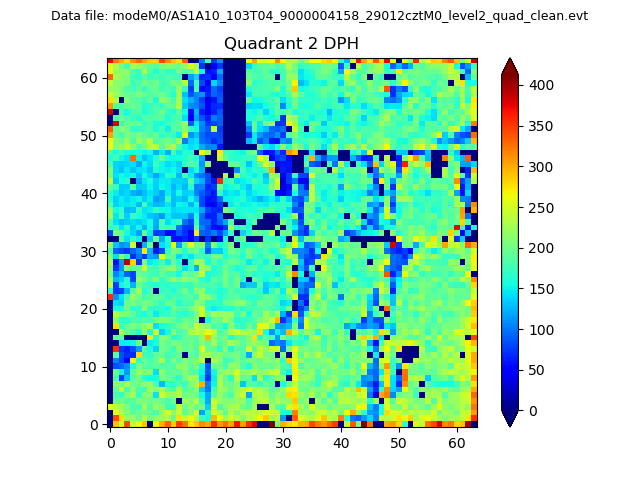
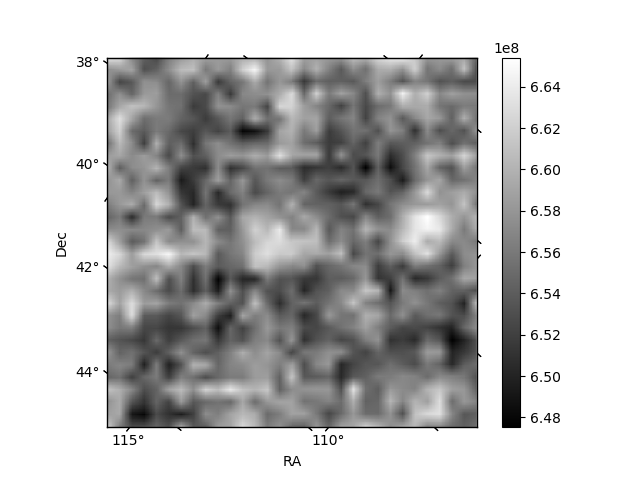
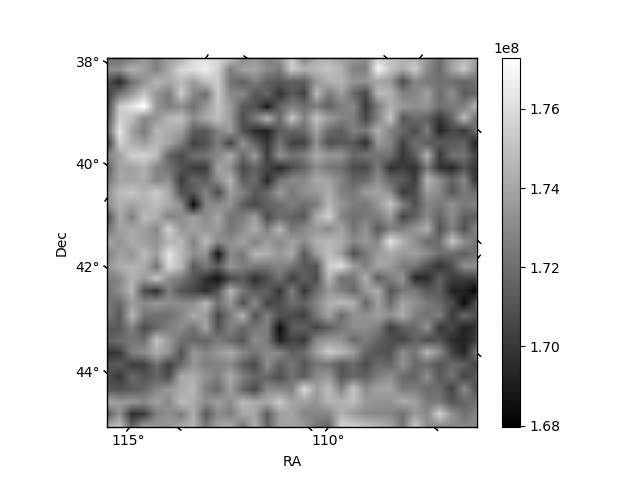
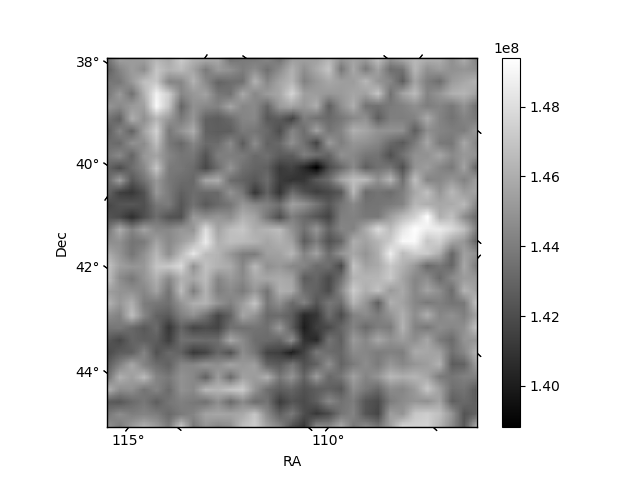
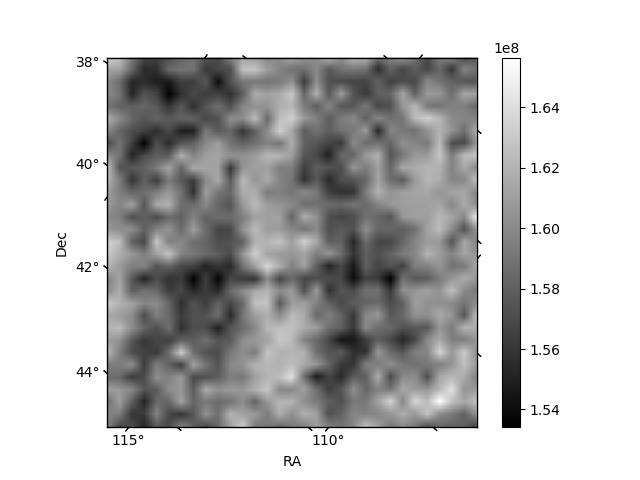
Histogram calculated using DETX and DETY for each event in the final _common_clean file
| Quadrant A | 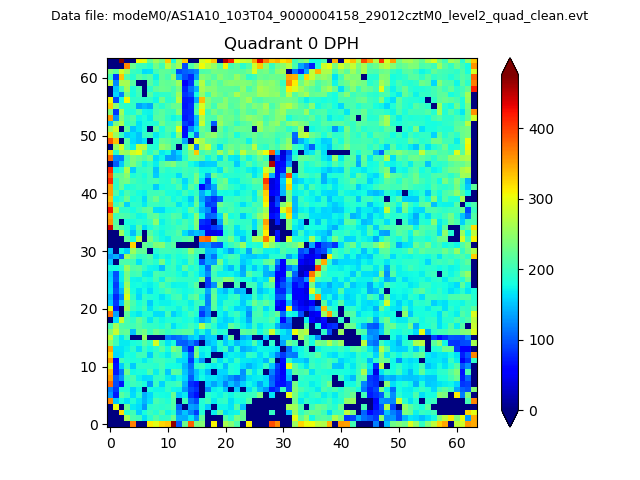 |
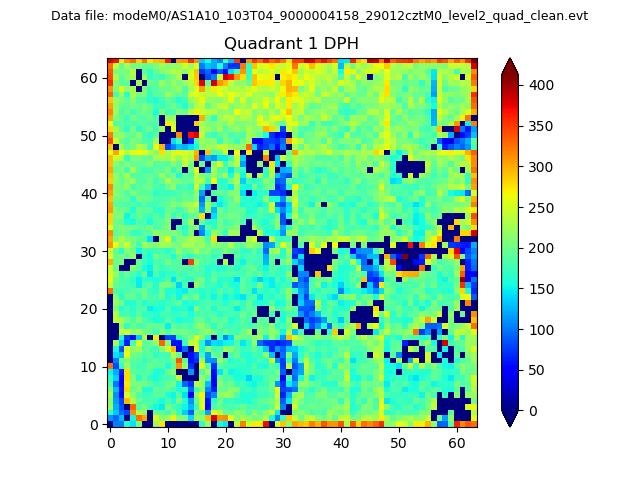 |
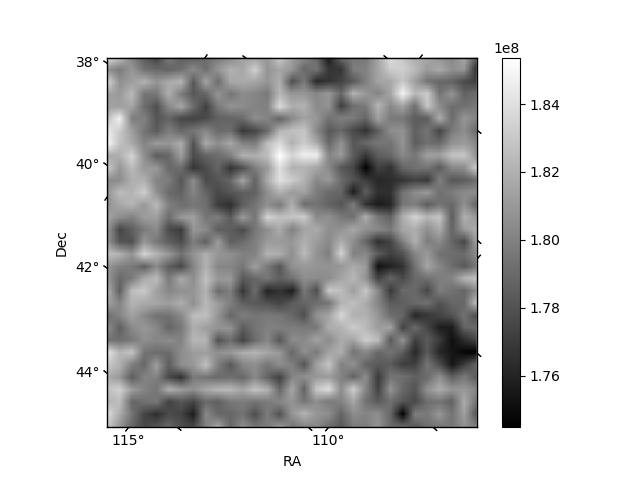
Quadrant B |
|---|---|---|---|
| Quadrant D | 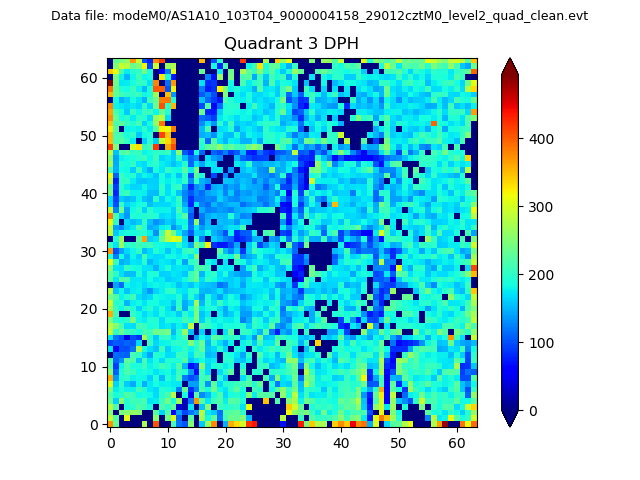 |
 |
Quadrant C |
| Plot type | Count rate plots | Images |
|---|---|---|
| Comparison with Poisson distribution Blue bars denote a histogram of data divided into 1 sec bins. Red curve is a Poisson curve with rate = median count rate of data. |
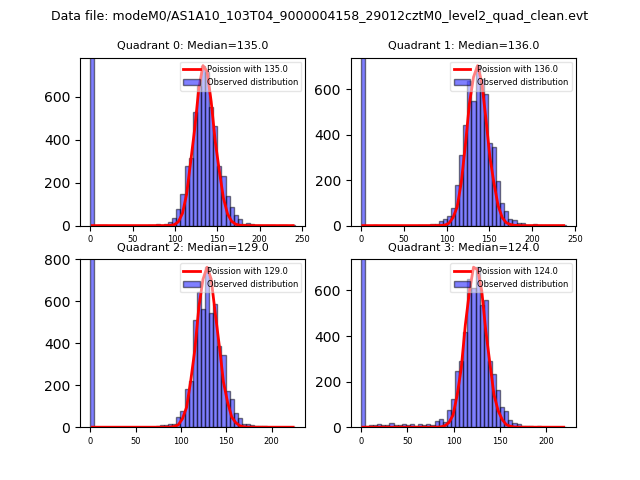 |
 |
| Quadrant-wise count rates Data is divided into 100 sec bins |
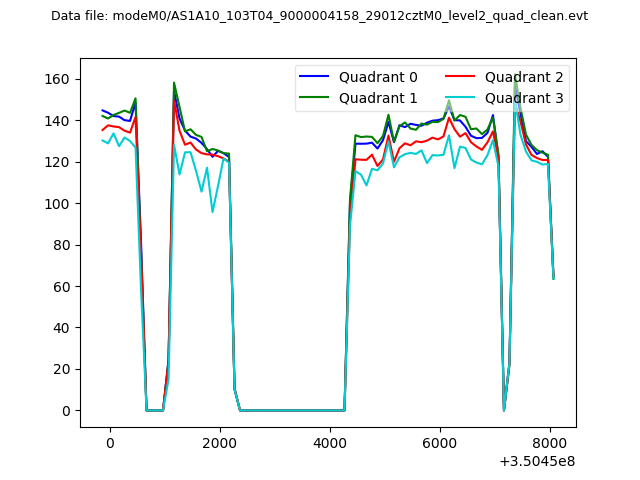 |
|
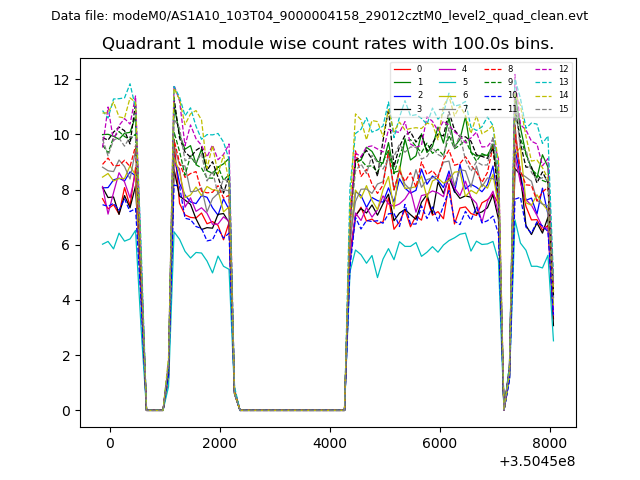
| Module-wise count rates for Quadrant A Data is divided into 100 sec bins |
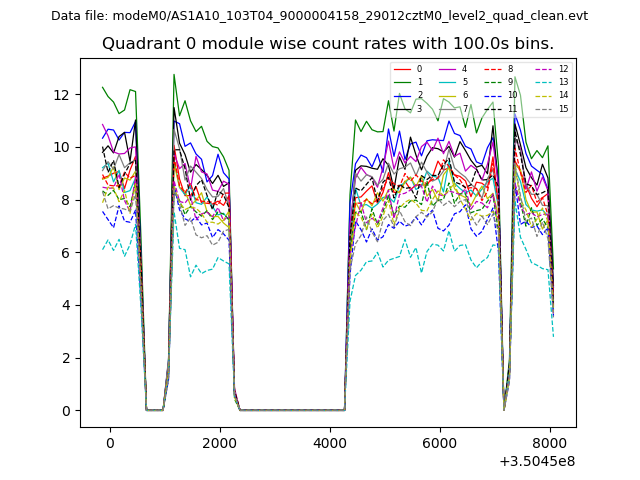 |
 |
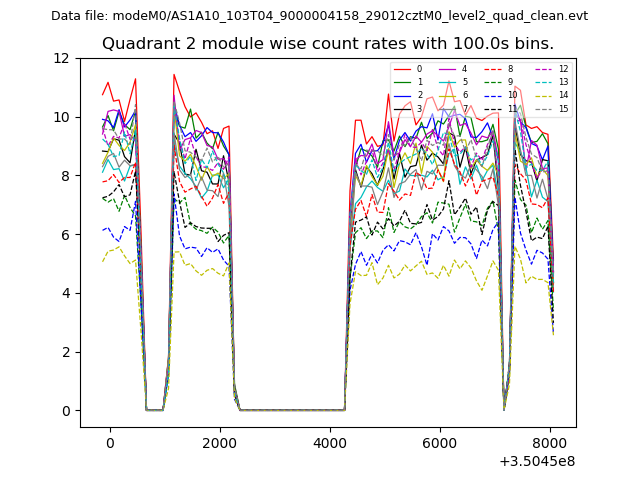
| Module-wise count rates for Quadrant B Data is divided into 100 sec bins |
 |
 |
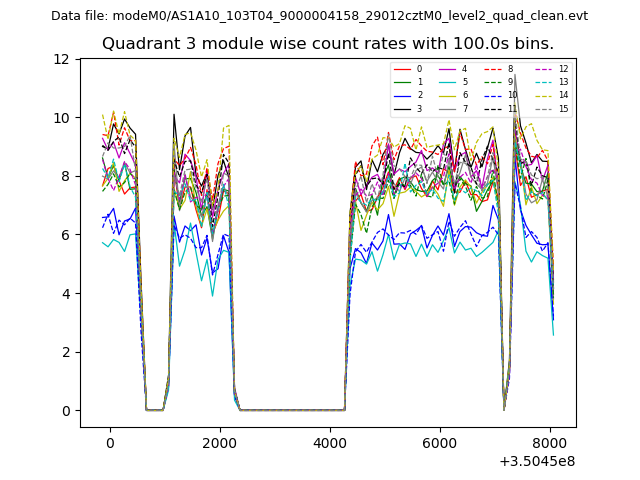
| Module-wise count rates for Quadrant C Data is divided into 100 sec bins |
 |
 |
| Module-wise count rates for Quadrant D Data is divided into 100 sec bins |
 |
 |
| Parameter | Plot |
|---|---|
| CZT HV Monitor | 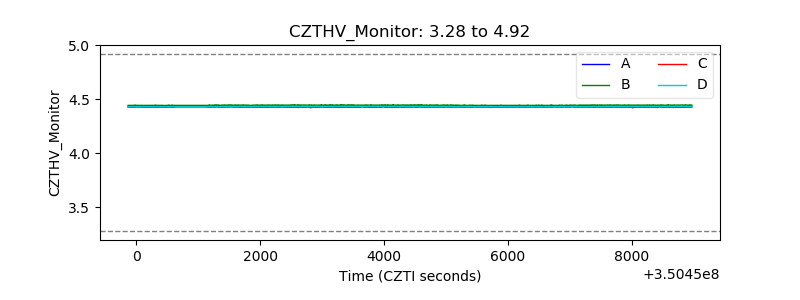 |
| D_VDD |  |
| Temperature 1 | 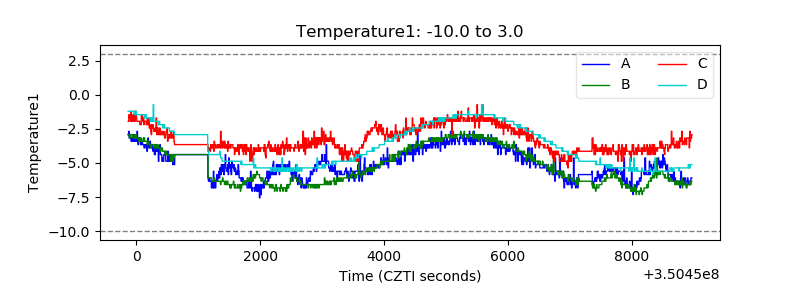 |
| Veto HV Monitor | 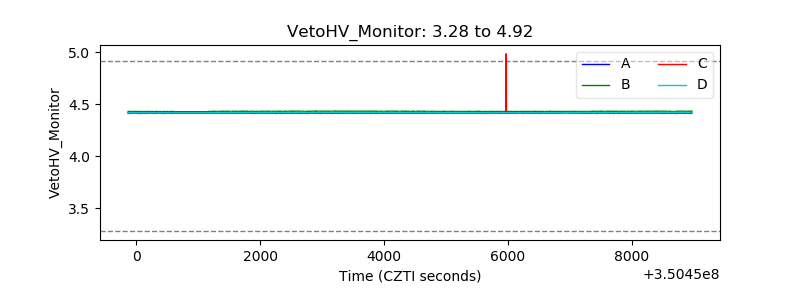 |
| Veto LLD | 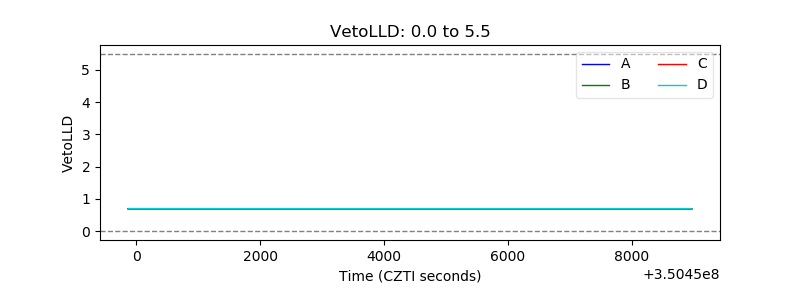 |
| Alpha Counter | 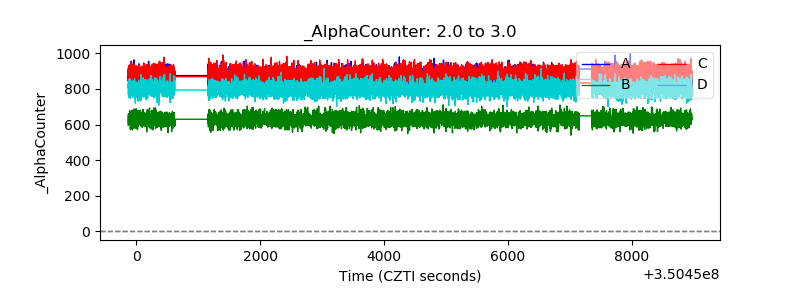 |
| _CPM_Rate | 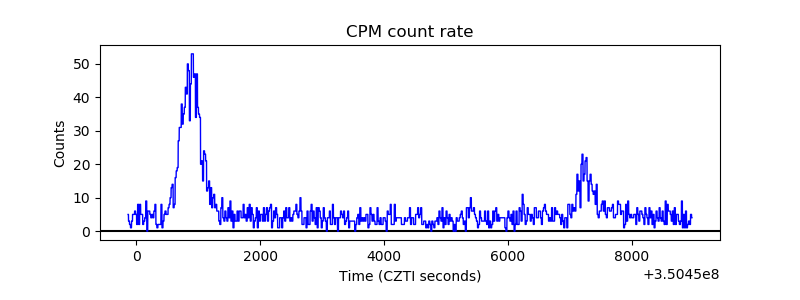 |
| CZT Counter | 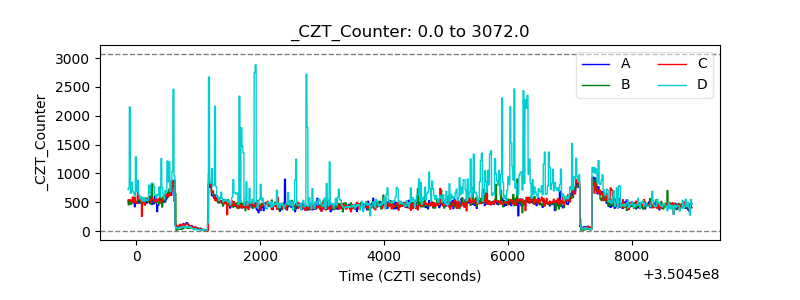 |
| +2.5 Volts monitor |  |
| +5 Volts monitor | 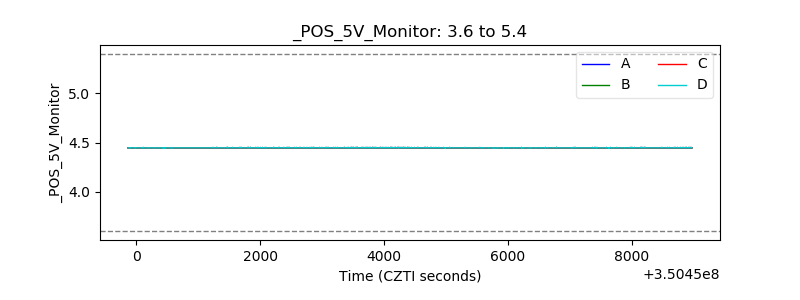 |
| _ROLL_ROT | 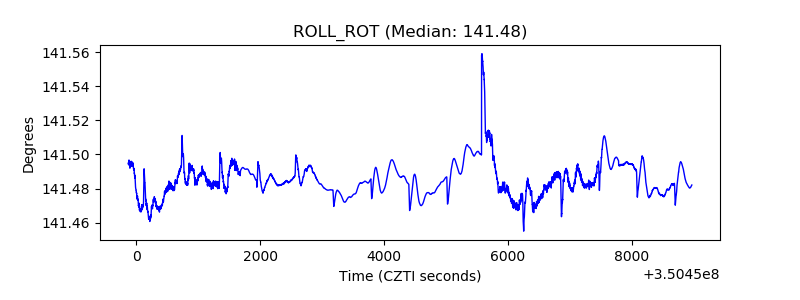 |
| _Roll_DEC | 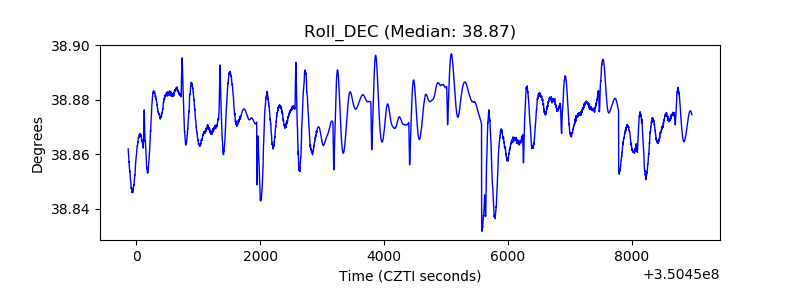 |
| _Roll_RA | 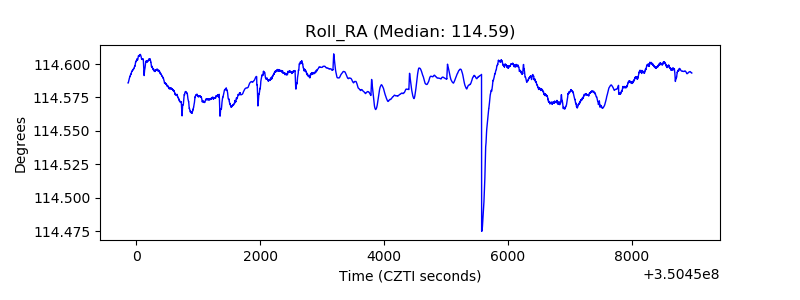 |
| Veto Counter | 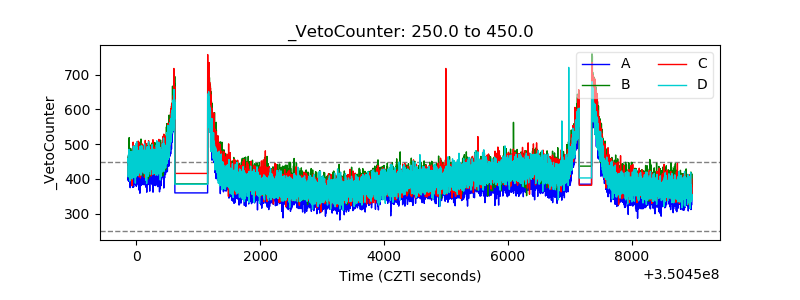 |