| Param | Original file | Final file |
|---|---|---|
| Filename | modeM0/AS1A10_103T04_9000004158_29013cztM0_level2.evt | modeM0/AS1A10_103T04_9000004158_29013cztM0_level2_quad_clean.evt |
| Size (bytes) | 605,946,240 | 105,603,840 |
| Size | 577.9 MB | 100.7 MB |
| Events in quadrant A | 4,044,246 | 669,767 |
| Events in quadrant B | 4,266,565 | 677,856 |
| Events in quadrant C | 4,159,900 | 643,786 |
| Events in quadrant D | 5,305,779 | 618,042 |
| Mode M9 | |||
|---|---|---|---|
| Quadrant | BADHDUFLAG | Total packets | Discarded packets |
| A | 0 | 5 | 0 |
| B | 0 | 5 | 0 |
| C | 0 | 5 | 0 |
| D | 0 | 5 | 0 |
| Mode M0 | |||
|---|---|---|---|
| Quadrant | BADHDUFLAG | Total packets | Discarded packets |
| A | 0 | 17560 | 3 |
| B | 0 | 17956 | 2 |
| C | 0 | 17752 | 2 |
| D | 0 | 21581 | 2 |
| Mode SS | |||
|---|---|---|---|
| Quadrant | BADHDUFLAG | Total packets | Discarded packets |
| A | 0 | 174 | 0 |
| B | 0 | 174 | 0 |
| C | 0 | 174 | 0 |
| D | 0 | 174 | 0 |
| Quadrant | Total seconds | Saturated seconds | Saturation percentage |
|---|---|---|---|
| A | 8470 | 161 | 1.900826% |
| B | 8471 | 244 | 2.880416% |
| C | 8471 | 200 | 2.360996% |
| D | 8471 | 130 | 1.534648% |
Noise dominated data is calculated using 1-second bins in cleaned event files. If a bin has >2000 counts, and if more than 50% of those come from <1% of pixels, then it is considered to be noise-dominated and hence unusable.
| Quadrant | # 1 sec bins | Bins with >0 counts | Bins with >2000 counts | High rate bins dominated by noise | Noise dominated (total time) | Noise dominated (detector-on time) | Marked lightcurve |
|---|---|---|---|---|---|---|---|
| A | 8920 | 8472 | 0 | 0 | 0.00% | 0.00% | 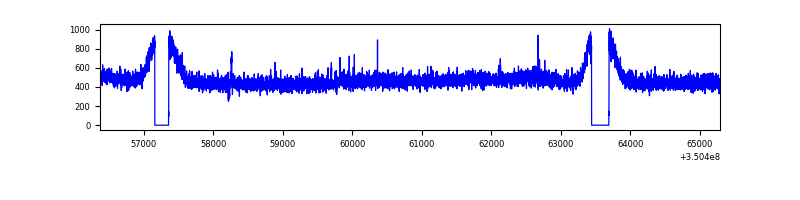 |
| B | 8921 | 8473 | 7 | 7 | 0.08% | 0.08% | 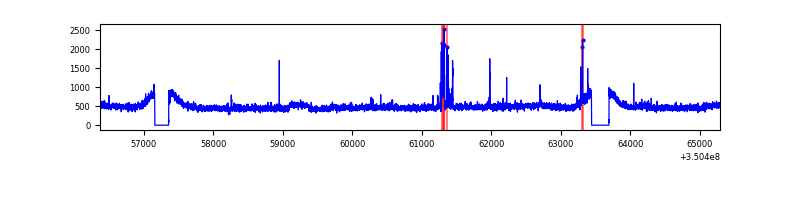 |
| C | 8921 | 8473 | 2 | 2 | 0.02% | 0.02% | 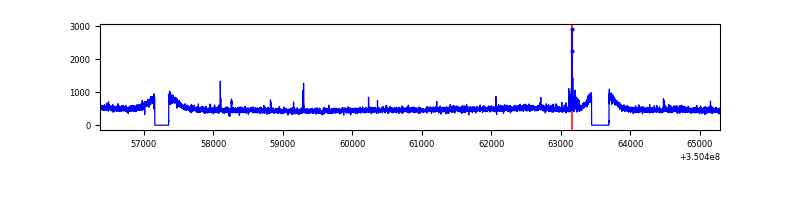 |
| D | 8921 | 8473 | 42 | 42 | 0.47% | 0.50% | 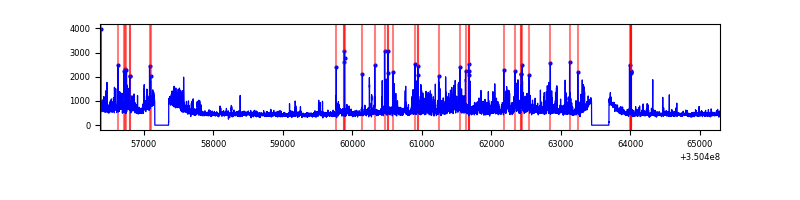 |
Top three noisy pixels from each quadrant. If the there are fewer than three noisy pixels in the level2.evt file, extra rows are filled as -1
| Pixel properties | Quadrant properties | ||||||
|---|---|---|---|---|---|---|---|
| Quadrant | DetID | PixID | Counts | Sigma | Mean | Median | Sigma |
| A | 13 | 254 | 13759 | 60.03 | 1044 | 1020 | 212.2 |
| A | 1 | 113 | 12765 | 55.35 | 1044 | 1020 | 212.2 |
| A | 3 | 137 | 10758 | 45.89 | 1044 | 1020 | 212.2 |
| B | 10 | 246 | 100590 | 492.66 | 1037 | 1007 | 202.1 |
| B | 0 | 229 | 56511 | 274.59 | 1037 | 1007 | 202.1 |
| B | 12 | 111 | 26096 | 124.12 | 1037 | 1007 | 202.1 |
| C | 14 | 238 | 158609 | 663.98 | 1007 | 1013 | 237.3 |
| C | 2 | 16 | 42669 | 175.51 | 1007 | 1013 | 237.3 |
| C | 2 | 114 | 20056 | 80.23 | 1007 | 1013 | 237.3 |
| D | 1 | 52 | 729963 | 3025.17 | 1005 | 977 | 241.0 |
| D | 8 | 195 | 664747 | 2754.54 | 1005 | 977 | 241.0 |
| D | 13 | 104 | 54249 | 221.07 | 1005 | 977 | 241.0 |
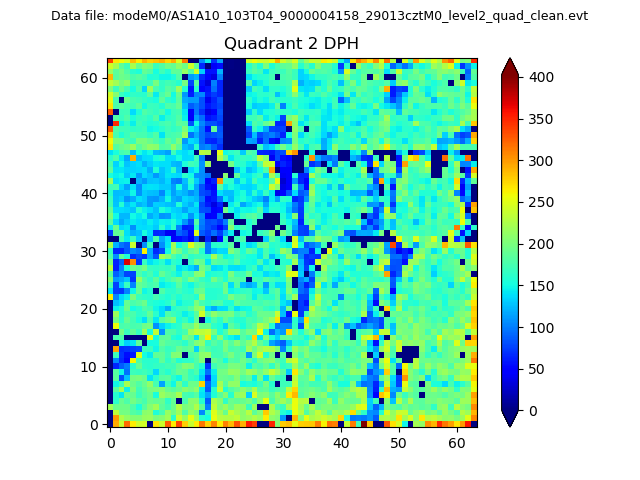
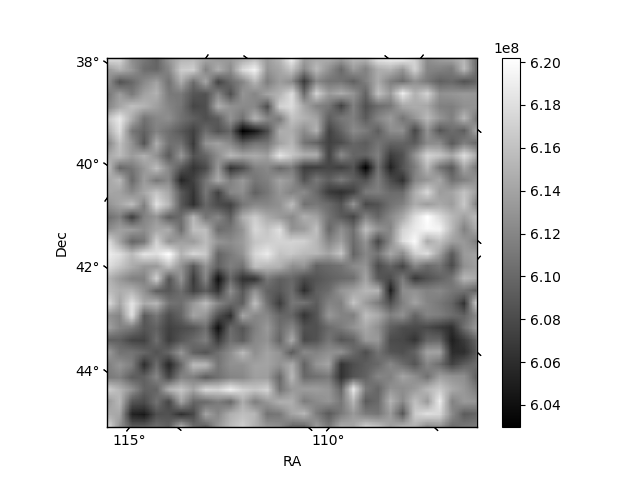
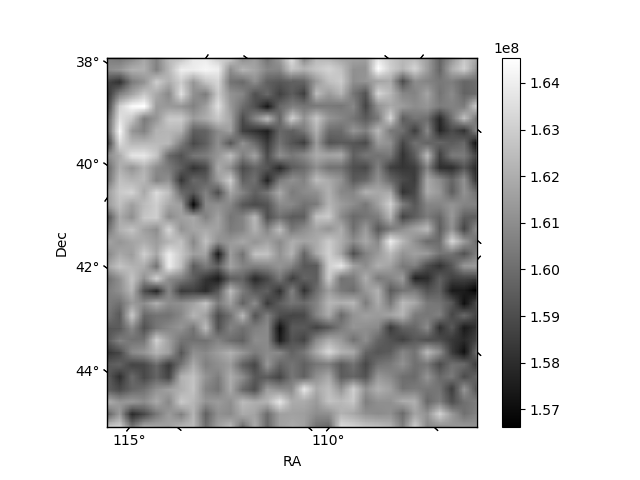
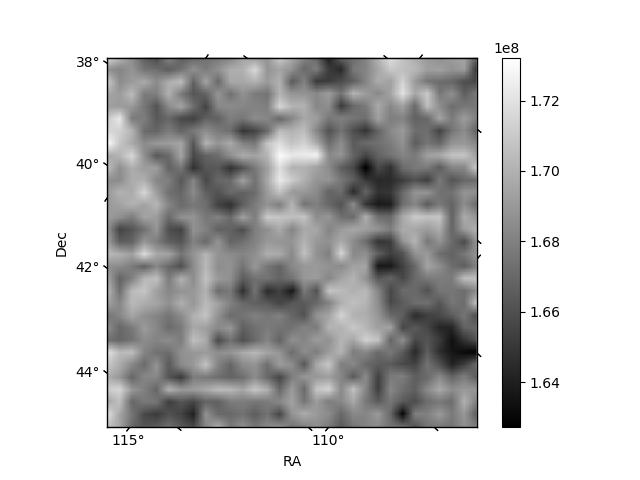
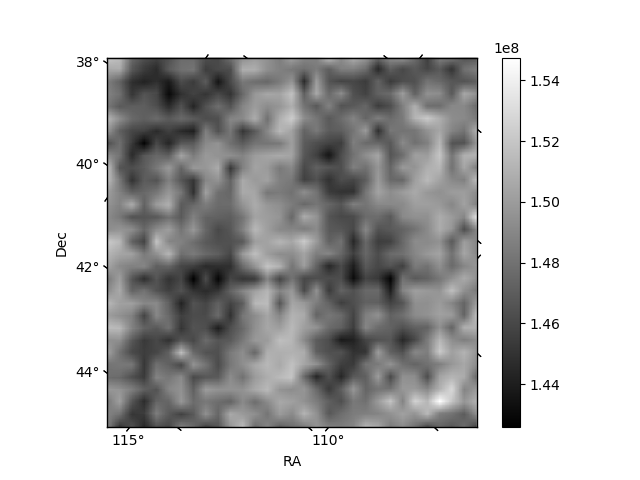
Histogram calculated using DETX and DETY for each event in the final _common_clean file
| Quadrant A | 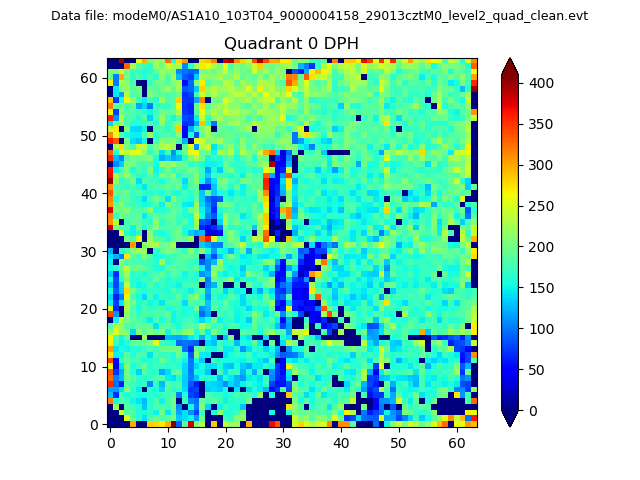 |
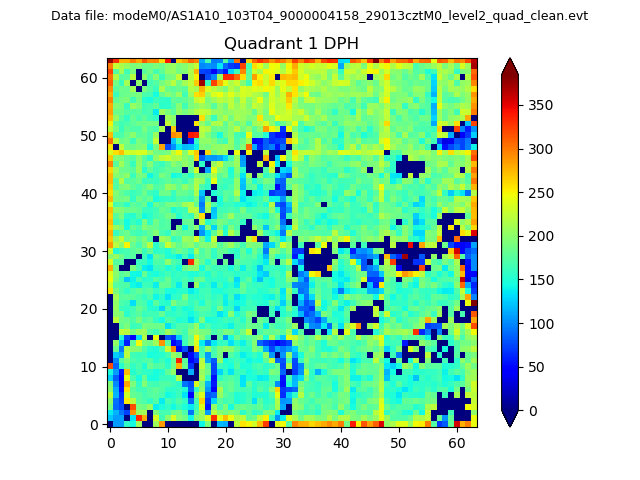 |
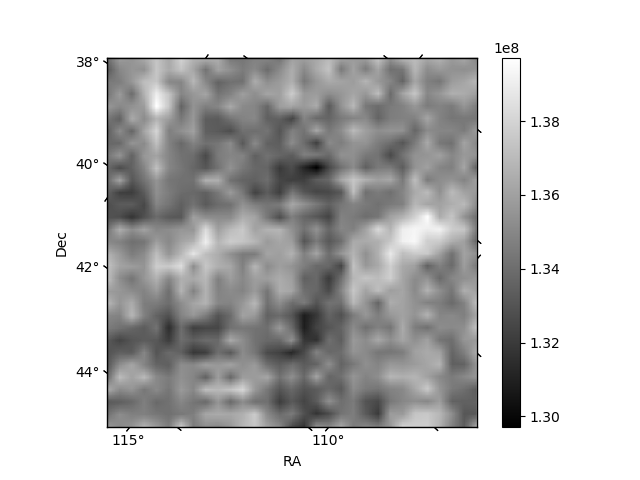
Quadrant B |
|---|---|---|---|
| Quadrant D | 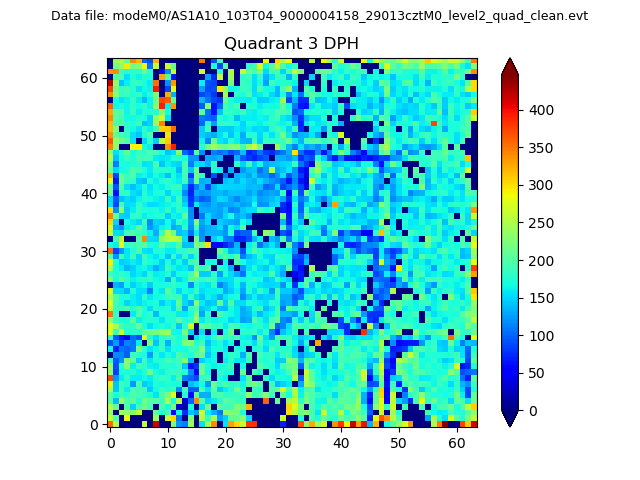 |
 |
Quadrant C |
| Plot type | Count rate plots | Images |
|---|---|---|
| Comparison with Poisson distribution Blue bars denote a histogram of data divided into 1 sec bins. Red curve is a Poisson curve with rate = median count rate of data. |
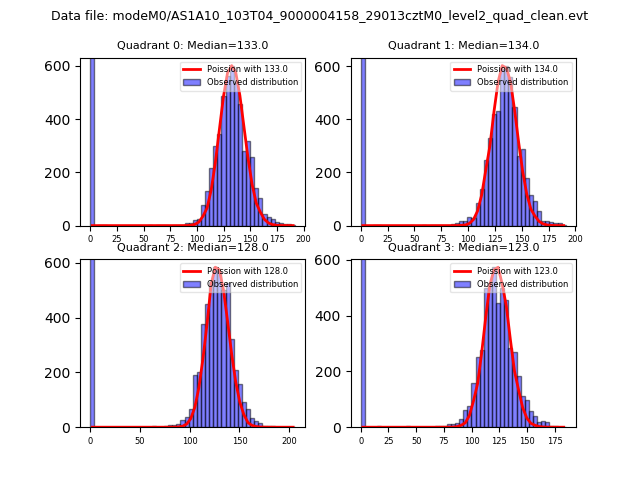 |
 |
| Quadrant-wise count rates Data is divided into 100 sec bins |
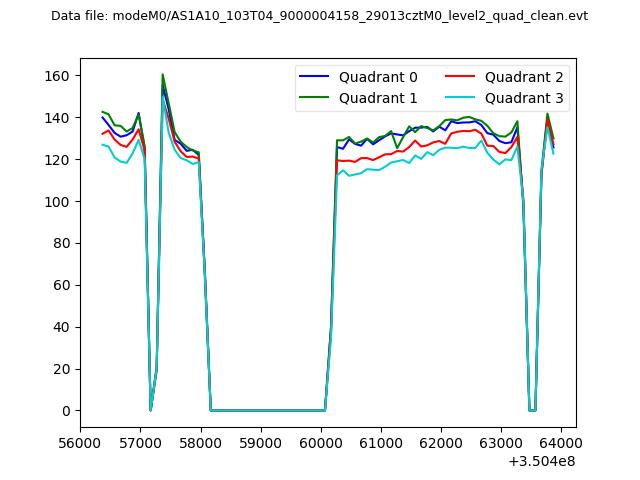 |
|
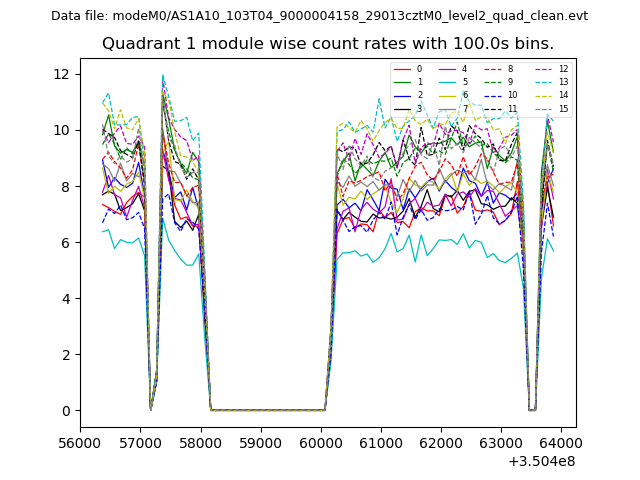
| Module-wise count rates for Quadrant A Data is divided into 100 sec bins |
 |
 |
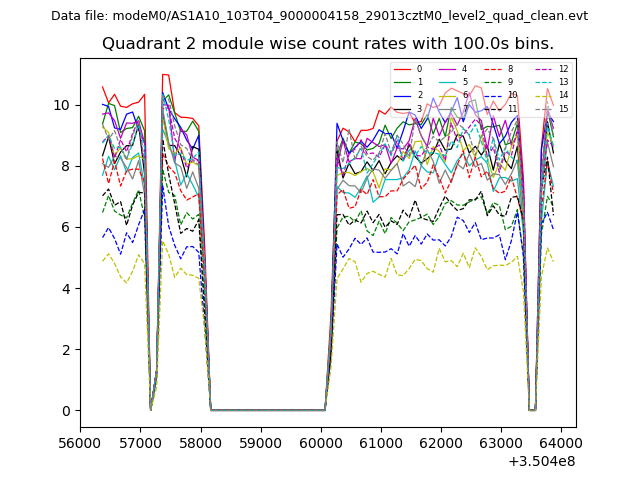
| Module-wise count rates for Quadrant B Data is divided into 100 sec bins |
 |
 |
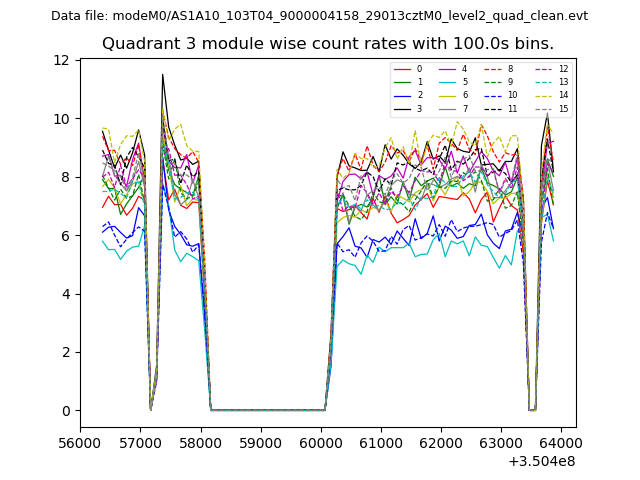
| Module-wise count rates for Quadrant C Data is divided into 100 sec bins |
 |
 |
| Module-wise count rates for Quadrant D Data is divided into 100 sec bins |
 |
 |
| Parameter | Plot |
|---|---|
| CZT HV Monitor | 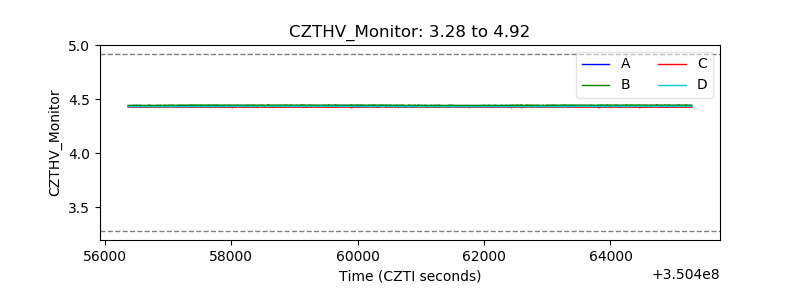 |
| D_VDD | 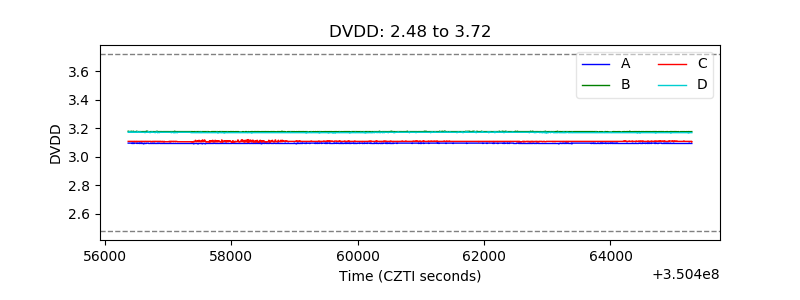 |
| Temperature 1 | 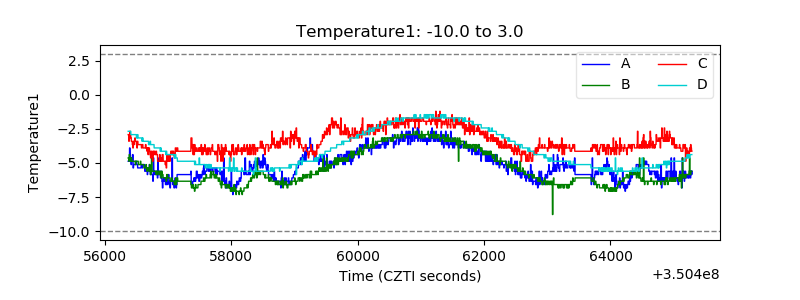 |
| Veto HV Monitor | 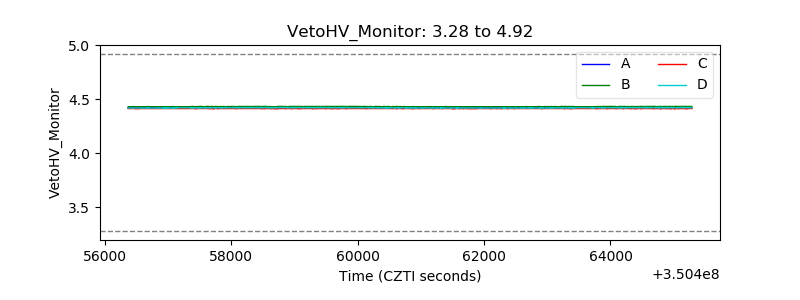 |
| Veto LLD | 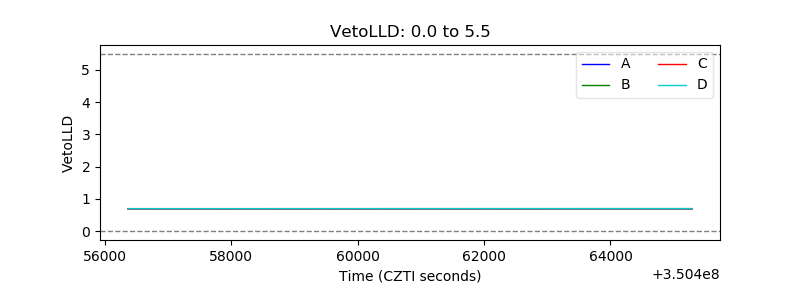 |
| Alpha Counter | 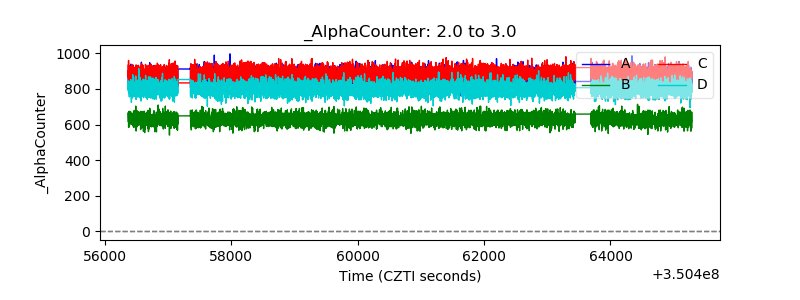 |
| _CPM_Rate | 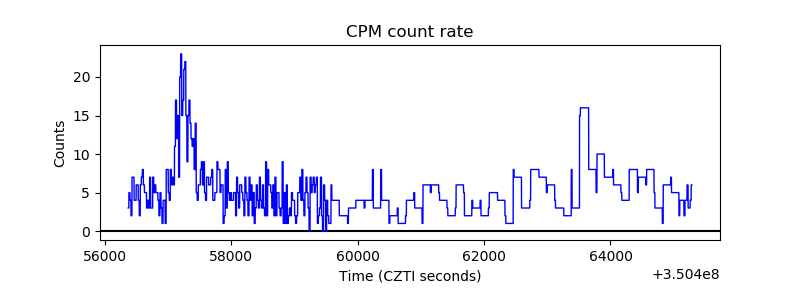 |
| CZT Counter | 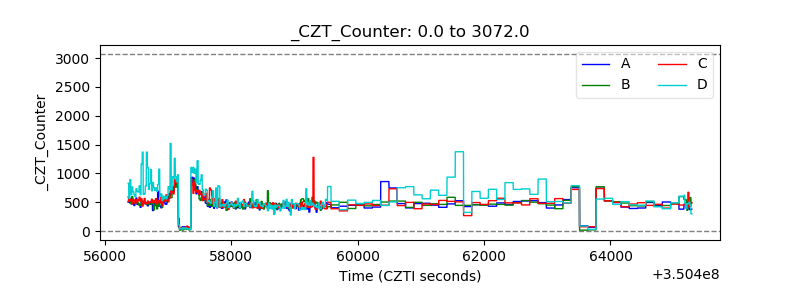 |
| +2.5 Volts monitor | 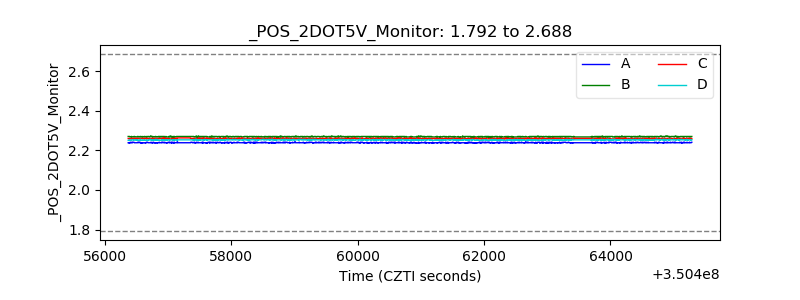 |
| +5 Volts monitor |  |
| _ROLL_ROT | 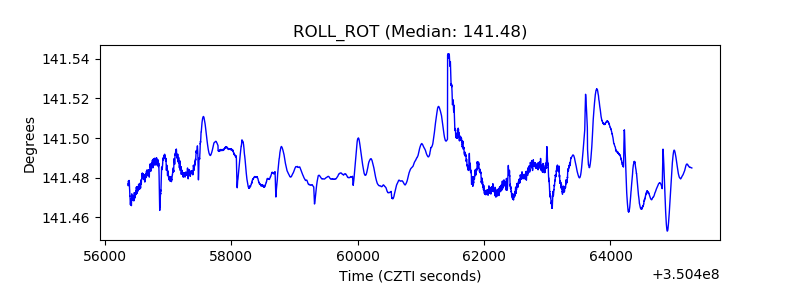 |
| _Roll_DEC | 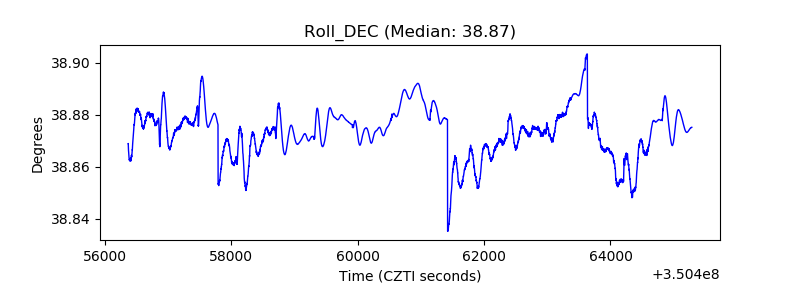 |
| _Roll_RA | 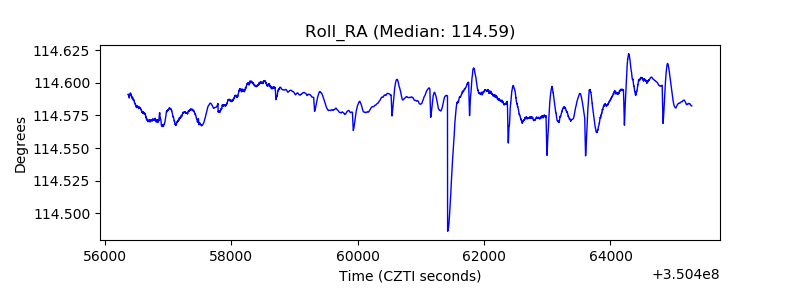 |
| Veto Counter | 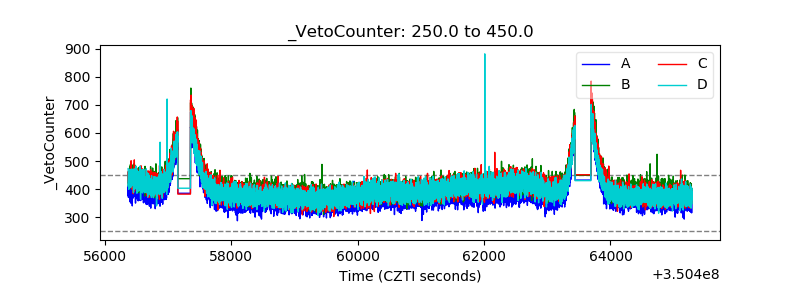 |