| Param | Original file | Final file |
|---|---|---|
| Filename | modeM0/AS1A10_103T04_9000004158_29016cztM0_level2.evt | modeM0/AS1A10_103T04_9000004158_29016cztM0_level2_quad_clean.evt |
| Size (bytes) | 1,455,249,600 | 244,981,440 |
| Size | 1.4 GB | 233.6 MB |
| Events in quadrant A | 9,126,080 | 1,584,631 |
| Events in quadrant B | 9,330,426 | 1,600,870 |
| Events in quadrant C | 9,219,982 | 1,512,383 |
| Events in quadrant D | 15,102,025 | 1,401,862 |
| Mode M9 | |||
|---|---|---|---|
| Quadrant | BADHDUFLAG | Total packets | Discarded packets |
| A | 0 | 22 | 0 |
| B | 0 | 22 | 0 |
| C | 0 | 22 | 0 |
| D | 0 | 22 | 0 |
| Mode M0 | |||
|---|---|---|---|
| Quadrant | BADHDUFLAG | Total packets | Discarded packets |
| A | 0 | 39434 | 4 |
| B | 0 | 39671 | 4 |
| C | 0 | 39431 | 4 |
| D | 0 | 57634 | 4 |
| Mode SS | |||
|---|---|---|---|
| Quadrant | BADHDUFLAG | Total packets | Discarded packets |
| A | 0 | 388 | 0 |
| B | 0 | 388 | 0 |
| C | 0 | 388 | 0 |
| D | 0 | 388 | 0 |
| Quadrant | Total seconds | Saturated seconds | Saturation percentage |
|---|---|---|---|
| A | 19165 | 327 | 1.706235% |
| B | 19166 | 391 | 2.040071% |
| C | 19166 | 376 | 1.961807% |
| D | 19166 | 1334 | 6.960242% |
Noise dominated data is calculated using 1-second bins in cleaned event files. If a bin has >2000 counts, and if more than 50% of those come from <1% of pixels, then it is considered to be noise-dominated and hence unusable.
| Quadrant | # 1 sec bins | Bins with >0 counts | Bins with >2000 counts | High rate bins dominated by noise | Noise dominated (total time) | Noise dominated (detector-on time) | Marked lightcurve |
|---|---|---|---|---|---|---|---|
| A | 21220 | 19169 | 0 | 0 | 0.00% | 0.00% | 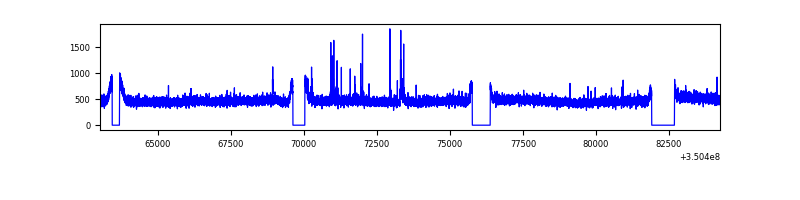 |
| B | 21221 | 19170 | 4 | 4 | 0.02% | 0.02% | 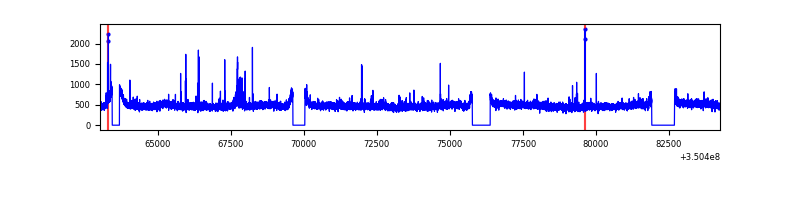 |
| C | 21221 | 19170 | 7 | 7 | 0.03% | 0.04% | 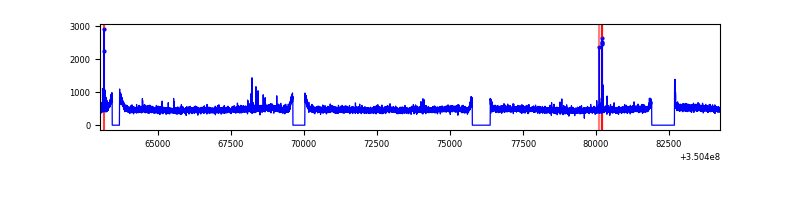 |
| D | 21221 | 19170 | 1082 | 1082 | 5.10% | 5.64% | 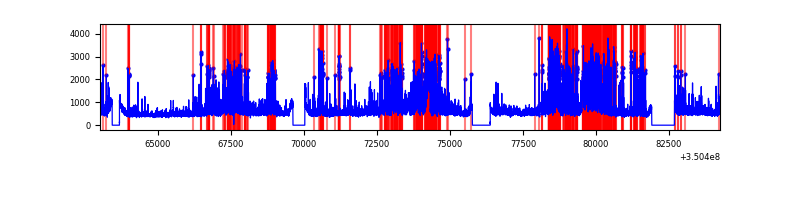 |
Top three noisy pixels from each quadrant. If the there are fewer than three noisy pixels in the level2.evt file, extra rows are filled as -1
| Pixel properties | Quadrant properties | ||||||
|---|---|---|---|---|---|---|---|
| Quadrant | DetID | PixID | Counts | Sigma | Mean | Median | Sigma |
| A | 1 | 113 | 72766 | 150.22 | 2335 | 2281 | 469.2 |
| A | 12 | 210 | 37189 | 74.4 | 2335 | 2281 | 469.2 |
| A | 13 | 254 | 32553 | 64.52 | 2335 | 2281 | 469.2 |
| B | 10 | 246 | 95162 | 207.9 | 2313 | 2251 | 446.9 |
| B | 0 | 229 | 58765 | 126.45 | 2313 | 2251 | 446.9 |
| B | 12 | 111 | 57158 | 122.86 | 2313 | 2251 | 446.9 |
| C | 14 | 238 | 356356 | 673.43 | 2236 | 2245 | 525.8 |
| C | 2 | 16 | 72142 | 132.93 | 2236 | 2245 | 525.8 |
| C | 3 | 233 | 46081 | 83.37 | 2236 | 2245 | 525.8 |
| D | 1 | 52 | 4508079 | 8633.6 | 2197 | 2135 | 521.9 |
| D | 8 | 195 | 1680324 | 3215.49 | 2197 | 2135 | 521.9 |
| D | 13 | 104 | 255913 | 486.25 | 2197 | 2135 | 521.9 |
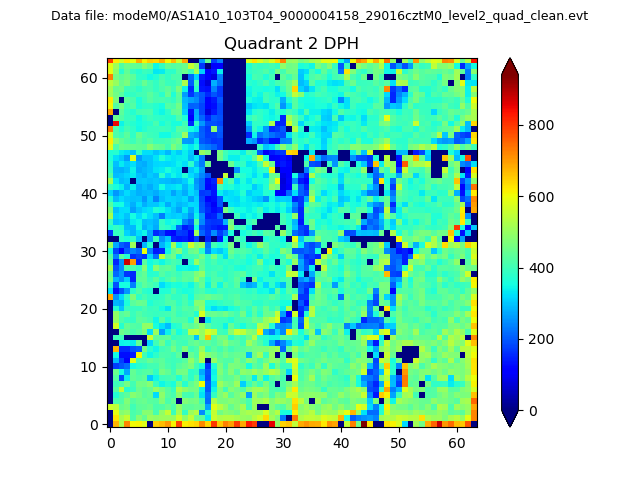
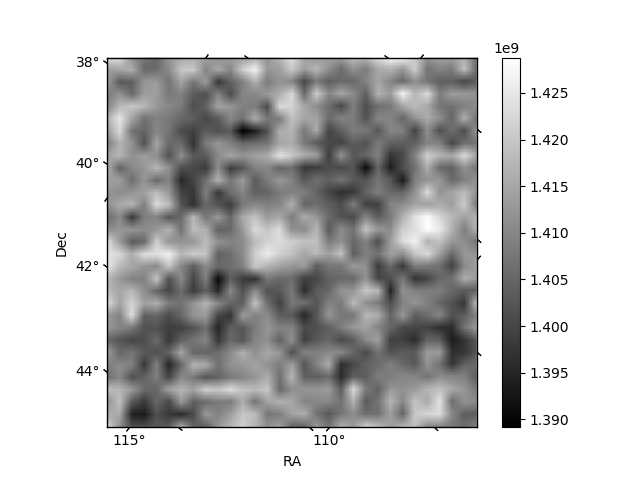
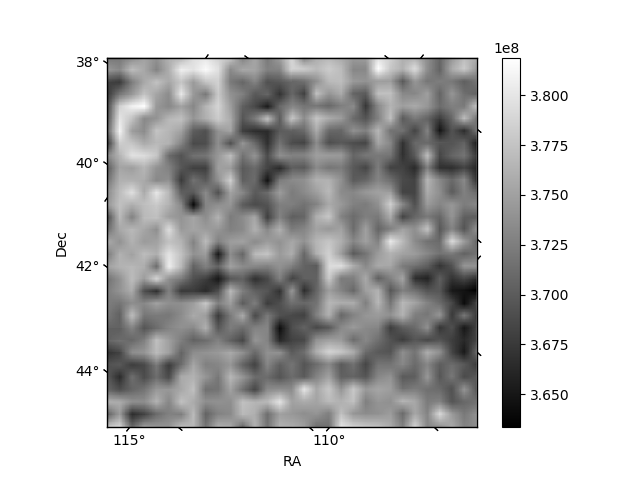
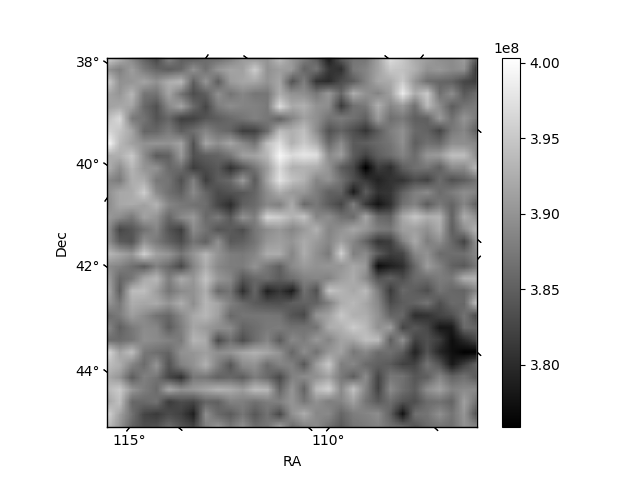
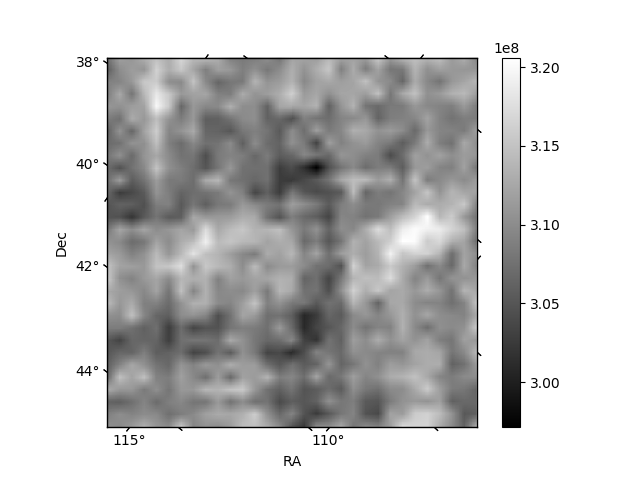
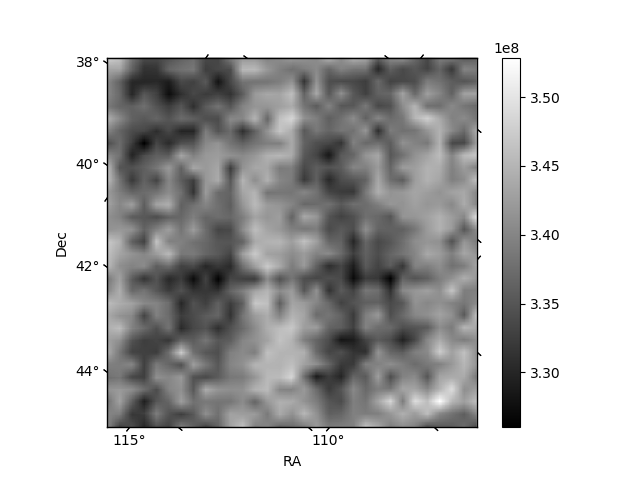
Histogram calculated using DETX and DETY for each event in the final _common_clean file
| Quadrant A | 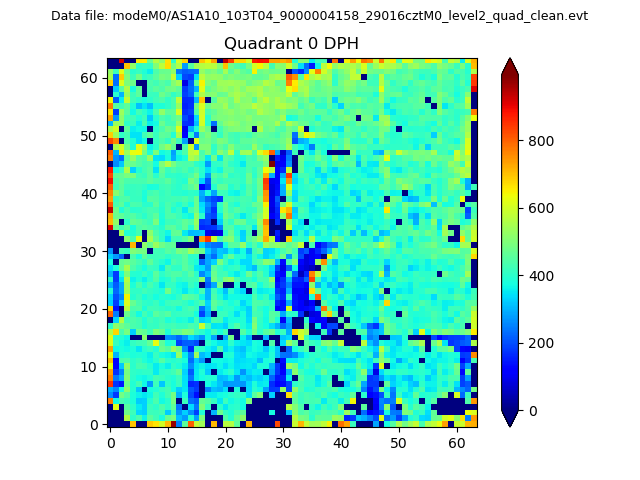 |
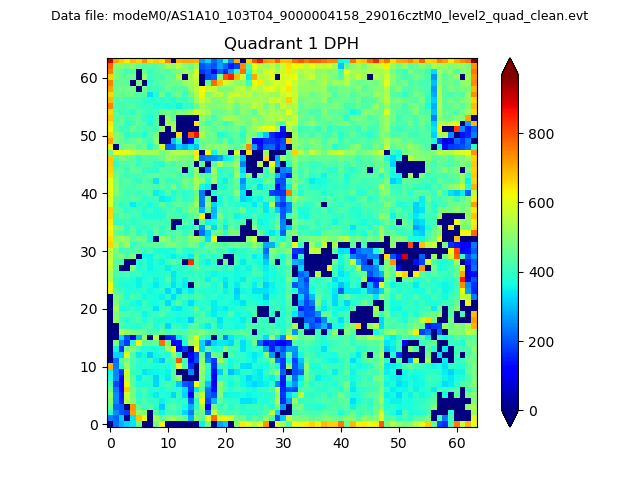 |
Quadrant B |
|---|---|---|---|
| Quadrant D | 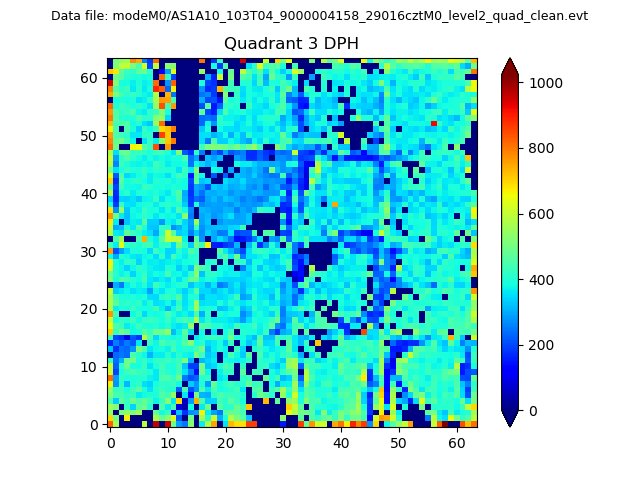 |
 |
Quadrant C |
| Plot type | Count rate plots | Images |
|---|---|---|
| Comparison with Poisson distribution Blue bars denote a histogram of data divided into 1 sec bins. Red curve is a Poisson curve with rate = median count rate of data. |
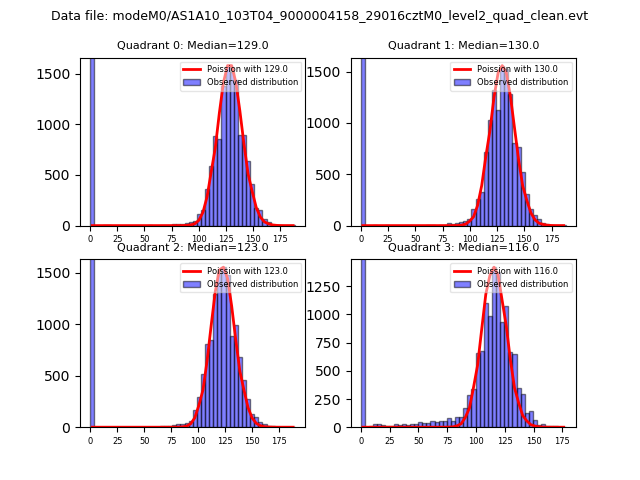 |
 |
| Quadrant-wise count rates Data is divided into 100 sec bins |
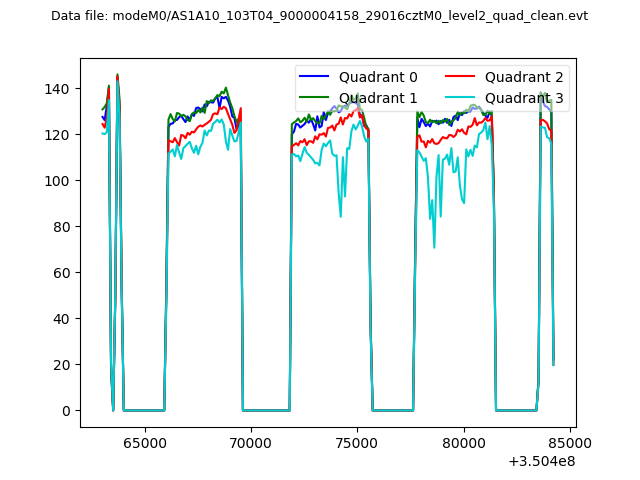 |
|
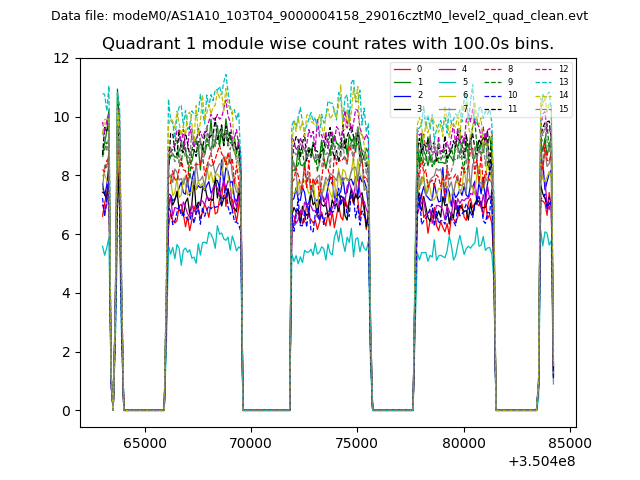
| Module-wise count rates for Quadrant A Data is divided into 100 sec bins |
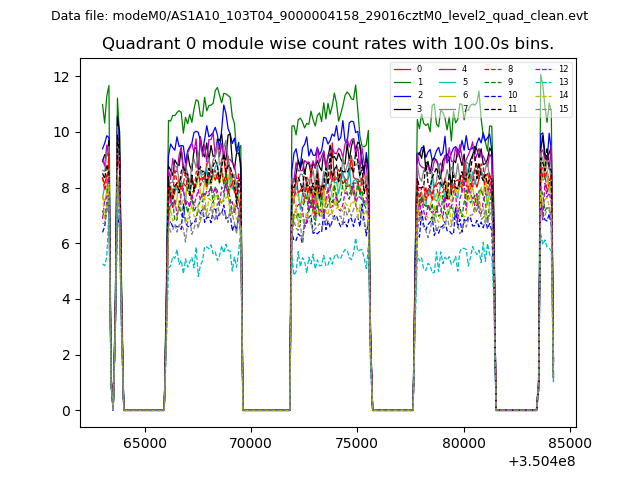 |
 |
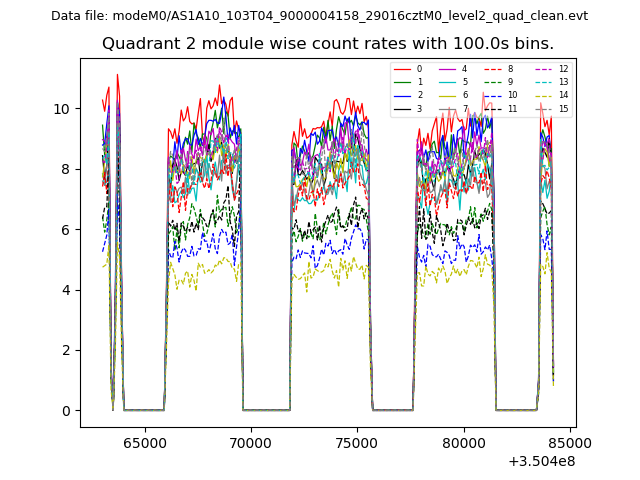
| Module-wise count rates for Quadrant B Data is divided into 100 sec bins |
 |
 |
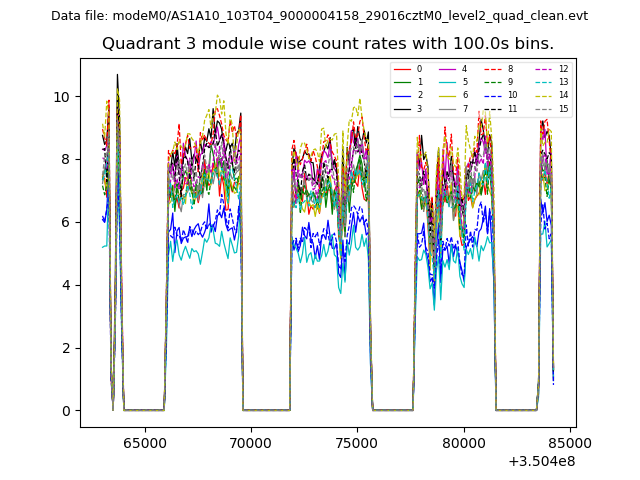
| Module-wise count rates for Quadrant C Data is divided into 100 sec bins |
 |
 |
| Module-wise count rates for Quadrant D Data is divided into 100 sec bins |
 |
 |
| Parameter | Plot |
|---|---|
| CZT HV Monitor | 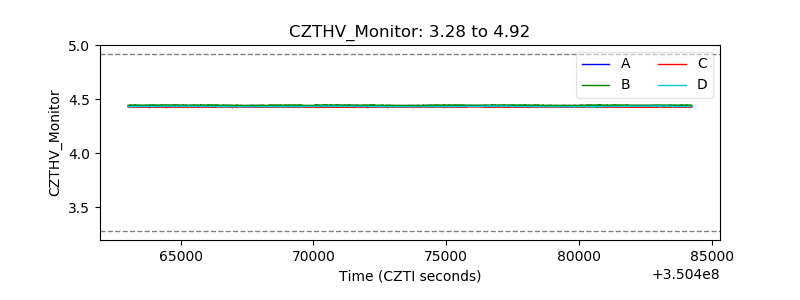 |
| D_VDD | 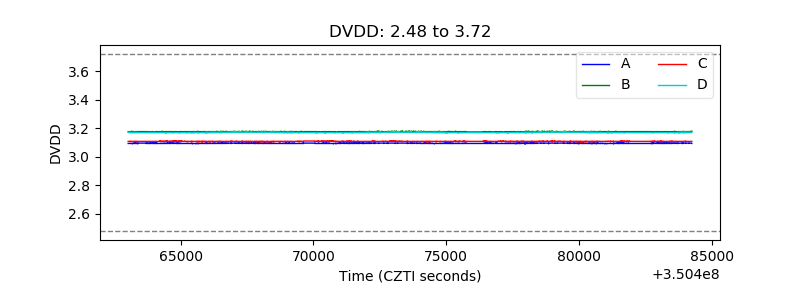 |
| Temperature 1 | 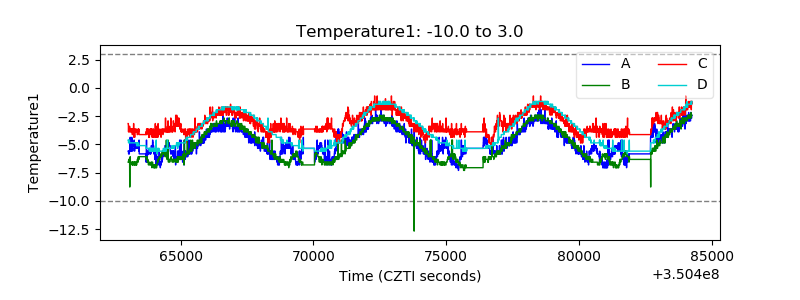 |
| Veto HV Monitor |  |
| Veto LLD | 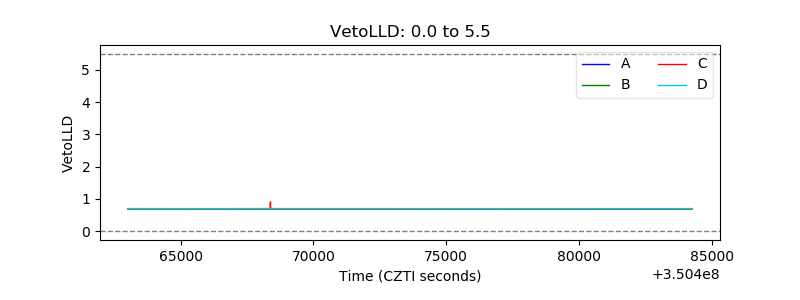 |
| Alpha Counter | 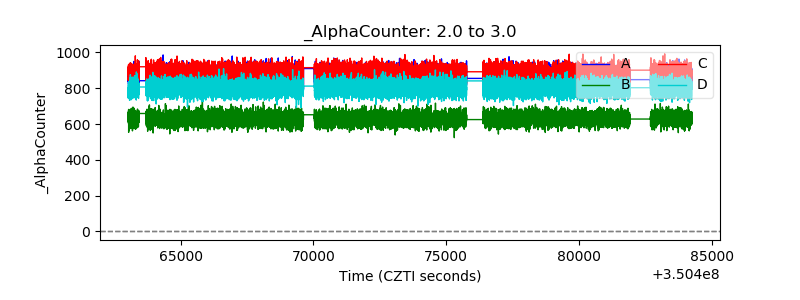 |
| _CPM_Rate | 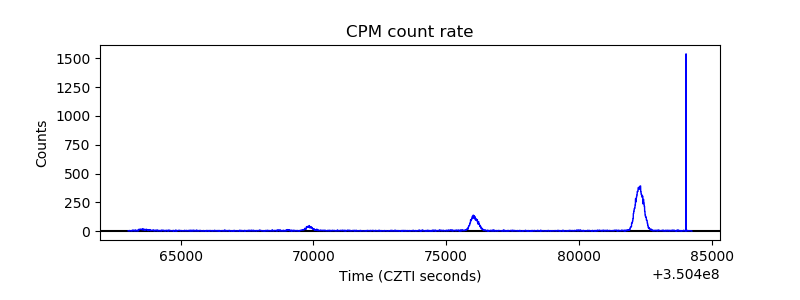 |
| CZT Counter | 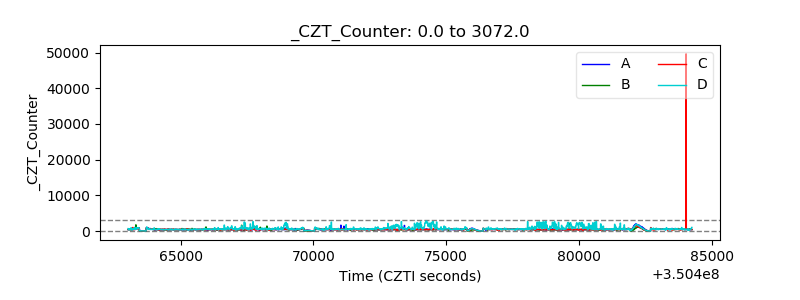 |
| +2.5 Volts monitor |  |
| +5 Volts monitor |  |
| _ROLL_ROT | 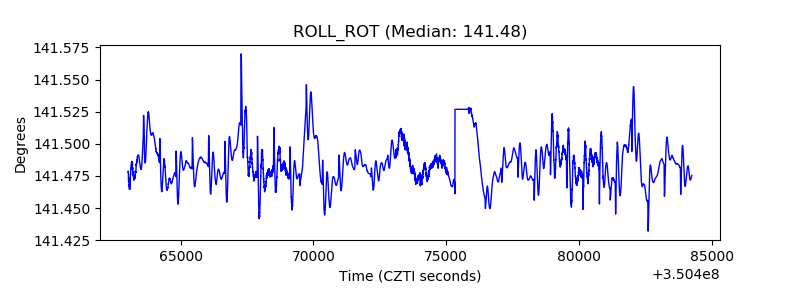 |
| _Roll_DEC | 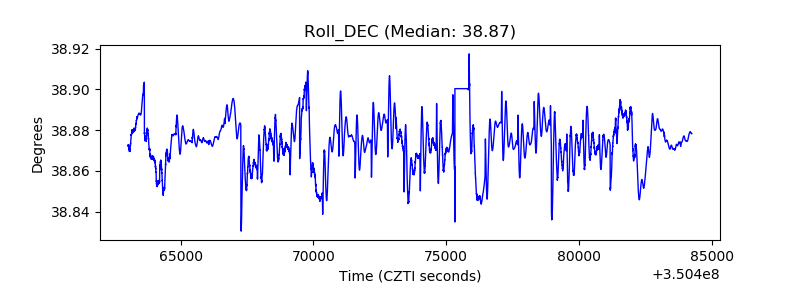 |
| _Roll_RA | 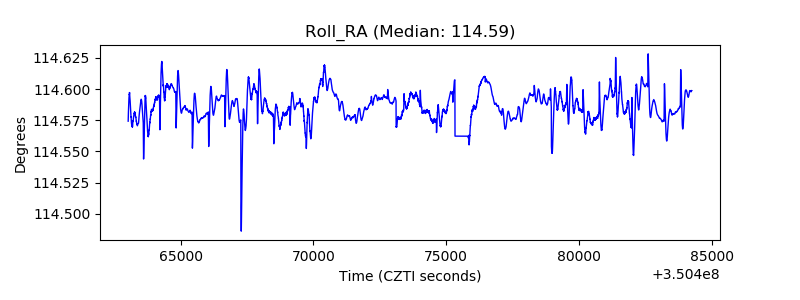 |
| Veto Counter | 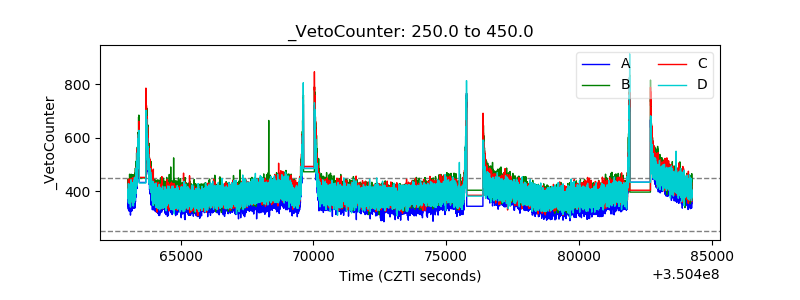 |