| Param | Original file | Final file |
|---|---|---|
| Filename | modeM0/AS1A10_103T04_9000004158_29017cztM0_level2.evt | modeM0/AS1A10_103T04_9000004158_29017cztM0_level2_quad_clean.evt |
| Size (bytes) | 238,129,920 | 42,802,560 |
| Size | 227.1 MB | 40.8 MB |
| Events in quadrant A | 1,629,470 | 274,813 |
| Events in quadrant B | 1,654,358 | 276,176 |
| Events in quadrant C | 1,626,817 | 256,632 |
| Events in quadrant D | 2,071,783 | 250,509 |
| Mode M9 | |||
|---|---|---|---|
| Quadrant | BADHDUFLAG | Total packets | Discarded packets |
| A | 0 | 8 | 0 |
| B | 0 | 8 | 0 |
| C | 0 | 8 | 0 |
| D | 0 | 8 | 0 |
| Mode M0 | |||
|---|---|---|---|
| Quadrant | BADHDUFLAG | Total packets | Discarded packets |
| A | 0 | 6908 | 1 |
| B | 0 | 6990 | 1 |
| C | 0 | 6925 | 1 |
| D | 0 | 8270 | 1 |
| Mode SS | |||
|---|---|---|---|
| Quadrant | BADHDUFLAG | Total packets | Discarded packets |
| A | 0 | 68 | 0 |
| B | 0 | 68 | 0 |
| C | 0 | 68 | 0 |
| D | 0 | 68 | 0 |
| Quadrant | Total seconds | Saturated seconds | Saturation percentage |
|---|---|---|---|
| A | 3351 | 71 | 2.118771% |
| B | 3352 | 69 | 2.058473% |
| C | 3352 | 75 | 2.237470% |
| D | 3352 | 68 | 2.028640% |
Noise dominated data is calculated using 1-second bins in cleaned event files. If a bin has >2000 counts, and if more than 50% of those come from <1% of pixels, then it is considered to be noise-dominated and hence unusable.
| Quadrant | # 1 sec bins | Bins with >0 counts | Bins with >2000 counts | High rate bins dominated by noise | Noise dominated (total time) | Noise dominated (detector-on time) | Marked lightcurve |
|---|---|---|---|---|---|---|---|
| A | 4131 | 3352 | 0 | 0 | 0.00% | 0.00% | 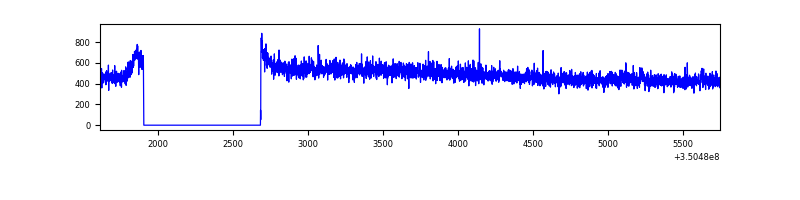 |
| B | 4132 | 3353 | 1 | 1 | 0.02% | 0.03% | 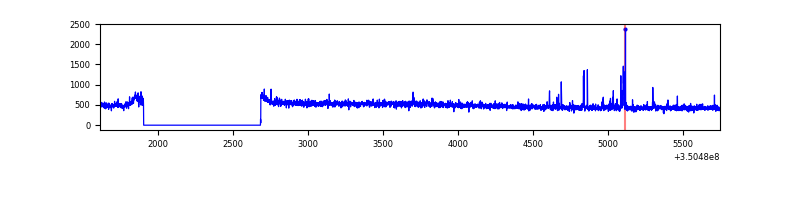 |
| C | 4132 | 3353 | 0 | 0 | 0.00% | 0.00% | 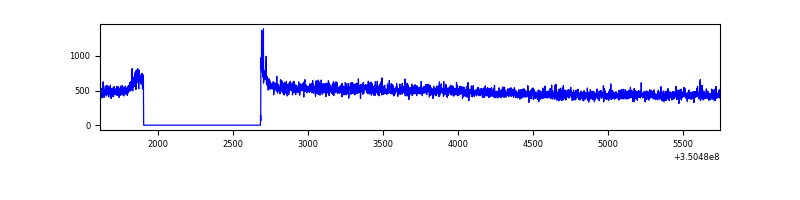 |
| D | 4132 | 3353 | 22 | 22 | 0.53% | 0.66% | 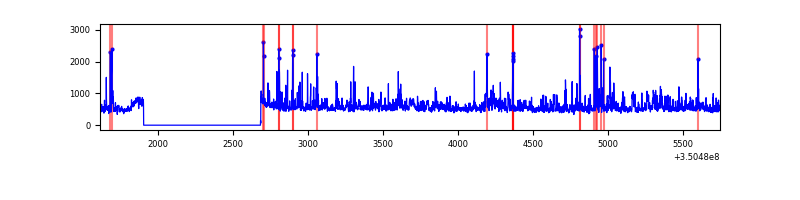 |
Top three noisy pixels from each quadrant. If the there are fewer than three noisy pixels in the level2.evt file, extra rows are filled as -1
| Pixel properties | Quadrant properties | ||||||
|---|---|---|---|---|---|---|---|
| Quadrant | DetID | PixID | Counts | Sigma | Mean | Median | Sigma |
| A | 6 | 16 | 9069 | 101.53 | 418 | 409 | 85.3 |
| A | 13 | 254 | 5902 | 64.4 | 418 | 409 | 85.3 |
| A | 3 | 137 | 4221 | 44.69 | 418 | 409 | 85.3 |
| B | 10 | 246 | 27224 | 333.18 | 411 | 399 | 80.5 |
| B | 12 | 111 | 9849 | 117.37 | 411 | 399 | 80.5 |
| B | 11 | 111 | 9363 | 111.34 | 411 | 399 | 80.5 |
| C | 14 | 238 | 63446 | 671.97 | 395 | 396 | 93.8 |
| C | 3 | 233 | 10612 | 108.88 | 395 | 396 | 93.8 |
| C | 2 | 114 | 7996 | 81.0 | 395 | 396 | 93.8 |
| D | 8 | 195 | 261471 | 2732.69 | 401 | 390 | 95.5 |
| D | 1 | 52 | 170284 | 1778.25 | 401 | 390 | 95.5 |
| D | 7 | 80 | 73003 | 760.03 | 401 | 390 | 95.5 |
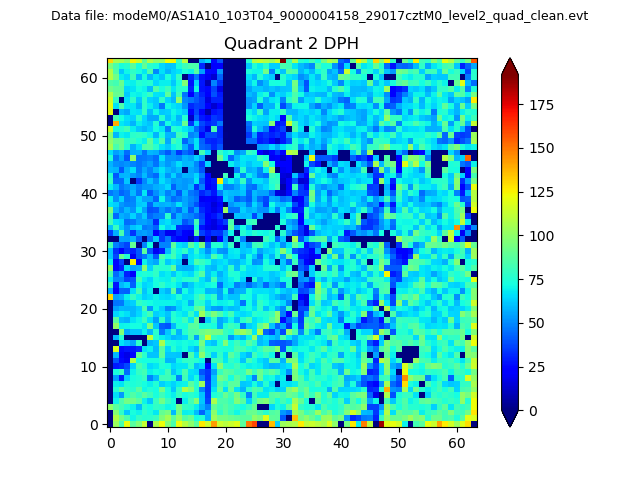
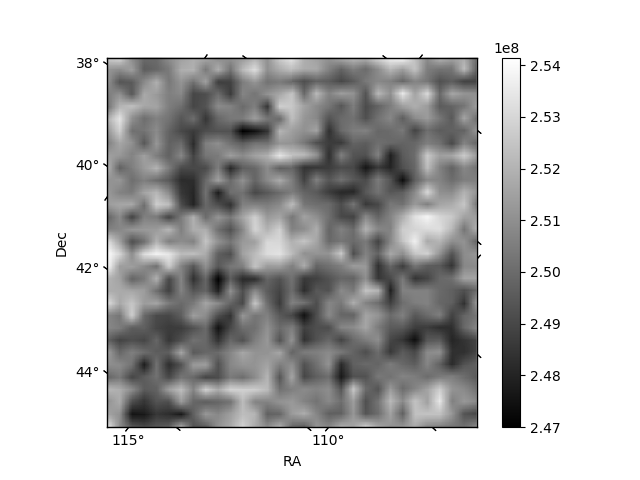
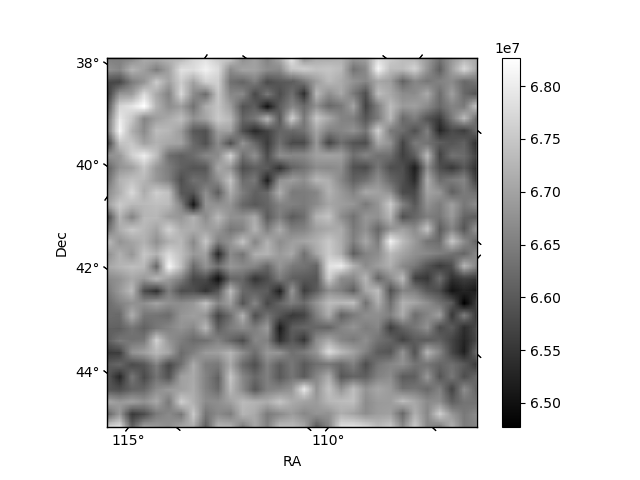
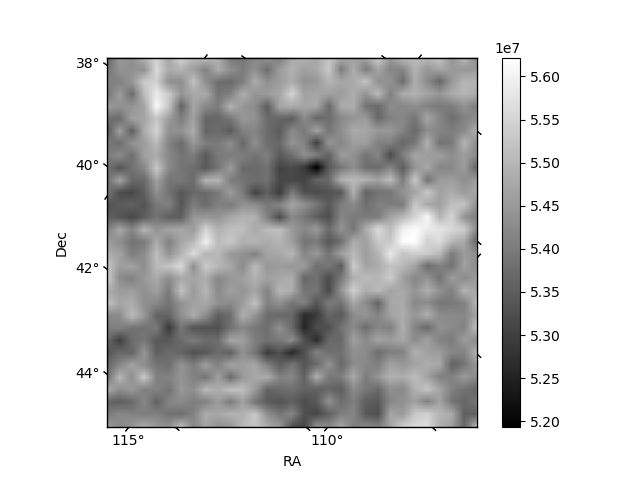
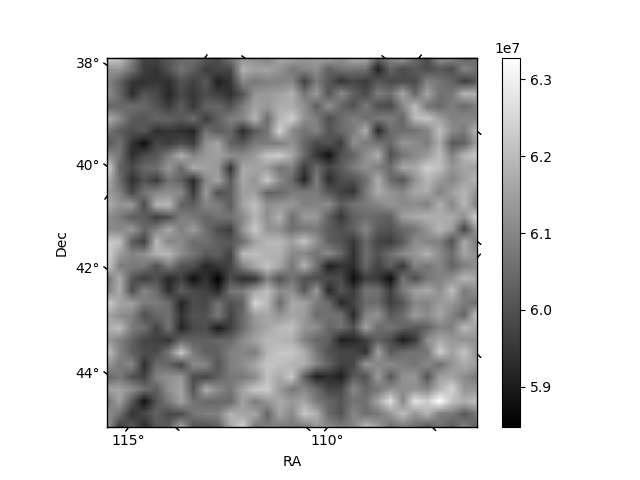
Histogram calculated using DETX and DETY for each event in the final _common_clean file
| Quadrant A | 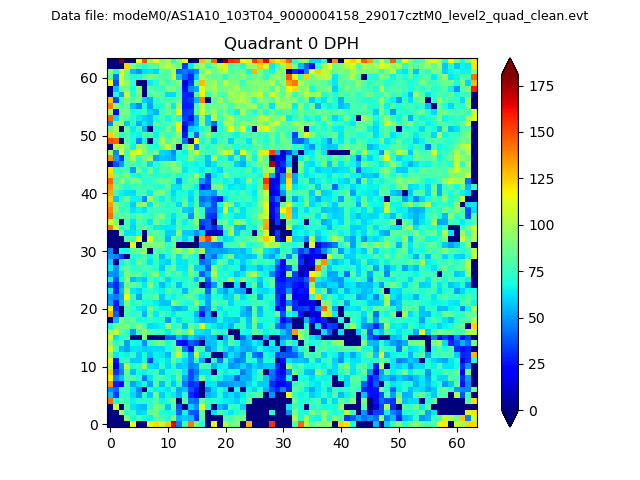 |
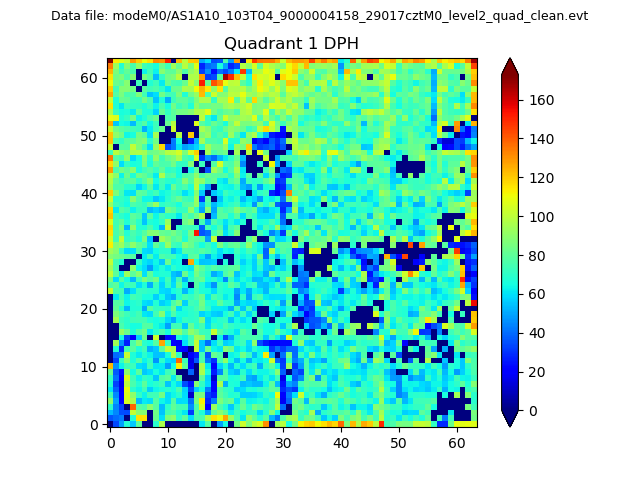 |
Quadrant B |
|---|---|---|---|
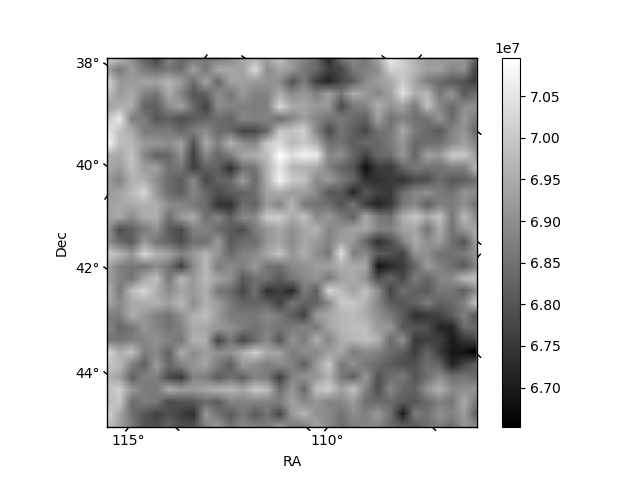
| Quadrant D | 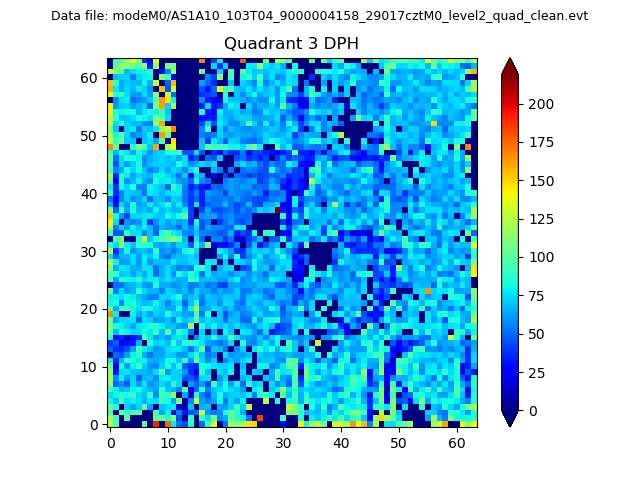 |
 |
Quadrant C |
| Plot type | Count rate plots | Images |
|---|---|---|
| Comparison with Poisson distribution Blue bars denote a histogram of data divided into 1 sec bins. Red curve is a Poisson curve with rate = median count rate of data. |
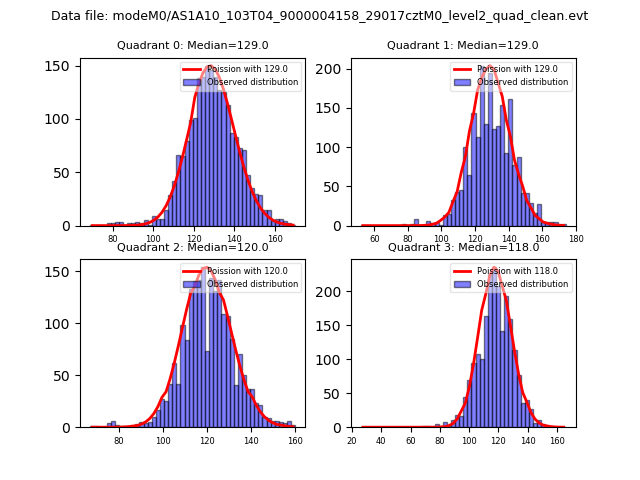 |
 |
| Quadrant-wise count rates Data is divided into 100 sec bins |
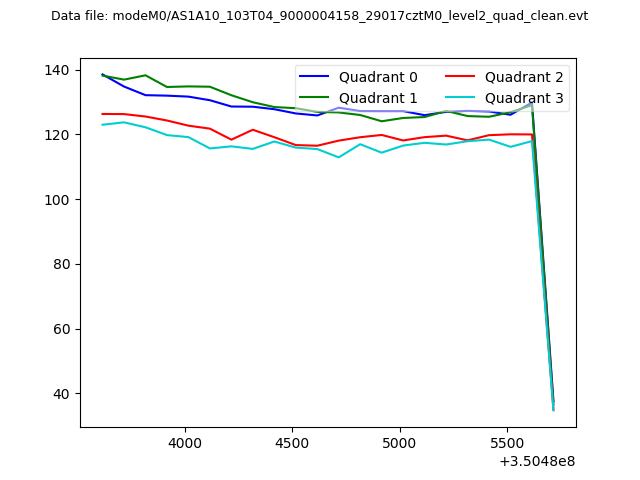 |
|
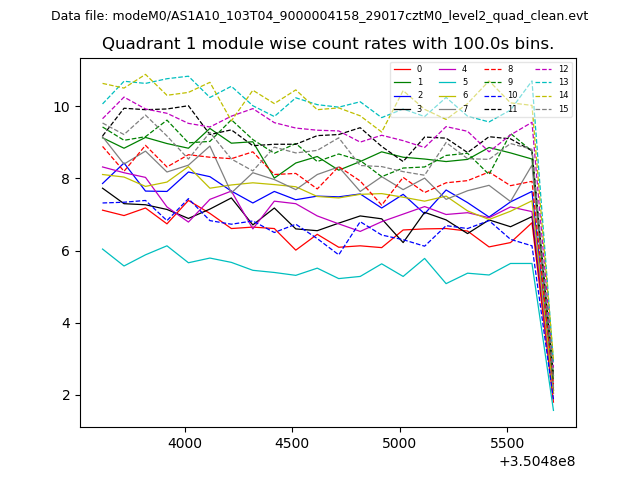
| Module-wise count rates for Quadrant A Data is divided into 100 sec bins |
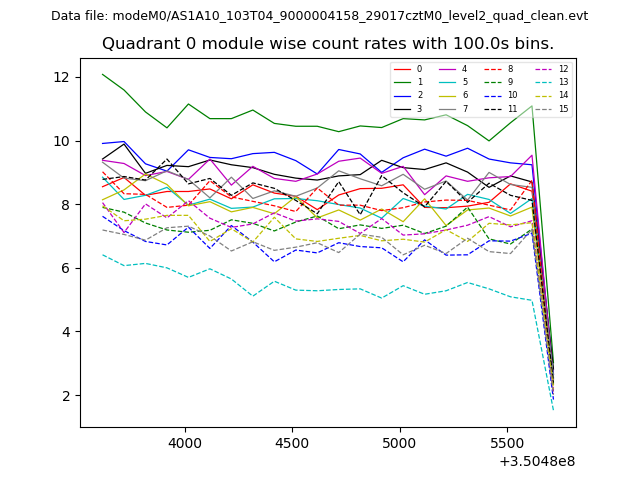 |
 |
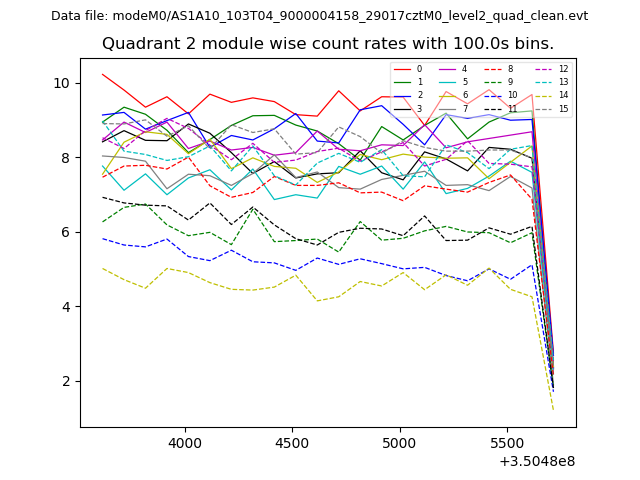
| Module-wise count rates for Quadrant B Data is divided into 100 sec bins |
 |
 |
| Module-wise count rates for Quadrant C Data is divided into 100 sec bins |
 |
 |
| Module-wise count rates for Quadrant D Data is divided into 100 sec bins |
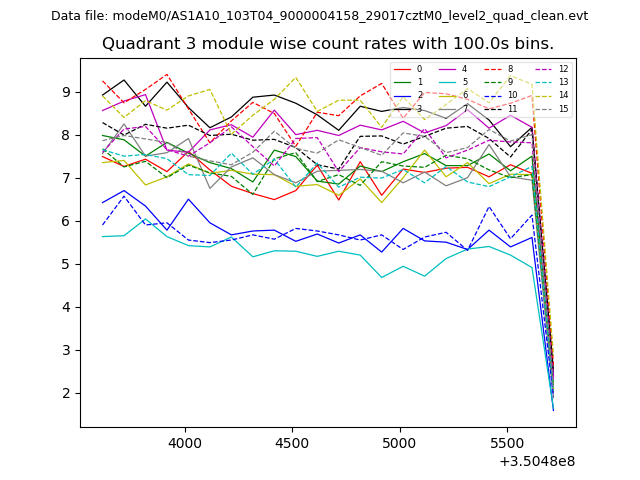 |
 |
| Parameter | Plot |
|---|---|
| CZT HV Monitor | 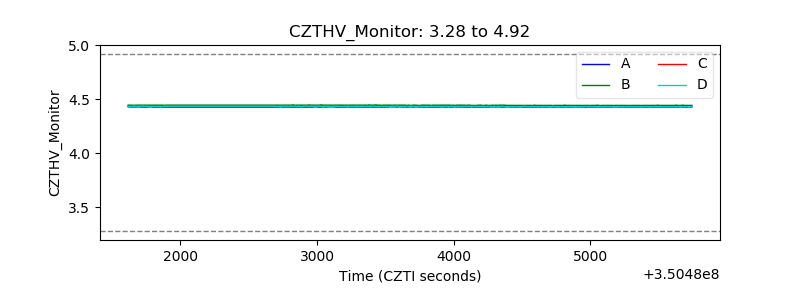 |
| D_VDD | 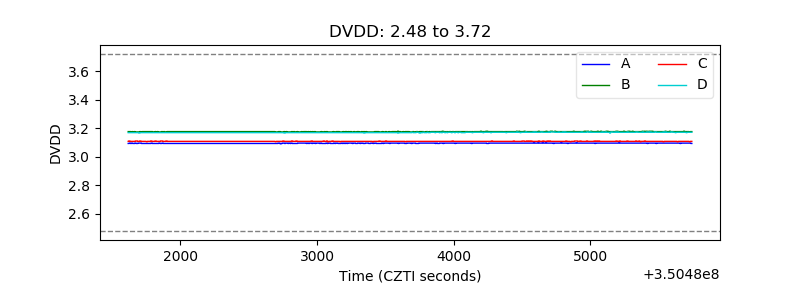 |
| Temperature 1 | 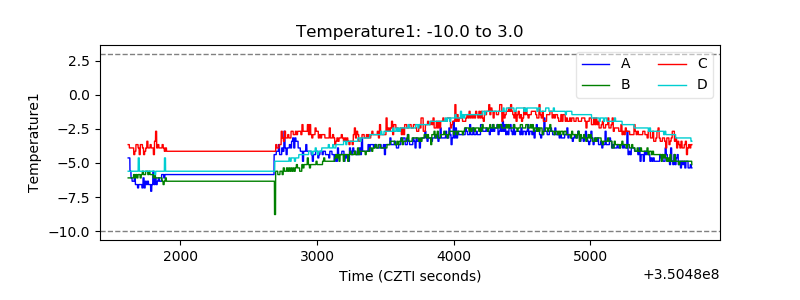 |
| Veto HV Monitor |  |
| Veto LLD | 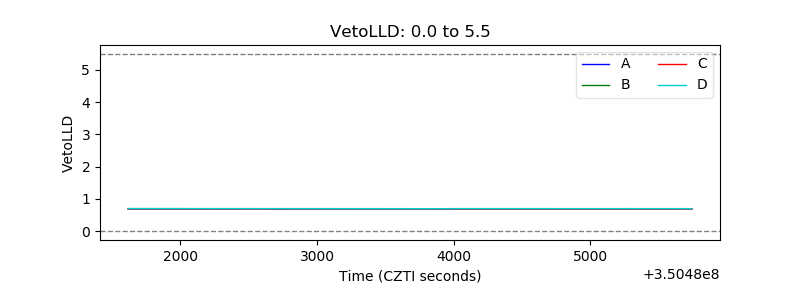 |
| Alpha Counter | 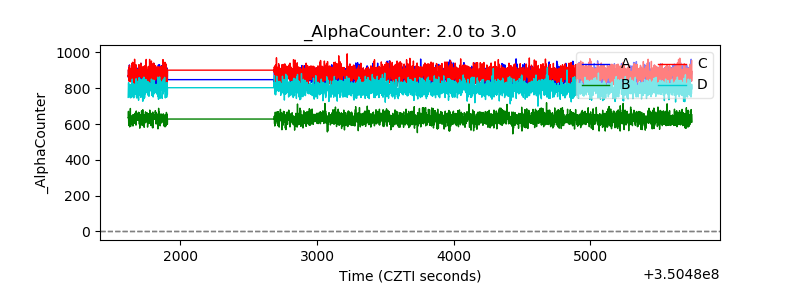 |
| _CPM_Rate | 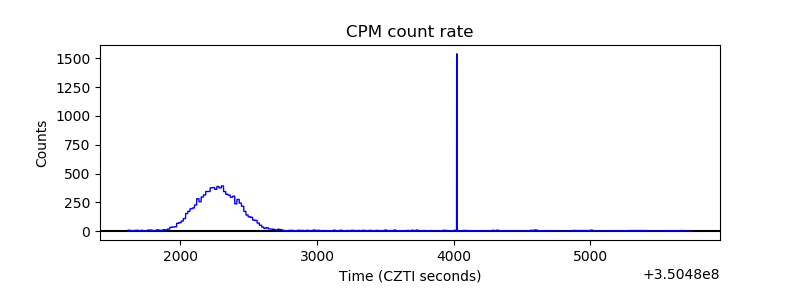 |
| CZT Counter | 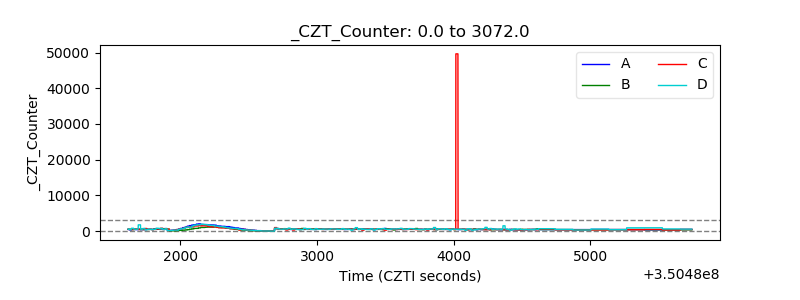 |
| +2.5 Volts monitor |  |
| +5 Volts monitor |  |
| _ROLL_ROT | 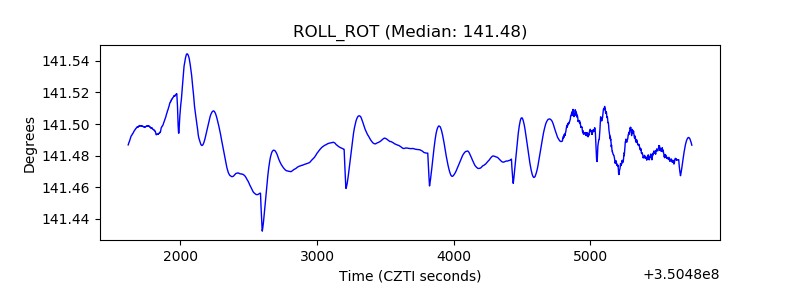 |
| _Roll_DEC | 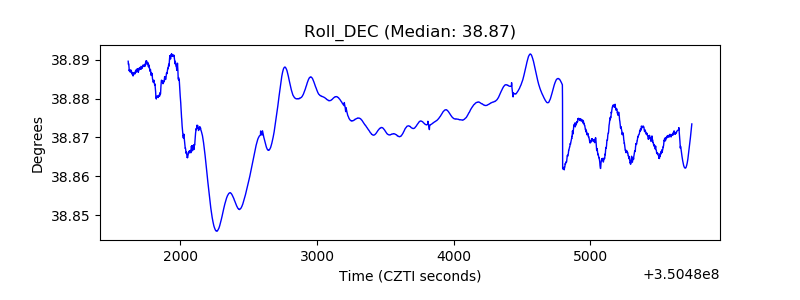 |
| _Roll_RA | 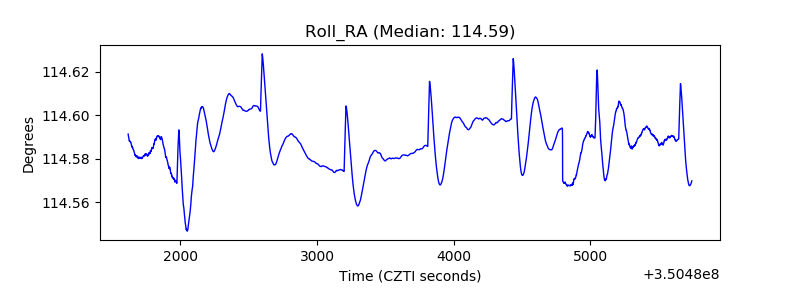 |
| Veto Counter | 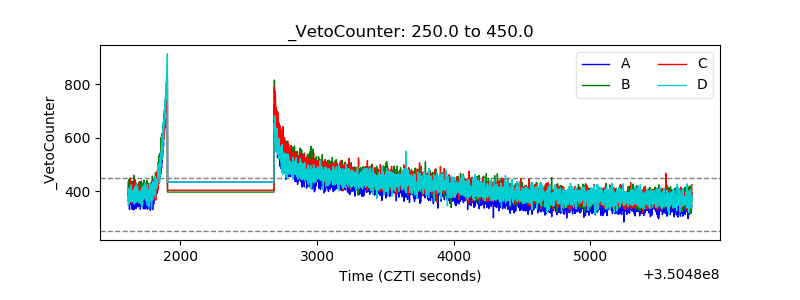 |