| Param | Original file | Final file |
|---|---|---|
| Filename | modeM0/AS1A10_123T02_9000004160cztM0_level2.fits | modeM0/AS1A10_123T02_9000004160cztM0_level2_quad_clean.evt |
| Size (bytes) | 1,093,176,000 | 831,484,800 |
| Size | 1.0 GB | 793.0 MB |
| Events in quadrant A | 6,847,612 | 4,686,154 |
| Events in quadrant B | 6,562,384 | 4,782,199 |
| Events in quadrant C | 6,682,316 | 4,468,768 |
| Events in quadrant D | 5,582,426 | 3,812,884 |
| Mode M9 | |||
|---|---|---|---|
| Quadrant | BADHDUFLAG | Total packets | Discarded packets |
| A | 0 | 204 | 0 |
| B | 0 | 204 | 0 |
| C | 0 | 204 | 0 |
| D | 0 | 204 | 0 |
| Mode SS | |||
|---|---|---|---|
| Quadrant | BADHDUFLAG | Total packets | Discarded packets |
| A | 0 | 2208 | 0 |
| B | 0 | 2208 | 0 |
| C | 0 | 2208 | 0 |
| D | 0 | 2208 | 0 |
| Mode M0 | |||
|---|---|---|---|
| Quadrant | BADHDUFLAG | Total packets | Discarded packets |
| A | 0 | 226728 | 0 |
| B | 0 | 228597 | 0 |
| C | 0 | 252773 | 0 |
| D | 0 | 348703 | 0 |
| Quadrant | Total seconds | Saturated seconds | Saturation percentage |
|---|---|---|---|
| A | 108387 | 1156 | 1.066549% |
| B | 108387 | 1450 | 1.337799% |
| C | 108387 | 2498 | 2.304704% |
| D | 108387 | 11097 | 10.238313% |
Noise dominated data is calculated using 1-second bins in cleaned event files. If a bin has >2000 counts, and if more than 50% of those come from <1% of pixels, then it is considered to be noise-dominated and hence unusable.
| Quadrant | # 1 sec bins | Bins with >0 counts | Bins with >2000 counts | High rate bins dominated by noise | Noise dominated (total time) | Noise dominated (detector-on time) | Marked lightcurve |
|---|---|---|---|---|---|---|---|
| A | 128828 | 108379 | 0 | 0 | 0.00% | 0.00% | 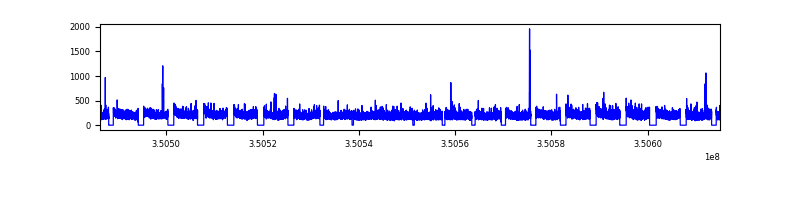 |
| B | 128829 | 108384 | 0 | 0 | 0.00% | 0.00% |  |
| C | 128828 | 108382 | 0 | 0 | 0.00% | 0.00% | 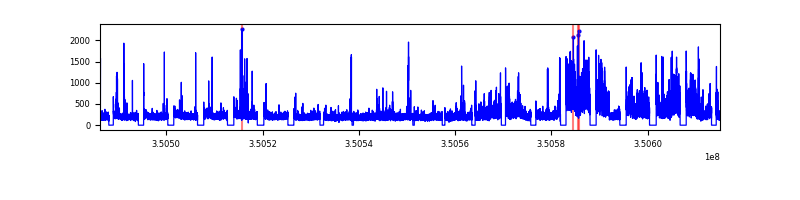 |
| D | 128828 | 108175 | 0 | 0 | 0.00% | 0.00% | 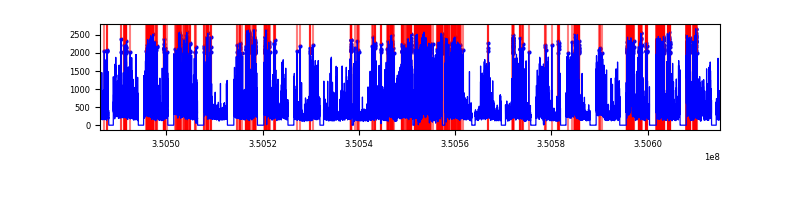 |
Top three noisy pixels from each quadrant. If the there are fewer than three noisy pixels in the level2.evt file, extra rows are filled as -1
| Pixel properties | Quadrant properties | ||||||
|---|---|---|---|---|---|---|---|
| Quadrant | DetID | PixID | Counts | Sigma | Mean | Median | Sigma |
| A | 0 | 29 | 6425 | 11.0 | 1782 | 1679 | 431.5 |
| A | 7 | 110 | 5520 | 8.9 | 1782 | 1679 | 431.5 |
| A | 0 | 30 | 5100 | 7.93 | 1782 | 1679 | 431.5 |
| B | 2 | 9 | 5338 | 10.94 | 1737 | 1661 | 336.1 |
| B | 2 | 8 | 4453 | 8.31 | 1737 | 1661 | 336.1 |
| B | 5 | 128 | 4422 | 8.22 | 1737 | 1661 | 336.1 |
| C | 1 | 80 | 5210 | 7.92 | 1766 | 1661 | 448.3 |
| C | 1 | 81 | 5133 | 7.75 | 1766 | 1661 | 448.3 |
| C | 12 | 241 | 4635 | 6.63 | 1766 | 1661 | 448.3 |
| D | 15 | 46 | 4102 | 6.39 | 1590 | 1455 | 414.3 |
| D | 3 | 14 | 3971 | 6.07 | 1590 | 1455 | 414.3 |
| D | 10 | 189 | 3870 | 5.83 | 1590 | 1455 | 414.3 |
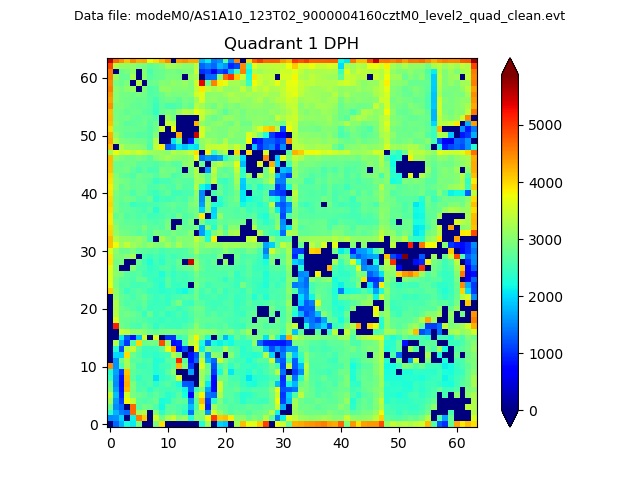
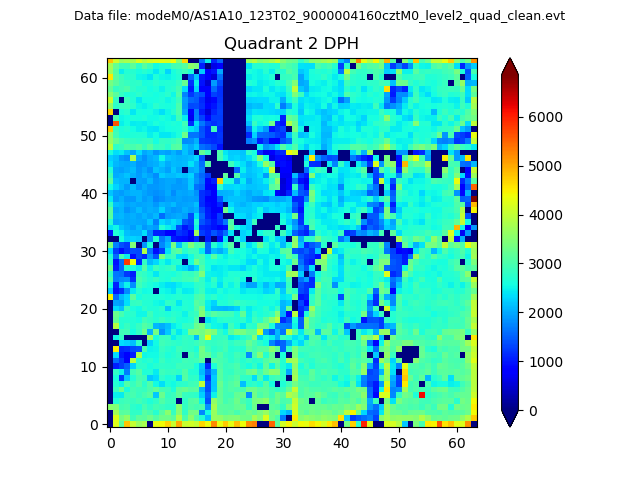
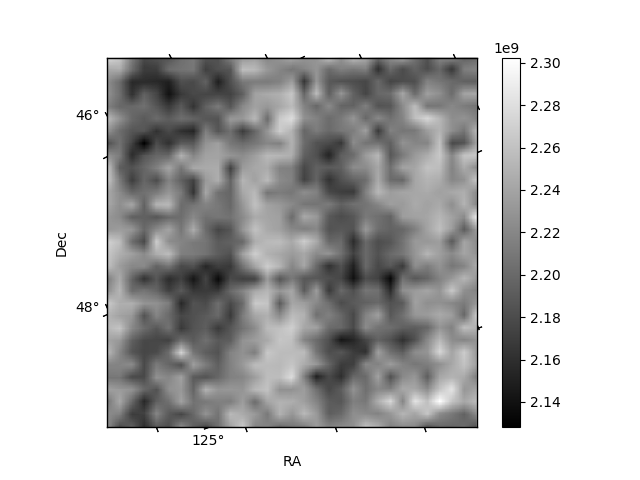
Histogram calculated using DETX and DETY for each event in the final _common_clean file
| Quadrant A | 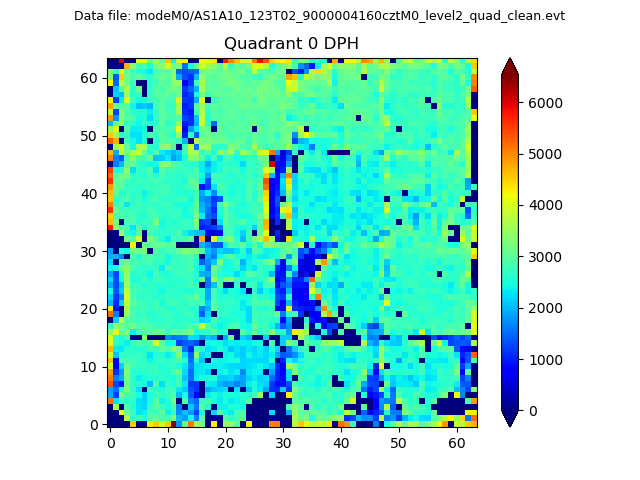 |
 |
Quadrant B |
|---|---|---|---|
| Quadrant D | 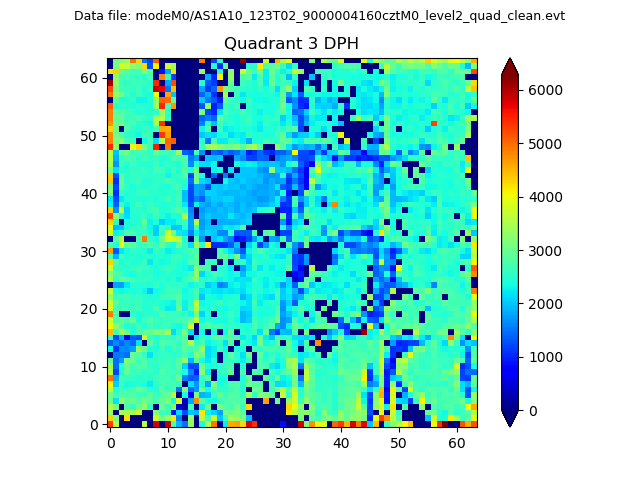 |
 |
Quadrant C |
| Plot type | Count rate plots | Images |
|---|---|---|
| Comparison with Poisson distribution Blue bars denote a histogram of data divided into 1 sec bins. Red curve is a Poisson curve with rate = median count rate of data. |
 |
 |
| Quadrant-wise count rates Data is divided into 100 sec bins |
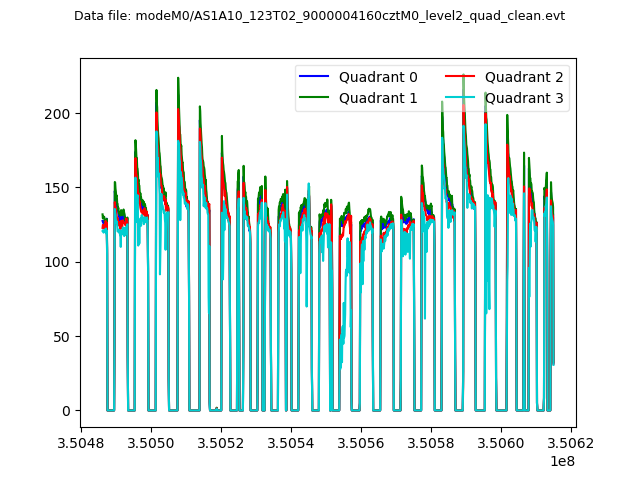 |
|
| Module-wise count rates for Quadrant A Data is divided into 100 sec bins |
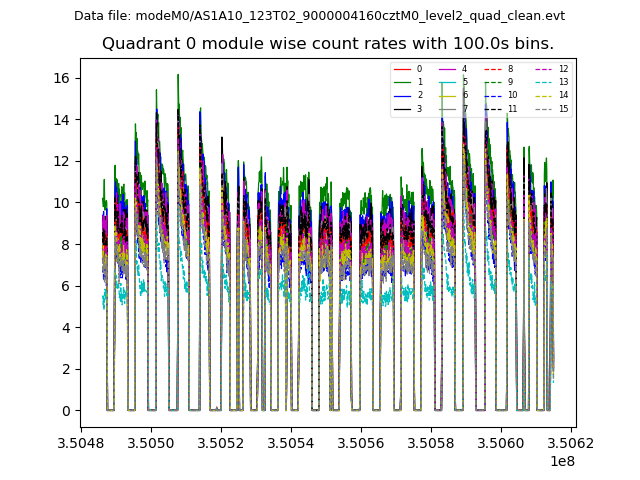 |
 |
| Module-wise count rates for Quadrant B Data is divided into 100 sec bins |
 |
 |
| Module-wise count rates for Quadrant C Data is divided into 100 sec bins |
 |
 |
| Module-wise count rates for Quadrant D Data is divided into 100 sec bins |
 |
 |
| Parameter | Plot |
|---|---|
| CZT HV Monitor | 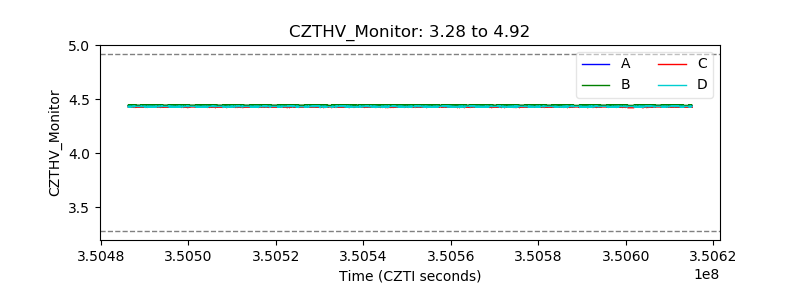 |
| D_VDD | 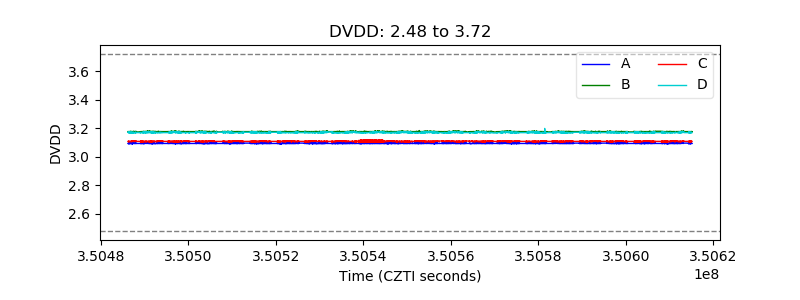 |
| Temperature 1 | 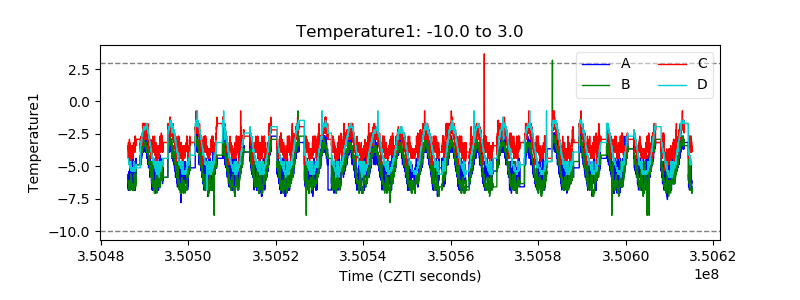 |
| Veto HV Monitor | 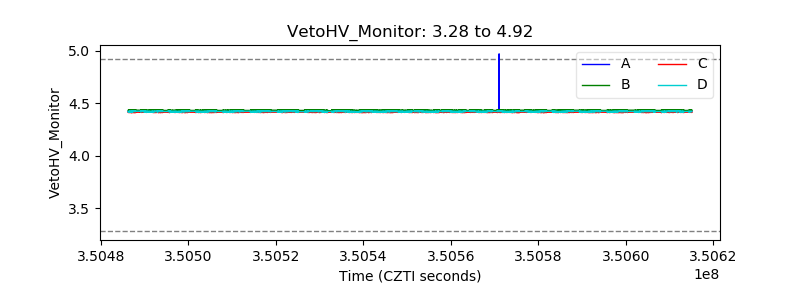 |
| Veto LLD | 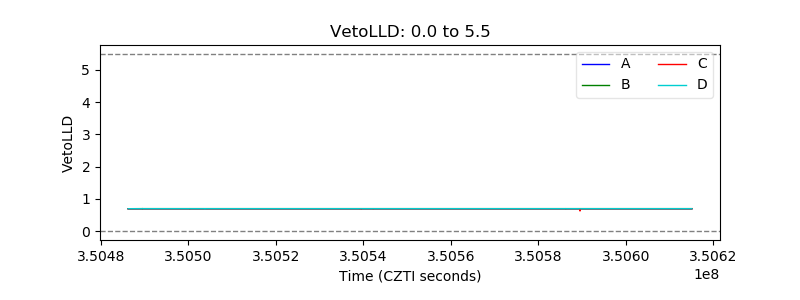 |
| Alpha Counter |  |
| _CPM_Rate | 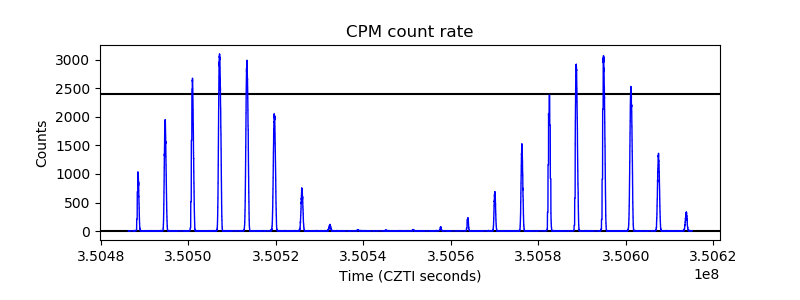 |
| CZT Counter | 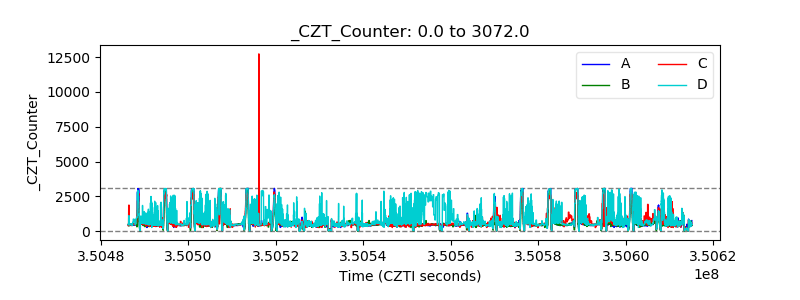 |
| +2.5 Volts monitor |  |
| +5 Volts monitor | 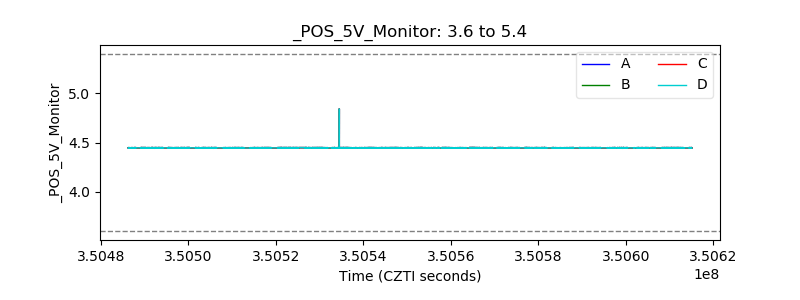 |
| _ROLL_ROT | 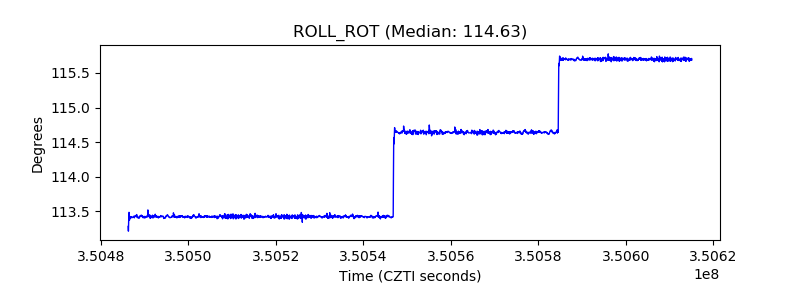 |
| _Roll_DEC |  |
| _Roll_RA | 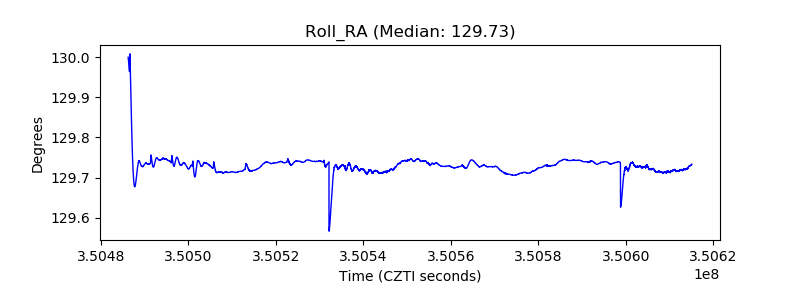 |
| Veto Counter | 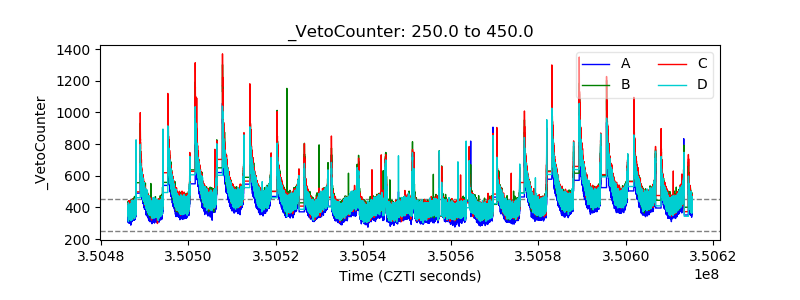 |