| Param | Original file | Final file |
|---|---|---|
| Filename | modeM0/AS1A10_123T02_9000004160_29017cztM0_level2.evt | modeM0/AS1A10_123T02_9000004160_29017cztM0_level2_quad_clean.evt |
| Size (bytes) | 246,291,840 | 43,413,120 |
| Size | 234.9 MB | 41.4 MB |
| Events in quadrant A | 1,626,341 | 275,475 |
| Events in quadrant B | 1,650,545 | 283,170 |
| Events in quadrant C | 1,670,659 | 267,338 |
| Events in quadrant D | 2,291,482 | 259,852 |
| Mode M9 | |||
|---|---|---|---|
| Quadrant | BADHDUFLAG | Total packets | Discarded packets |
| A | 0 | 10 | 0 |
| B | 0 | 10 | 0 |
| C | 0 | 10 | 0 |
| D | 0 | 10 | 0 |
| Mode SS | |||
|---|---|---|---|
| Quadrant | BADHDUFLAG | Total packets | Discarded packets |
| A | 0 | 66 | 0 |
| B | 0 | 66 | 0 |
| C | 0 | 66 | 0 |
| D | 0 | 66 | 0 |
| Mode M0 | |||
|---|---|---|---|
| Quadrant | BADHDUFLAG | Total packets | Discarded packets |
| A | 0 | 6888 | 1 |
| B | 0 | 6923 | 1 |
| C | 0 | 7029 | 1 |
| D | 0 | 9045 | 1 |
| Quadrant | Total seconds | Saturated seconds | Saturation percentage |
|---|---|---|---|
| A | 3215 | 54 | 1.679627% |
| B | 3214 | 68 | 2.115744% |
| C | 3214 | 82 | 2.551338% |
| D | 3214 | 85 | 2.644680% |
Noise dominated data is calculated using 1-second bins in cleaned event files. If a bin has >2000 counts, and if more than 50% of those come from <1% of pixels, then it is considered to be noise-dominated and hence unusable.
| Quadrant | # 1 sec bins | Bins with >0 counts | Bins with >2000 counts | High rate bins dominated by noise | Noise dominated (total time) | Noise dominated (detector-on time) | Marked lightcurve |
|---|---|---|---|---|---|---|---|
| A | 4170 | 3216 | 0 | 0 | 0.00% | 0.00% | 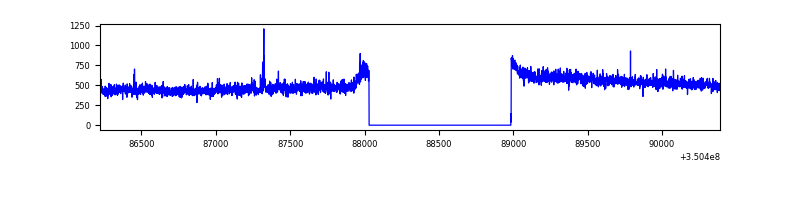 |
| B | 4169 | 3215 | 2 | 2 | 0.05% | 0.06% | 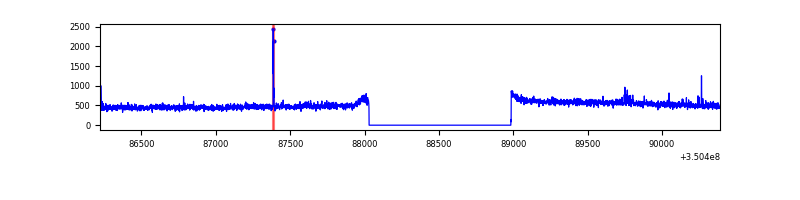 |
| C | 4169 | 3215 | 1 | 1 | 0.02% | 0.03% | 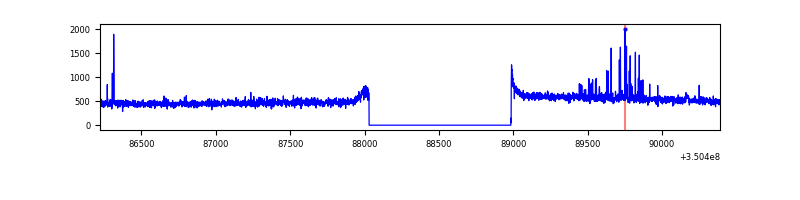 |
| D | 4169 | 3215 | 31 | 31 | 0.74% | 0.96% | 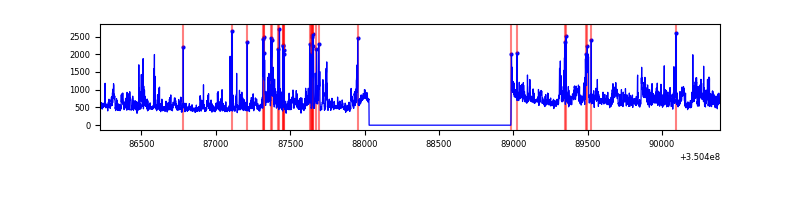 |
Top three noisy pixels from each quadrant. If the there are fewer than three noisy pixels in the level2.evt file, extra rows are filled as -1
| Pixel properties | Quadrant properties | ||||||
|---|---|---|---|---|---|---|---|
| Quadrant | DetID | PixID | Counts | Sigma | Mean | Median | Sigma |
| A | 1 | 113 | 9573 | 108.56 | 417 | 409 | 84.4 |
| A | 13 | 254 | 5506 | 60.38 | 417 | 409 | 84.4 |
| A | 6 | 16 | 5429 | 59.47 | 417 | 409 | 84.4 |
| B | 12 | 111 | 10168 | 120.61 | 413 | 403 | 81.0 |
| B | 11 | 111 | 9114 | 107.59 | 413 | 403 | 81.0 |
| B | 14 | 111 | 8782 | 103.49 | 413 | 403 | 81.0 |
| C | 14 | 238 | 65084 | 681.98 | 398 | 398 | 94.9 |
| C | 2 | 16 | 38401 | 400.66 | 398 | 398 | 94.9 |
| C | 2 | 114 | 7540 | 75.3 | 398 | 398 | 94.9 |
| D | 1 | 52 | 502881 | 5213.35 | 398 | 387 | 96.4 |
| D | 8 | 195 | 220574 | 2284.43 | 398 | 387 | 96.4 |
| D | 7 | 80 | 58553 | 603.47 | 398 | 387 | 96.4 |
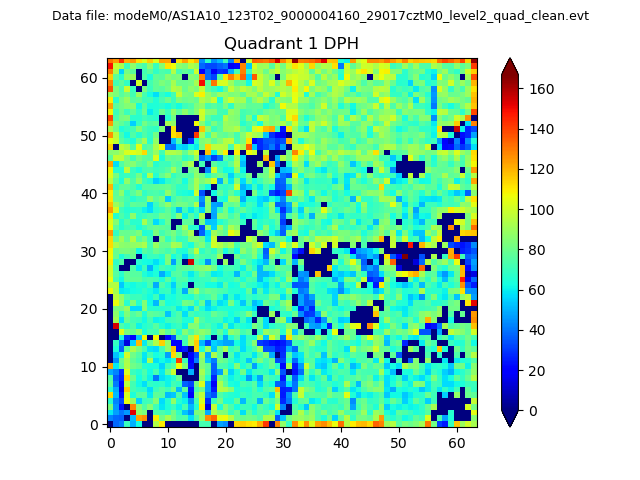
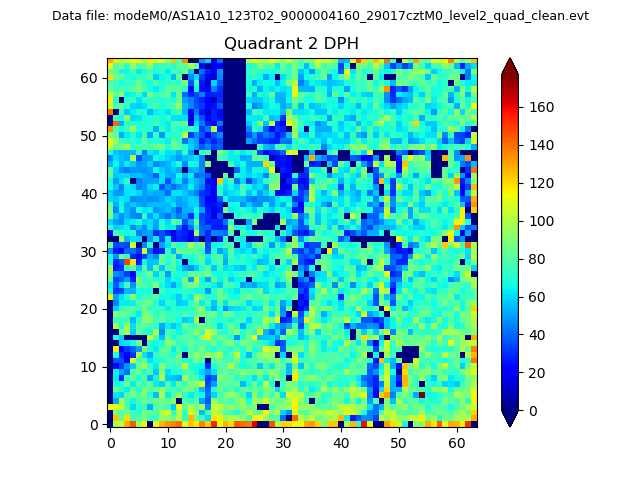
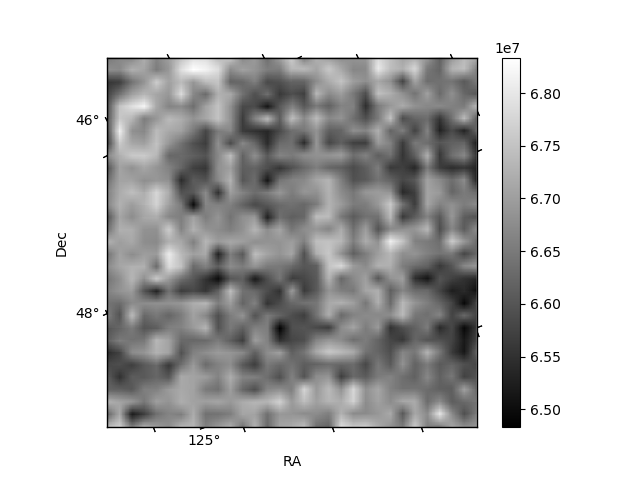
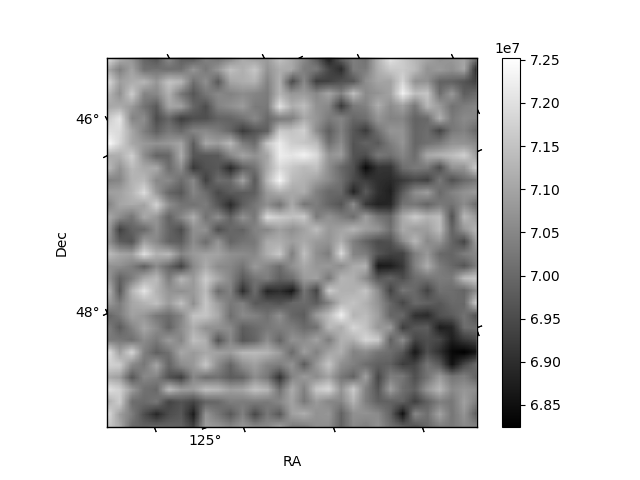
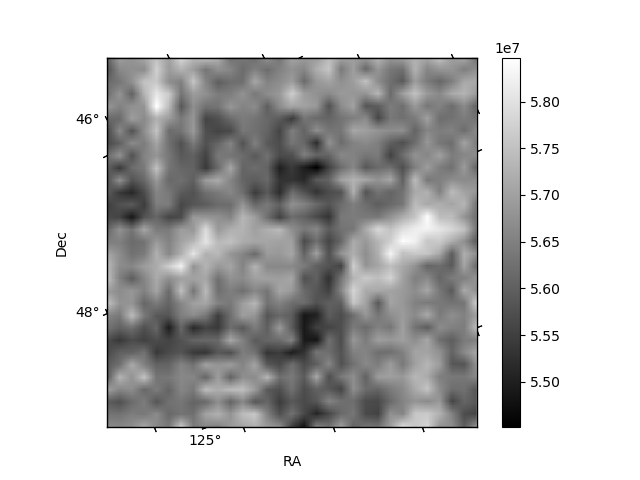
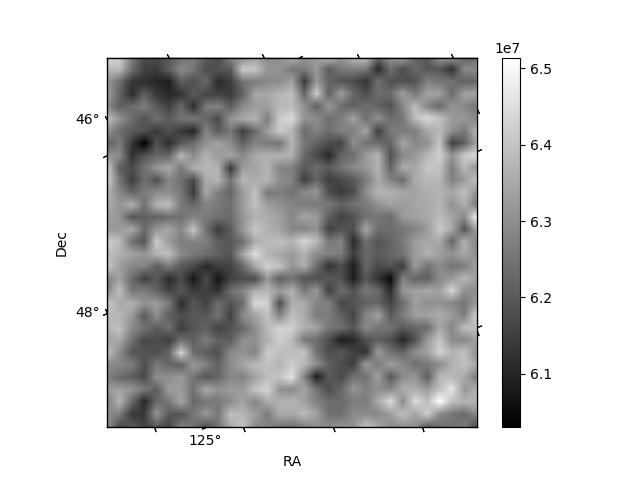
Histogram calculated using DETX and DETY for each event in the final _common_clean file
| Quadrant A |  |
 |
Quadrant B |
|---|---|---|---|
| Quadrant D | 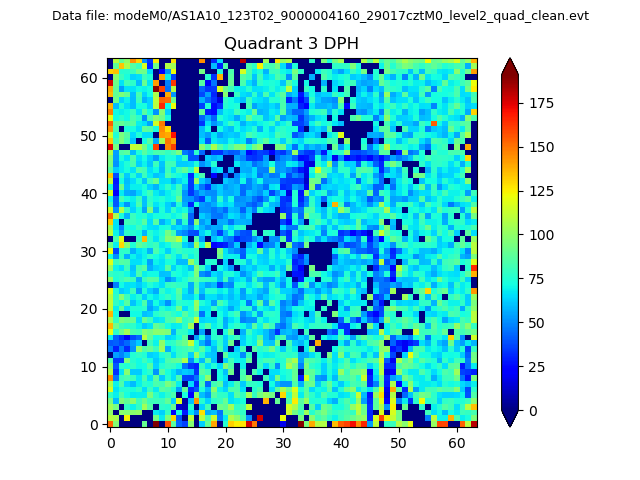 |
 |
Quadrant C |
| Plot type | Count rate plots | Images |
|---|---|---|
| Comparison with Poisson distribution Blue bars denote a histogram of data divided into 1 sec bins. Red curve is a Poisson curve with rate = median count rate of data. |
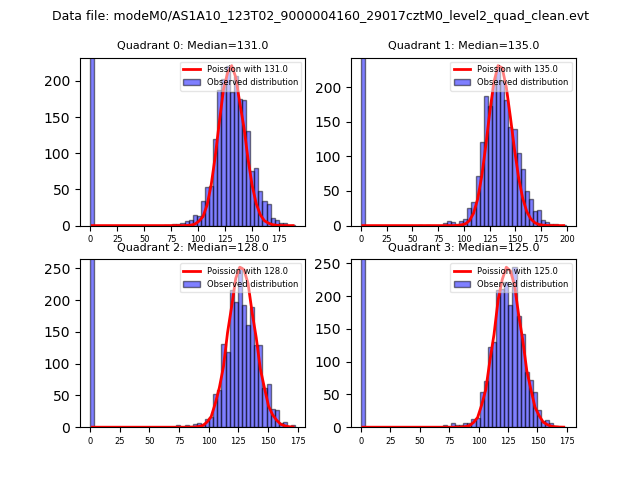 |
 |
| Quadrant-wise count rates Data is divided into 100 sec bins |
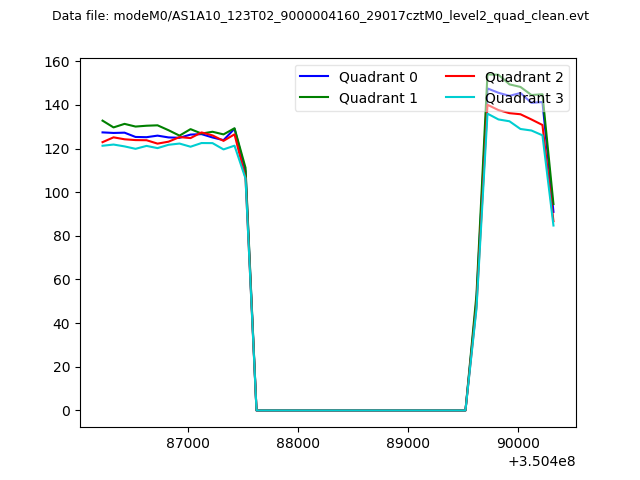 |
|
| Module-wise count rates for Quadrant A Data is divided into 100 sec bins |
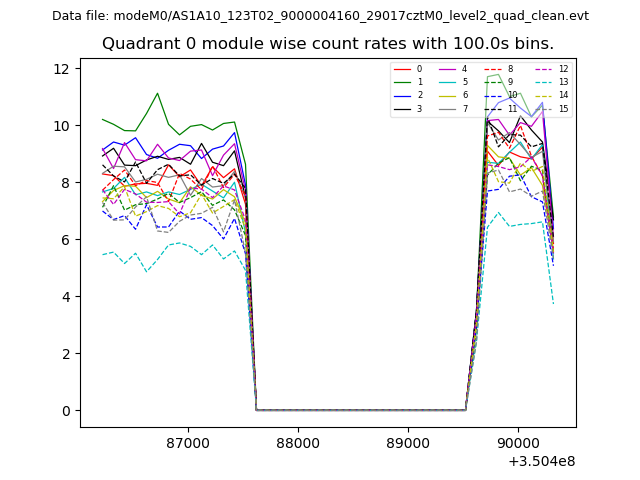 |
 |
| Module-wise count rates for Quadrant B Data is divided into 100 sec bins |
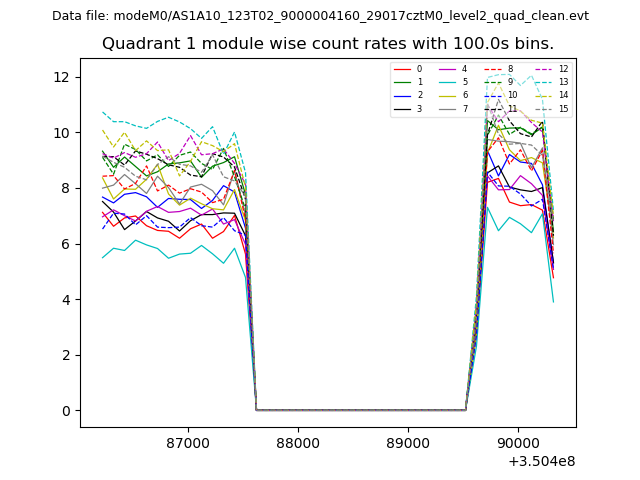 |
 |
| Module-wise count rates for Quadrant C Data is divided into 100 sec bins |
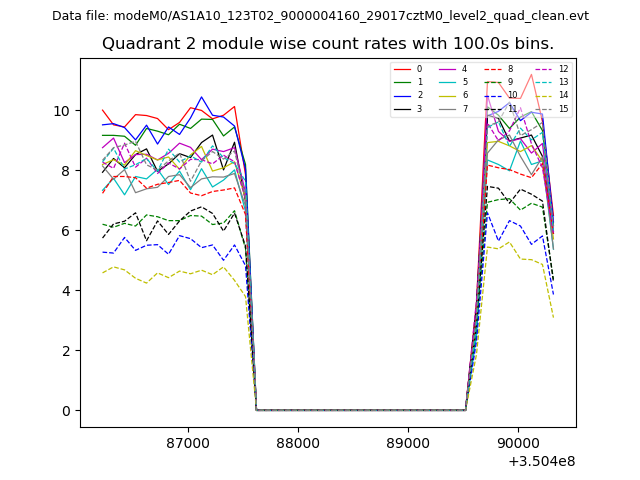 |
 |
| Module-wise count rates for Quadrant D Data is divided into 100 sec bins |
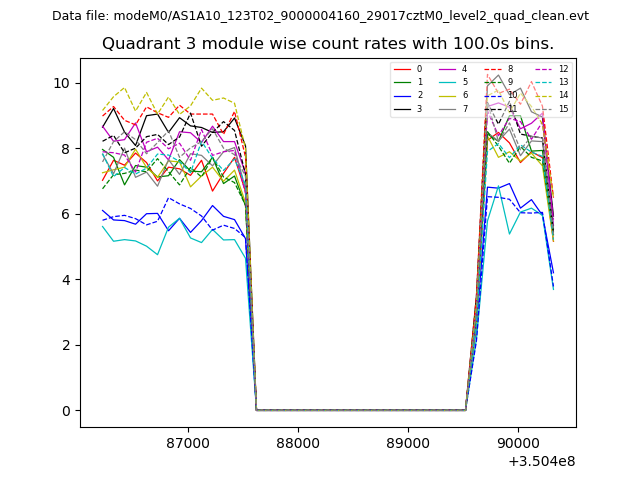 |
 |
| Parameter | Plot |
|---|---|
| CZT HV Monitor | 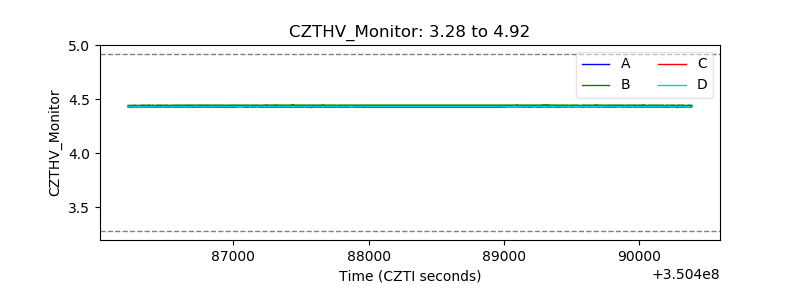 |
| D_VDD | 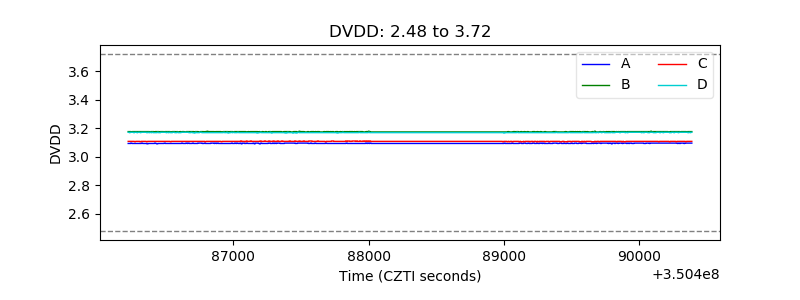 |
| Temperature 1 | 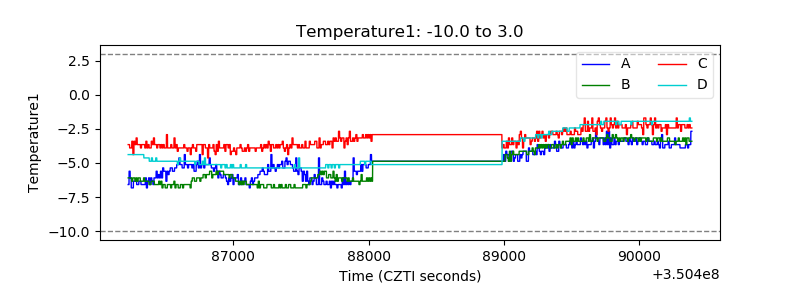 |
| Veto HV Monitor | 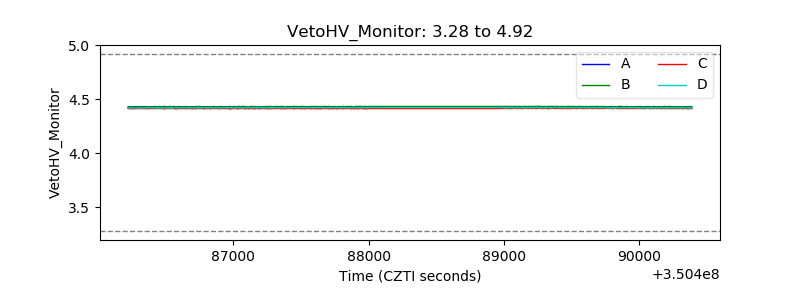 |
| Veto LLD |  |
| Alpha Counter | 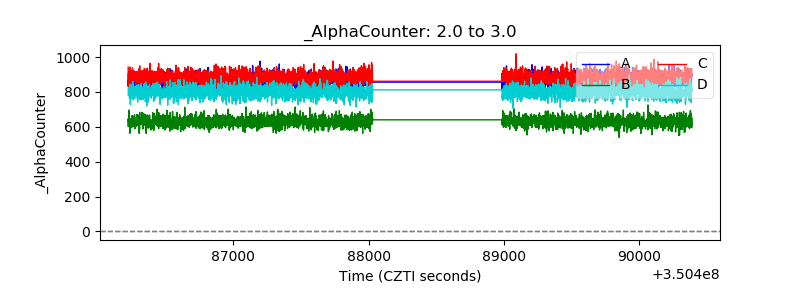 |
| _CPM_Rate | 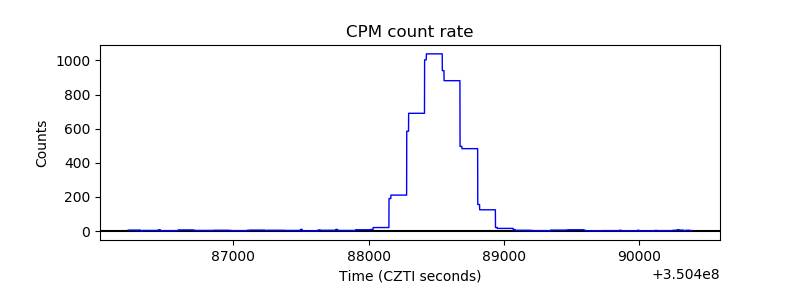 |
| CZT Counter | 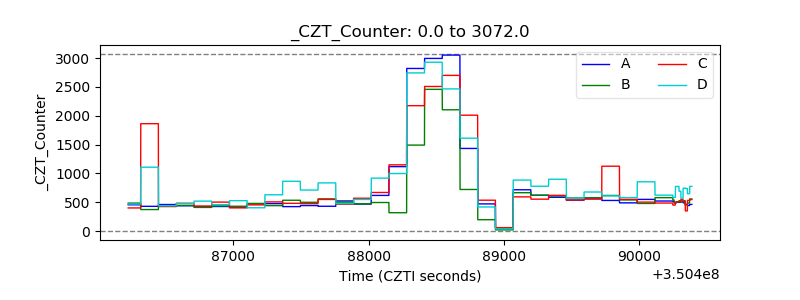 |
| +2.5 Volts monitor |  |
| +5 Volts monitor |  |
| _ROLL_ROT | 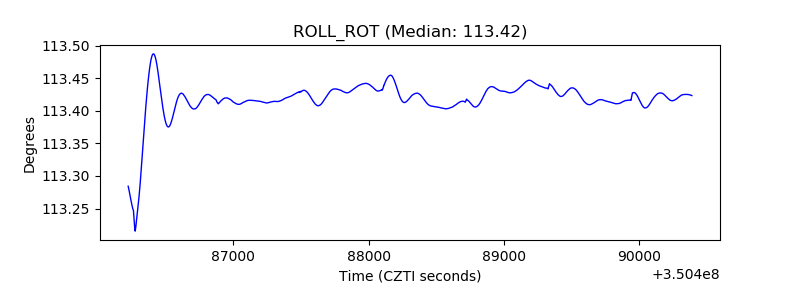 |
| _Roll_DEC | 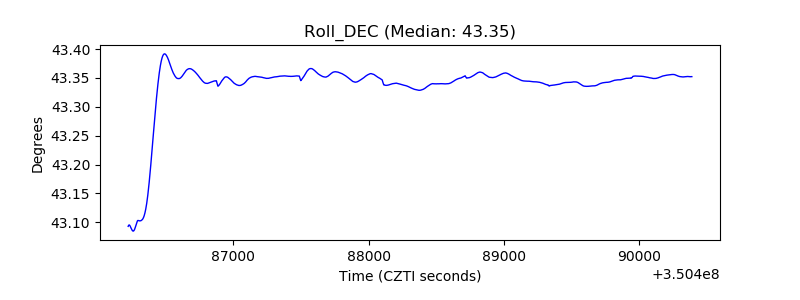 |
| _Roll_RA |  |
| Veto Counter | 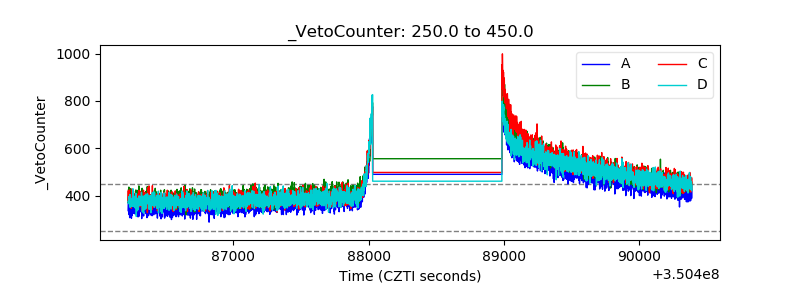 |