| Param | Original file | Final file |
|---|---|---|
| Filename | modeM0/AS1A10_123T02_9000004160_29019cztM0_level2.evt | modeM0/AS1A10_123T02_9000004160_29019cztM0_level2_quad_clean.evt |
| Size (bytes) | 522,132,480 | 99,855,360 |
| Size | 497.9 MB | 95.2 MB |
| Events in quadrant A | 3,211,899 | 659,231 |
| Events in quadrant B | 3,262,909 | 680,423 |
| Events in quadrant C | 3,313,158 | 636,775 |
| Events in quadrant D | 5,590,152 | 600,324 |
| Mode M9 | |||
|---|---|---|---|
| Quadrant | BADHDUFLAG | Total packets | Discarded packets |
| A | 0 | 11 | 0 |
| B | 0 | 11 | 0 |
| C | 0 | 11 | 0 |
| D | 0 | 11 | 0 |
| Mode SS | |||
|---|---|---|---|
| Quadrant | BADHDUFLAG | Total packets | Discarded packets |
| A | 0 | 130 | 0 |
| B | 0 | 130 | 0 |
| C | 0 | 130 | 0 |
| D | 0 | 130 | 0 |
| Mode M0 | |||
|---|---|---|---|
| Quadrant | BADHDUFLAG | Total packets | Discarded packets |
| A | 0 | 13890 | 2 |
| B | 0 | 13940 | 2 |
| C | 0 | 14089 | 2 |
| D | 0 | 21101 | 2 |
| Quadrant | Total seconds | Saturated seconds | Saturation percentage |
|---|---|---|---|
| A | 6411 | 64 | 0.998284% |
| B | 6412 | 72 | 1.122895% |
| C | 6412 | 111 | 1.731129% |
| D | 6412 | 417 | 6.503431% |
Noise dominated data is calculated using 1-second bins in cleaned event files. If a bin has >2000 counts, and if more than 50% of those come from <1% of pixels, then it is considered to be noise-dominated and hence unusable.
| Quadrant | # 1 sec bins | Bins with >0 counts | Bins with >2000 counts | High rate bins dominated by noise | Noise dominated (total time) | Noise dominated (detector-on time) | Marked lightcurve |
|---|---|---|---|---|---|---|---|
| A | 7511 | 6412 | 0 | 0 | 0.00% | 0.00% | 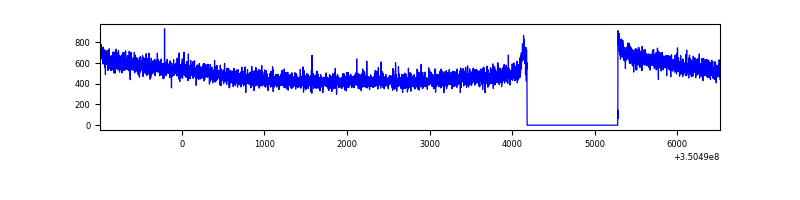 |
| B | 7512 | 6413 | 2 | 2 | 0.03% | 0.03% | 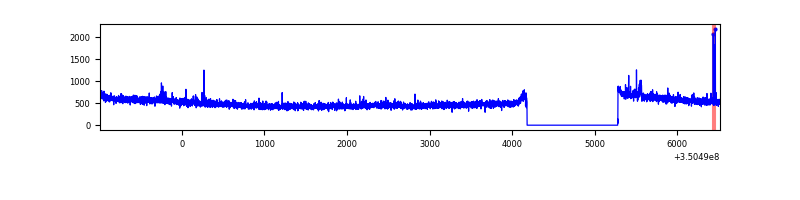 |
| C | 7512 | 6413 | 4 | 4 | 0.05% | 0.06% | 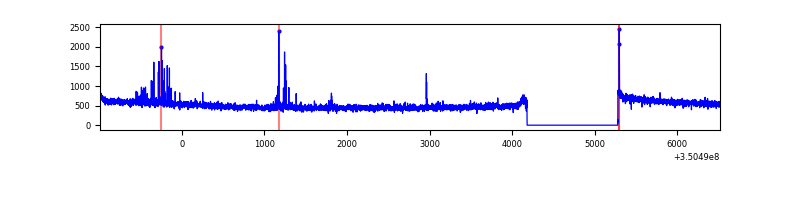 |
| D | 7512 | 6413 | 326 | 326 | 4.34% | 5.08% | 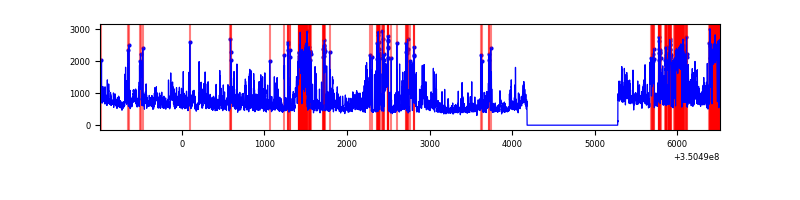 |
Top three noisy pixels from each quadrant. If the there are fewer than three noisy pixels in the level2.evt file, extra rows are filled as -1
| Pixel properties | Quadrant properties | ||||||
|---|---|---|---|---|---|---|---|
| Quadrant | DetID | PixID | Counts | Sigma | Mean | Median | Sigma |
| A | 13 | 254 | 10805 | 60.49 | 830 | 813 | 165.2 |
| A | 3 | 137 | 8048 | 43.8 | 830 | 813 | 165.2 |
| A | 0 | 226 | 6999 | 37.45 | 830 | 813 | 165.2 |
| B | 0 | 190 | 25273 | 155.99 | 822 | 801 | 156.9 |
| B | 12 | 111 | 19041 | 116.27 | 822 | 801 | 156.9 |
| B | 11 | 111 | 17425 | 105.97 | 822 | 801 | 156.9 |
| C | 14 | 238 | 128242 | 681.25 | 795 | 800 | 187.1 |
| C | 2 | 16 | 68761 | 363.29 | 795 | 800 | 187.1 |
| C | 2 | 114 | 14860 | 75.16 | 795 | 800 | 187.1 |
| D | 1 | 52 | 1355178 | 7316.72 | 791 | 771 | 185.1 |
| D | 7 | 80 | 786587 | 4245.1 | 791 | 771 | 185.1 |
| D | 8 | 195 | 442730 | 2387.53 | 791 | 771 | 185.1 |
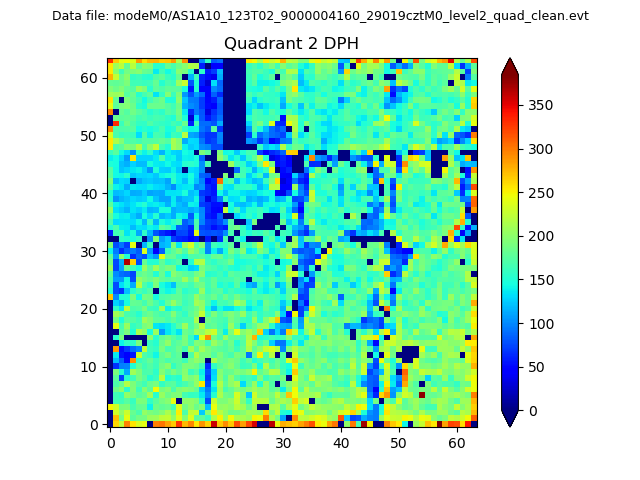
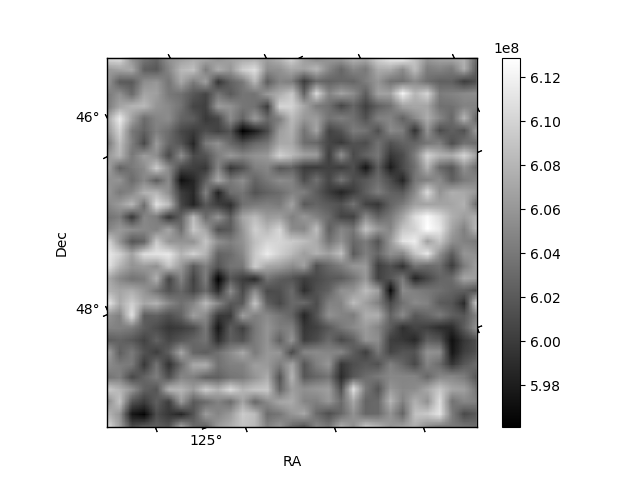
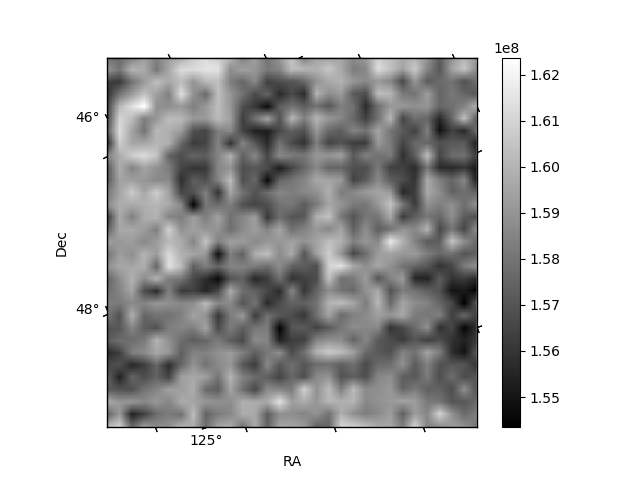
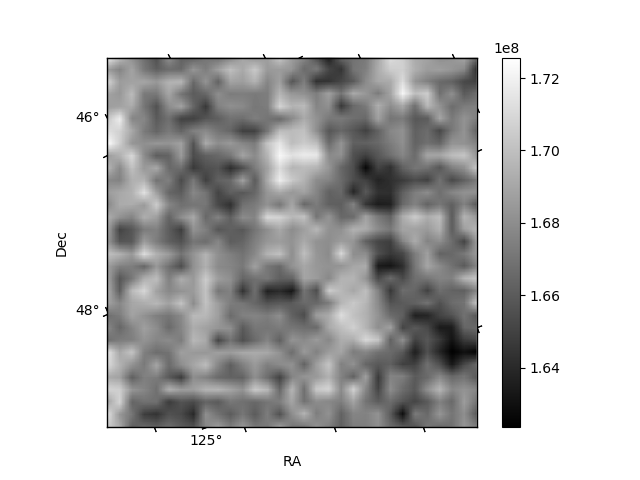
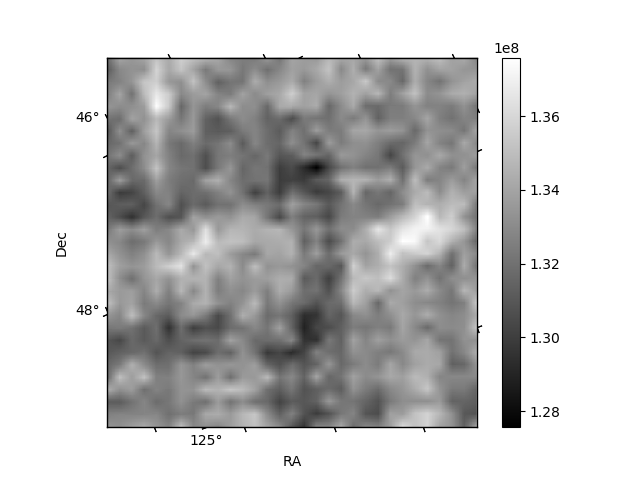
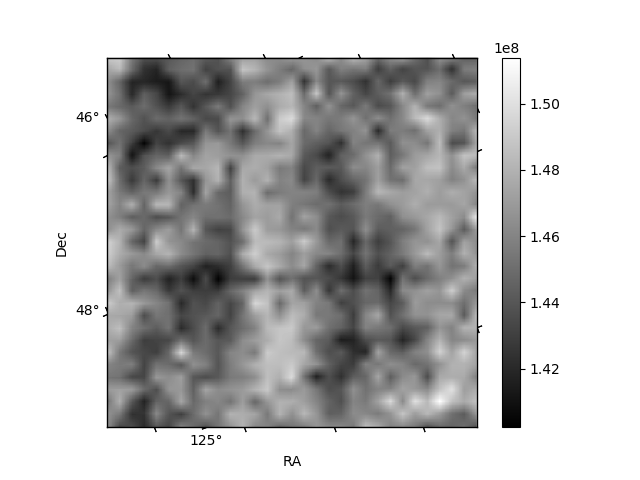
Histogram calculated using DETX and DETY for each event in the final _common_clean file
| Quadrant A | 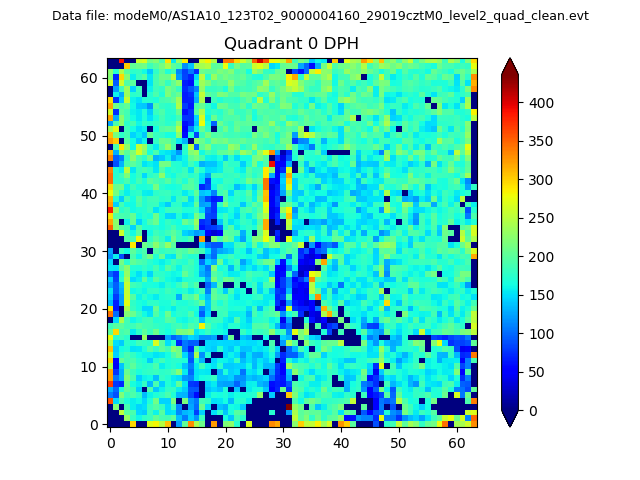 |
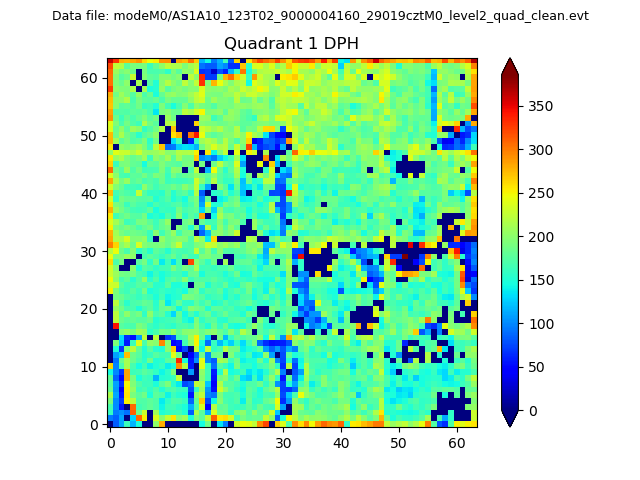 |
Quadrant B |
|---|---|---|---|
| Quadrant D | 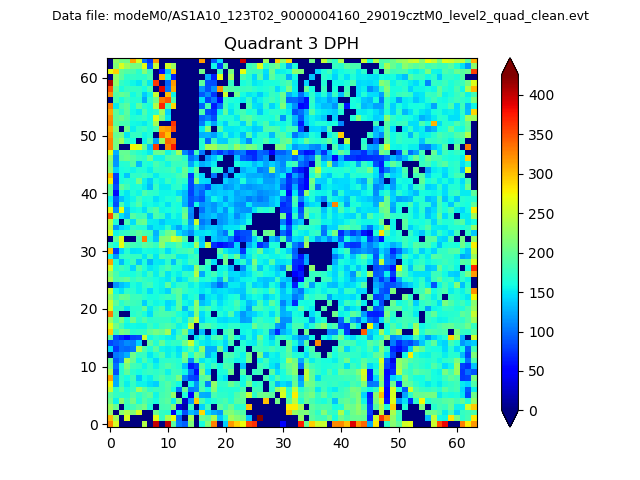 |
 |
Quadrant C |
| Plot type | Count rate plots | Images |
|---|---|---|
| Comparison with Poisson distribution Blue bars denote a histogram of data divided into 1 sec bins. Red curve is a Poisson curve with rate = median count rate of data. |
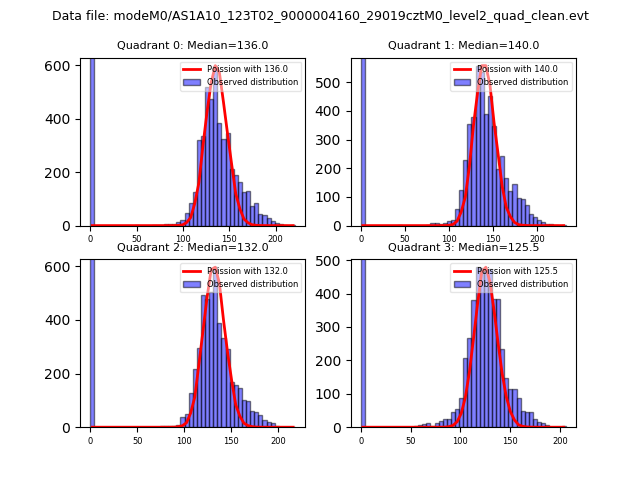 |
 |
| Quadrant-wise count rates Data is divided into 100 sec bins |
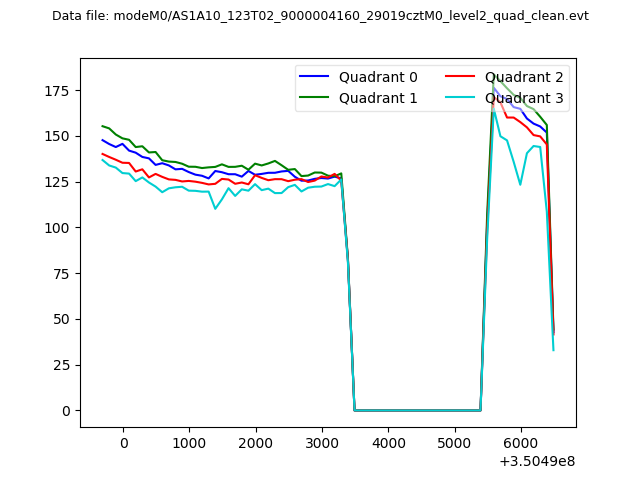 |
|
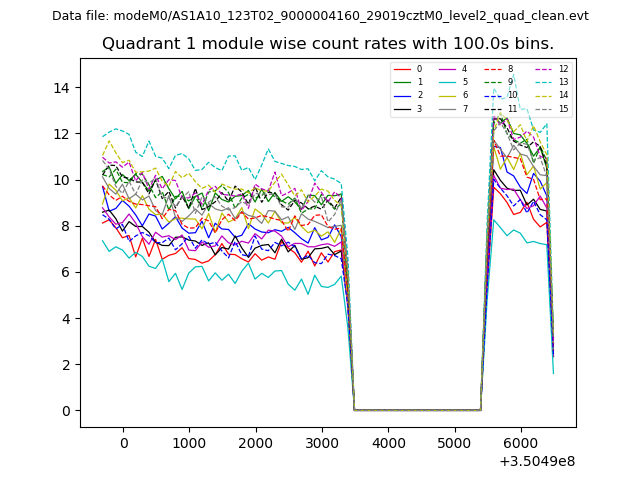
| Module-wise count rates for Quadrant A Data is divided into 100 sec bins |
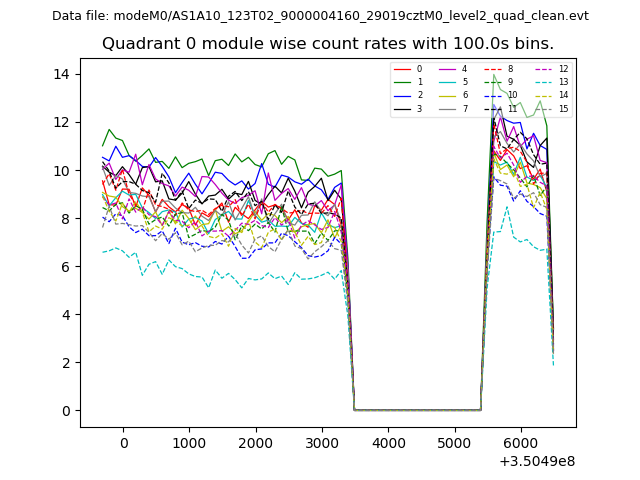 |
 |
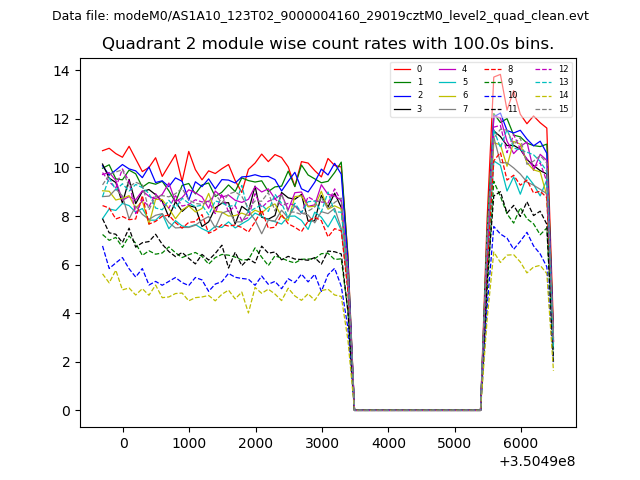
| Module-wise count rates for Quadrant B Data is divided into 100 sec bins |
 |
 |
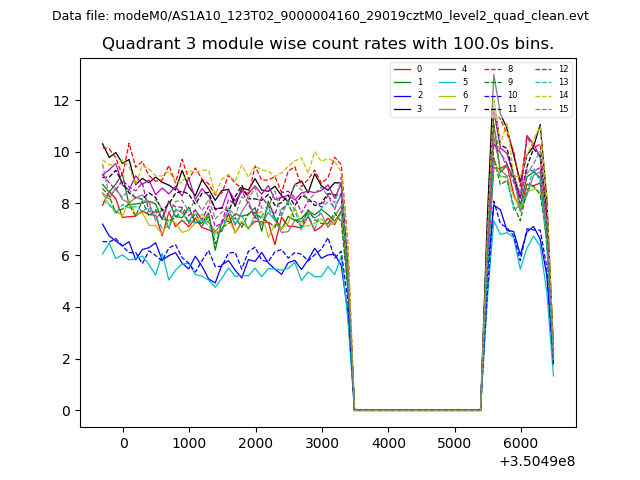
| Module-wise count rates for Quadrant C Data is divided into 100 sec bins |
 |
 |
| Module-wise count rates for Quadrant D Data is divided into 100 sec bins |
 |
 |
| Parameter | Plot |
|---|---|
| CZT HV Monitor | 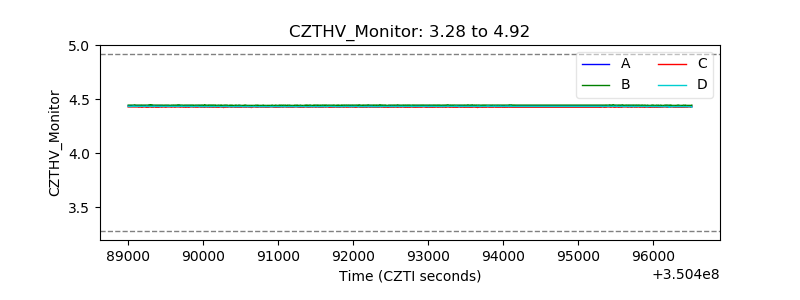 |
| D_VDD | 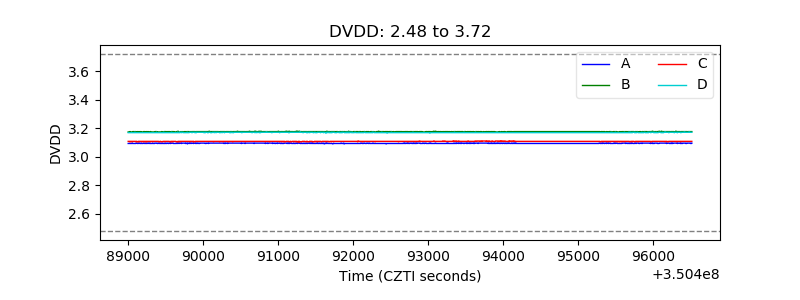 |
| Temperature 1 | 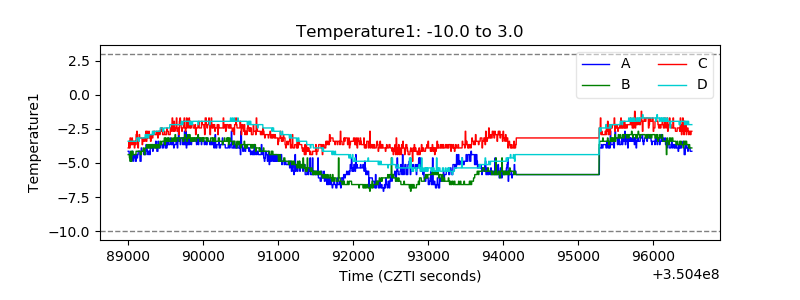 |
| Veto HV Monitor | 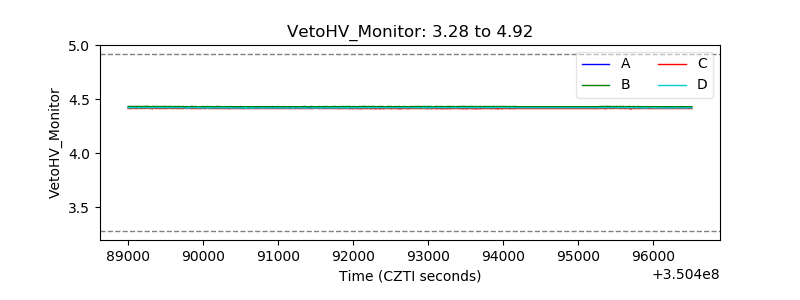 |
| Veto LLD | 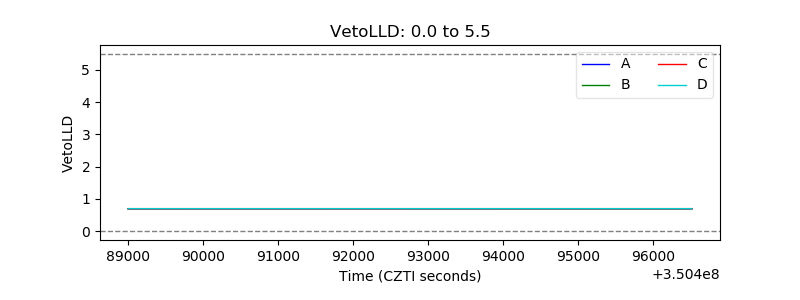 |
| Alpha Counter | 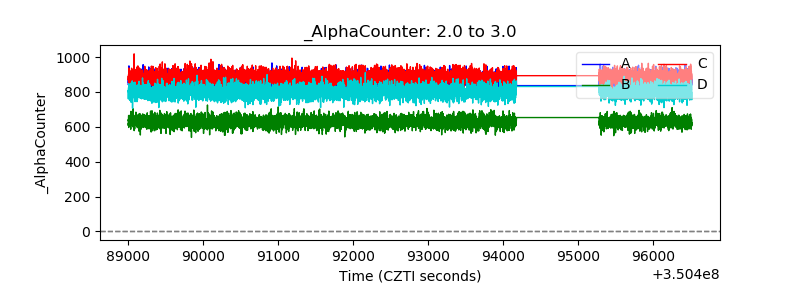 |
| _CPM_Rate | 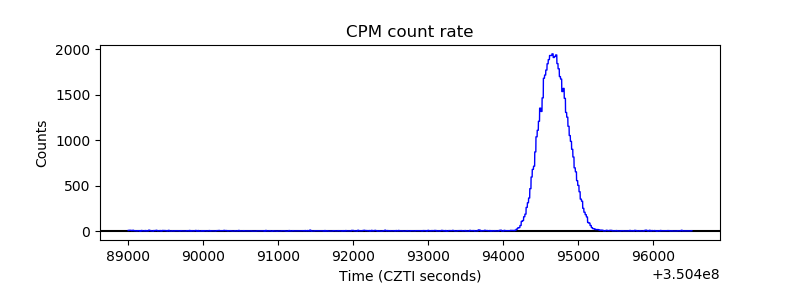 |
| CZT Counter | 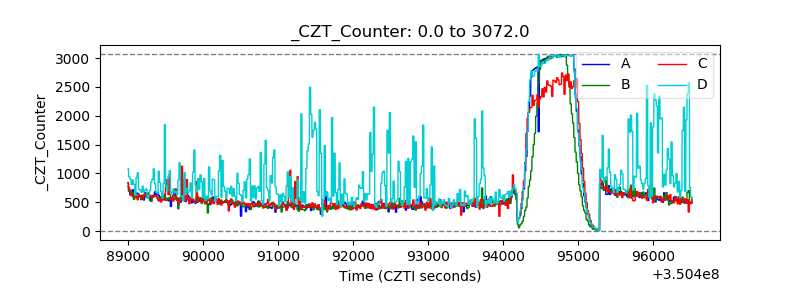 |
| +2.5 Volts monitor |  |
| +5 Volts monitor |  |
| _ROLL_ROT | 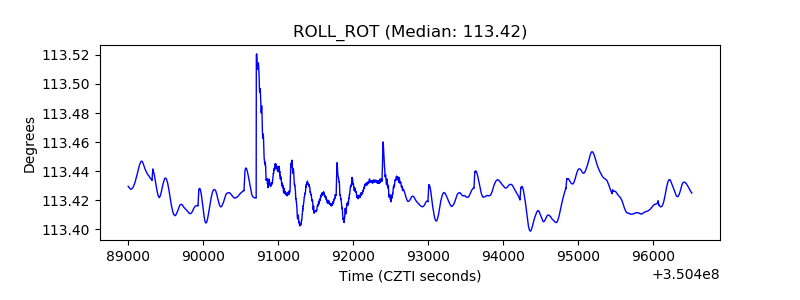 |
| _Roll_DEC | 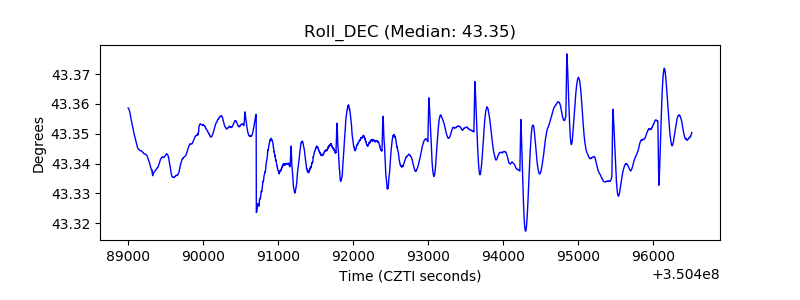 |
| _Roll_RA | 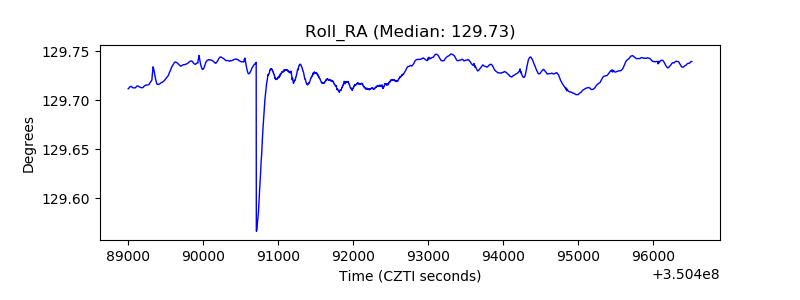 |
| Veto Counter | 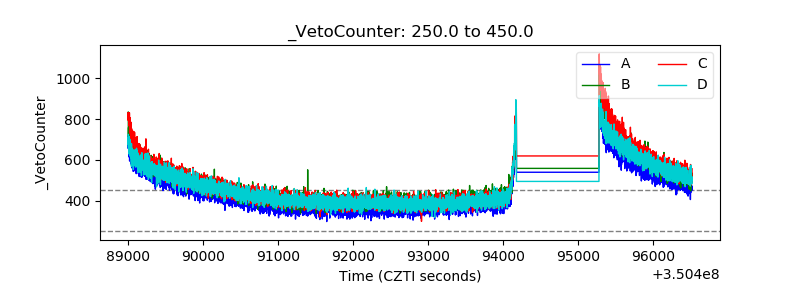 |