| Param | Original file | Final file |
|---|---|---|
| Filename | modeM0/AS1A10_123T02_9000004160_29021cztM0_level2.evt | modeM0/AS1A10_123T02_9000004160_29021cztM0_level2_quad_clean.evt |
| Size (bytes) | 545,005,440 | 117,656,640 |
| Size | 519.8 MB | 112.2 MB |
| Events in quadrant A | 3,286,189 | 796,117 |
| Events in quadrant B | 3,361,708 | 829,326 |
| Events in quadrant C | 3,423,192 | 788,005 |
| Events in quadrant D | 6,012,389 | 715,171 |
| Mode M9 | |||
|---|---|---|---|
| Quadrant | BADHDUFLAG | Total packets | Discarded packets |
| A | 0 | 13 | 0 |
| B | 0 | 14 | 0 |
| C | 0 | 14 | 0 |
| D | 0 | 14 | 0 |
| Mode SS | |||
|---|---|---|---|
| Quadrant | BADHDUFLAG | Total packets | Discarded packets |
| A | 0 | 126 | 0 |
| B | 0 | 126 | 0 |
| C | 0 | 126 | 0 |
| D | 0 | 126 | 0 |
| Mode M0 | |||
|---|---|---|---|
| Quadrant | BADHDUFLAG | Total packets | Discarded packets |
| A | 0 | 13825 | 2 |
| B | 0 | 14020 | 2 |
| C | 0 | 14280 | 2 |
| D | 0 | 22179 | 2 |
| Quadrant | Total seconds | Saturated seconds | Saturation percentage |
|---|---|---|---|
| A | 6231 | 57 | 0.914781% |
| B | 6230 | 65 | 1.043339% |
| C | 6230 | 119 | 1.910112% |
| D | 6230 | 673 | 10.802568% |
Noise dominated data is calculated using 1-second bins in cleaned event files. If a bin has >2000 counts, and if more than 50% of those come from <1% of pixels, then it is considered to be noise-dominated and hence unusable.
| Quadrant | # 1 sec bins | Bins with >0 counts | Bins with >2000 counts | High rate bins dominated by noise | Noise dominated (total time) | Noise dominated (detector-on time) | Marked lightcurve |
|---|---|---|---|---|---|---|---|
| A | 7521 | 6232 | 0 | 0 | 0.00% | 0.00% | 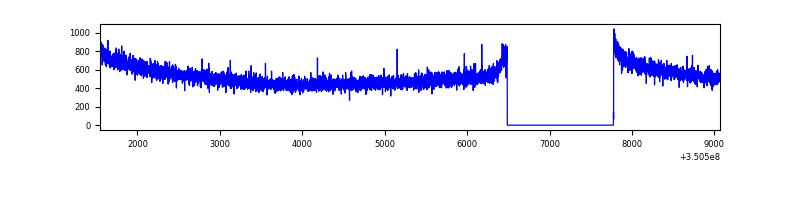 |
| B | 7520 | 6231 | 3 | 3 | 0.04% | 0.05% | 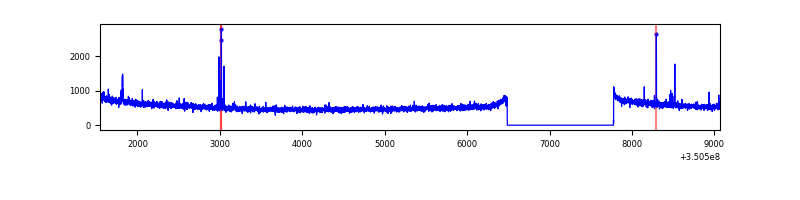 |
| C | 7520 | 6231 | 2 | 2 | 0.03% | 0.03% | 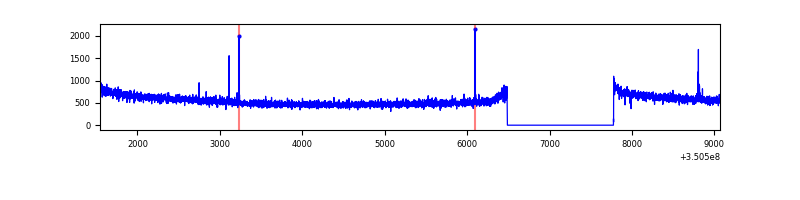 |
| D | 7520 | 6231 | 527 | 527 | 7.01% | 8.46% | 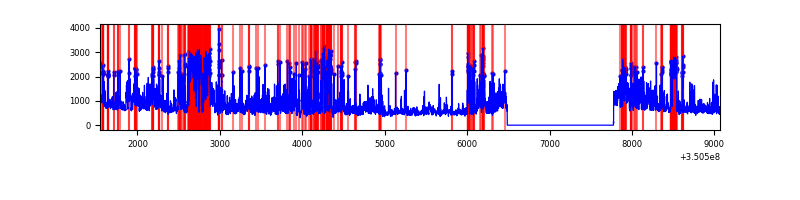 |
Top three noisy pixels from each quadrant. If the there are fewer than three noisy pixels in the level2.evt file, extra rows are filled as -1
| Pixel properties | Quadrant properties | ||||||
|---|---|---|---|---|---|---|---|
| Quadrant | DetID | PixID | Counts | Sigma | Mean | Median | Sigma |
| A | 13 | 254 | 10450 | 57.44 | 850 | 836 | 167.4 |
| A | 3 | 137 | 7699 | 41.0 | 850 | 836 | 167.4 |
| A | 0 | 226 | 7174 | 37.87 | 850 | 836 | 167.4 |
| B | 5 | 172 | 24220 | 148.28 | 848 | 827 | 157.8 |
| B | 0 | 190 | 19180 | 116.33 | 848 | 827 | 157.8 |
| B | 12 | 111 | 18539 | 112.27 | 848 | 827 | 157.8 |
| C | 14 | 238 | 134926 | 698.46 | 833 | 840 | 192.0 |
| C | 2 | 16 | 15904 | 78.47 | 833 | 840 | 192.0 |
| C | 2 | 114 | 15409 | 75.89 | 833 | 840 | 192.0 |
| D | 1 | 52 | 2210727 | 11820.98 | 802 | 784 | 187.0 |
| D | 8 | 195 | 417770 | 2230.46 | 802 | 784 | 187.0 |
| D | 7 | 80 | 295220 | 1574.94 | 802 | 784 | 187.0 |
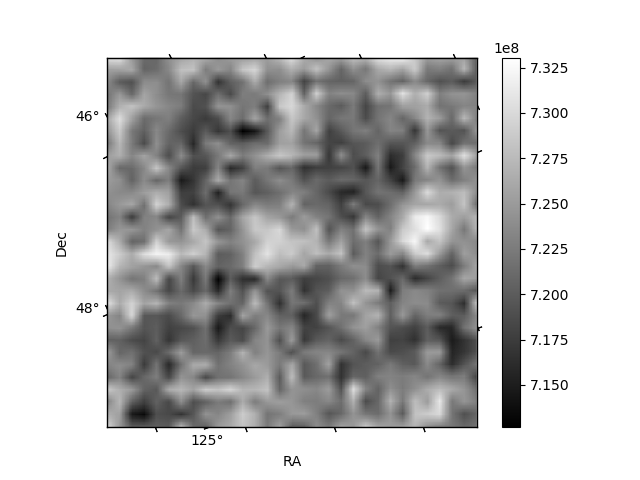
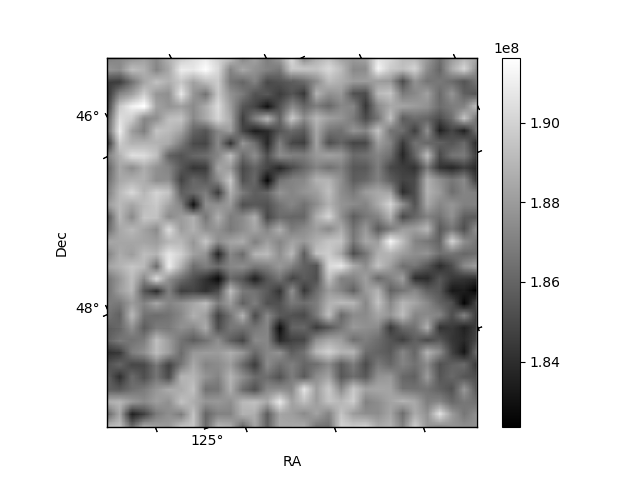
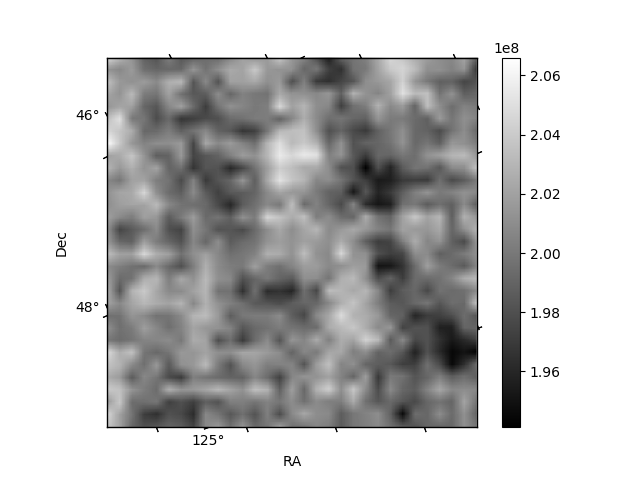
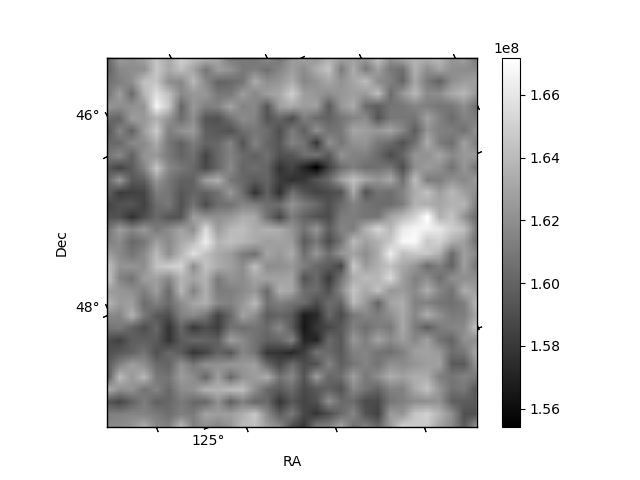
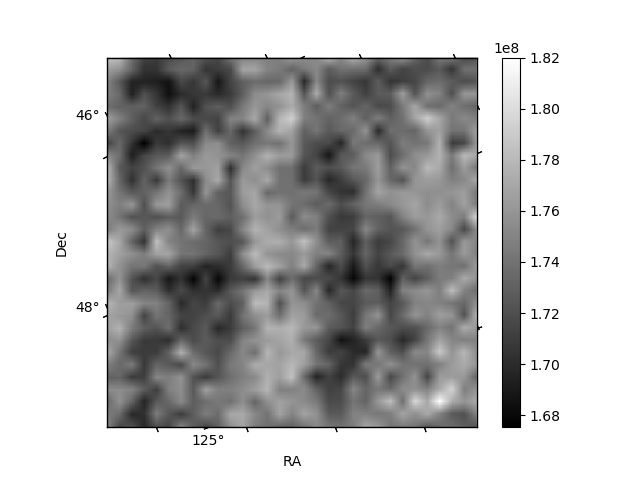
Histogram calculated using DETX and DETY for each event in the final _common_clean file
| Quadrant A | 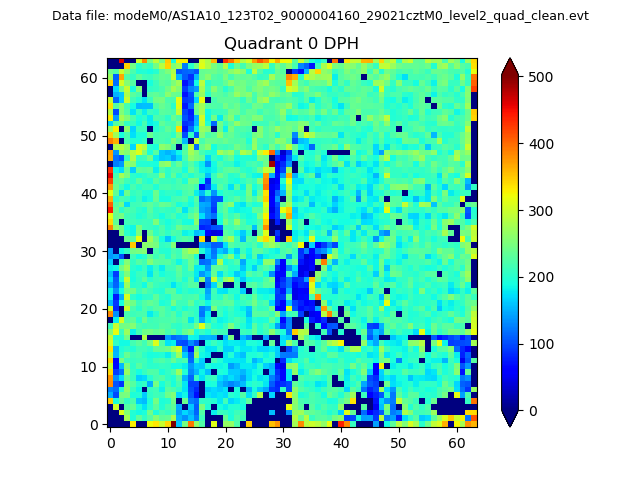 |
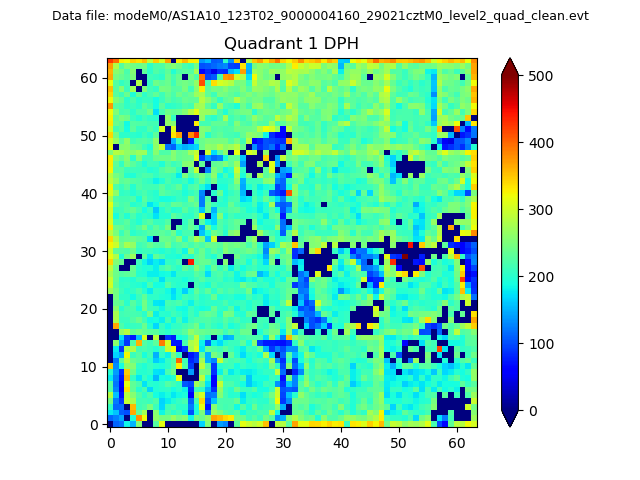 |
Quadrant B |
|---|---|---|---|
| Quadrant D |  |
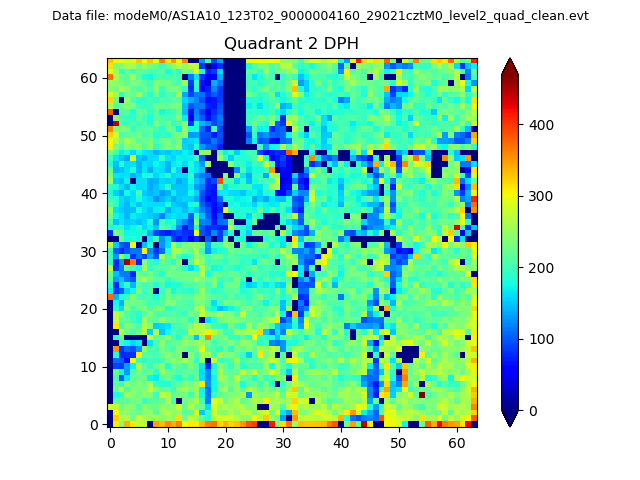 |
Quadrant C |
| Plot type | Count rate plots | Images |
|---|---|---|
| Comparison with Poisson distribution Blue bars denote a histogram of data divided into 1 sec bins. Red curve is a Poisson curve with rate = median count rate of data. |
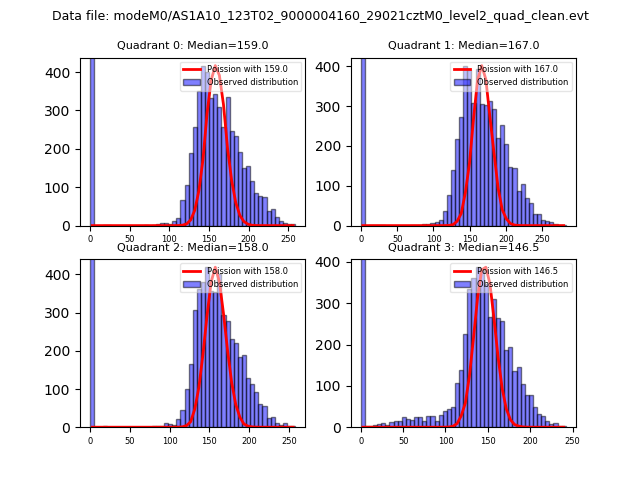 |
 |
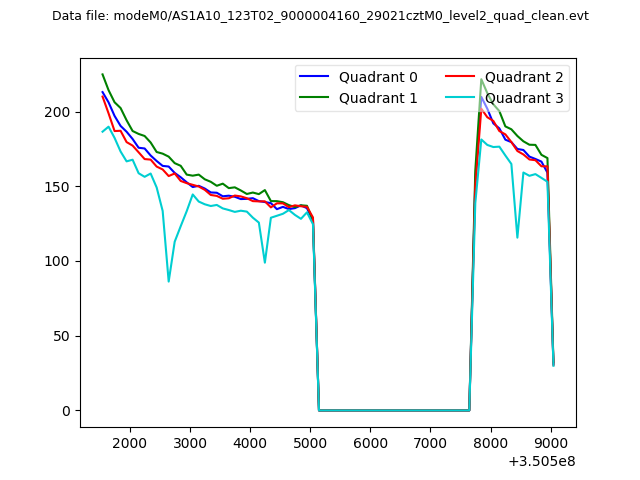
| Quadrant-wise count rates Data is divided into 100 sec bins |
 |
|
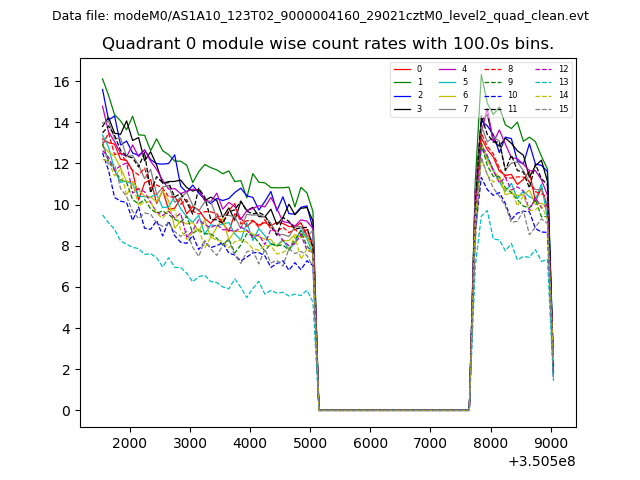
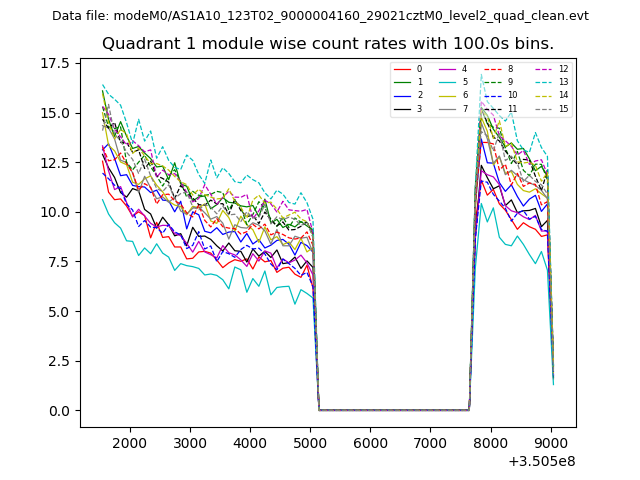
| Module-wise count rates for Quadrant A Data is divided into 100 sec bins |
 |
 |
| Module-wise count rates for Quadrant B Data is divided into 100 sec bins |
 |
 |
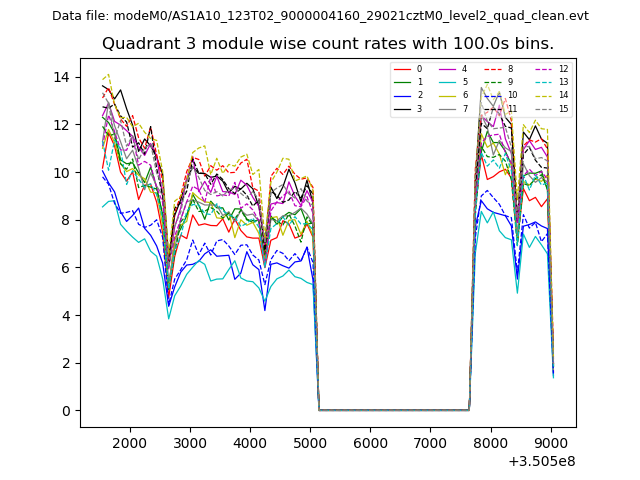
| Module-wise count rates for Quadrant C Data is divided into 100 sec bins |
 |
 |
| Module-wise count rates for Quadrant D Data is divided into 100 sec bins |
 |
 |
| Parameter | Plot |
|---|---|
| CZT HV Monitor |  |
| D_VDD | 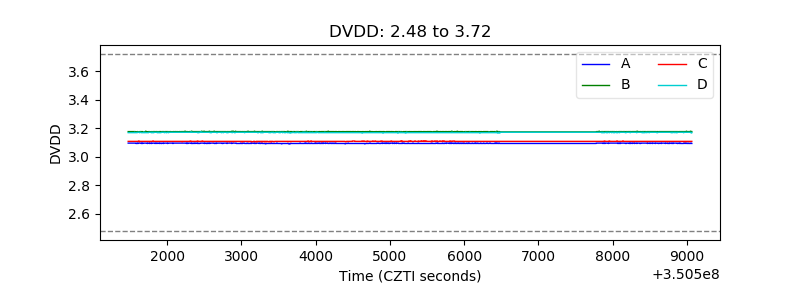 |
| Temperature 1 | 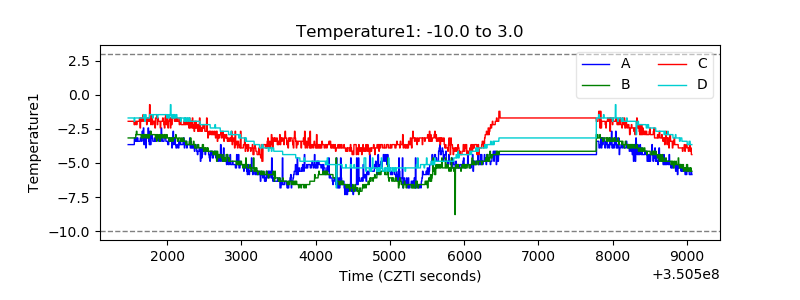 |
| Veto HV Monitor | 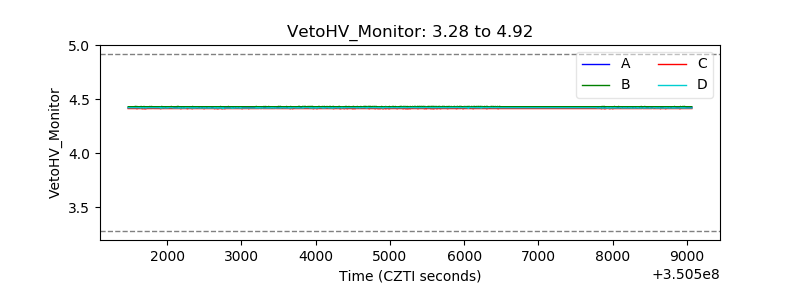 |
| Veto LLD | 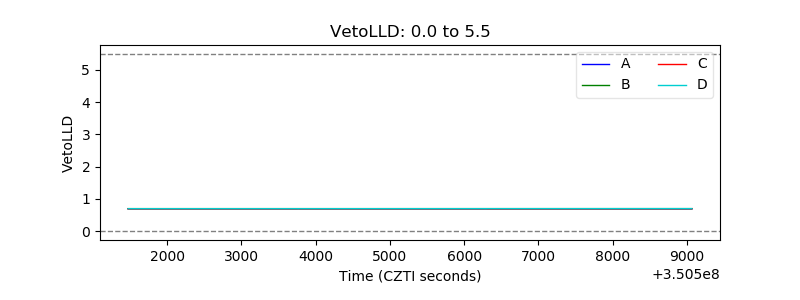 |
| Alpha Counter | 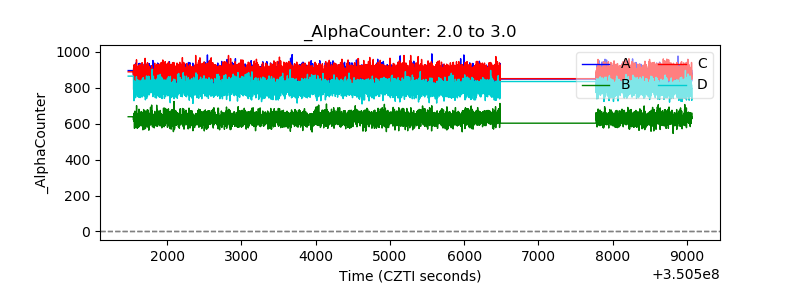 |
| _CPM_Rate | 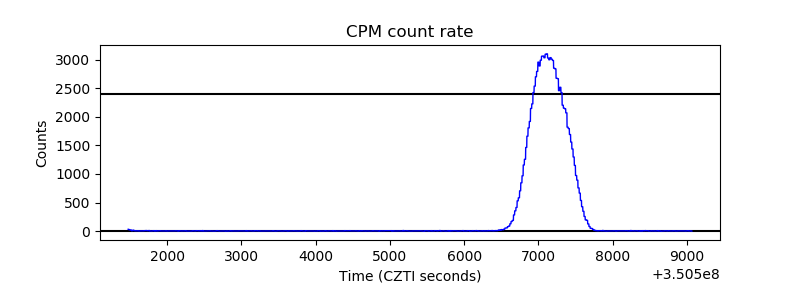 |
| CZT Counter | 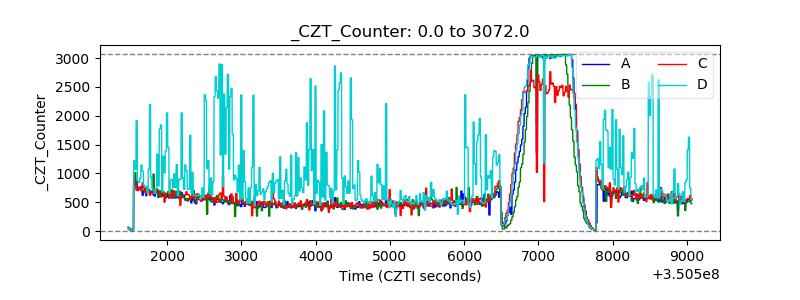 |
| +2.5 Volts monitor | 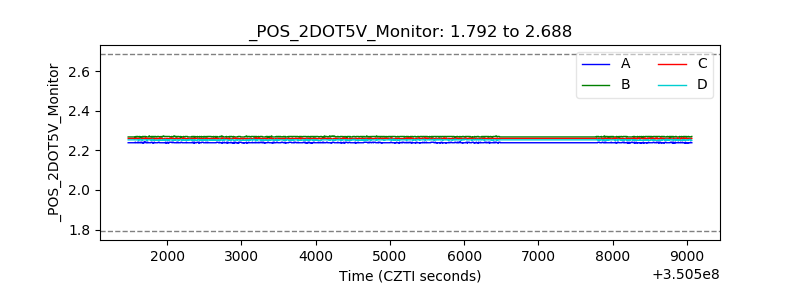 |
| +5 Volts monitor | 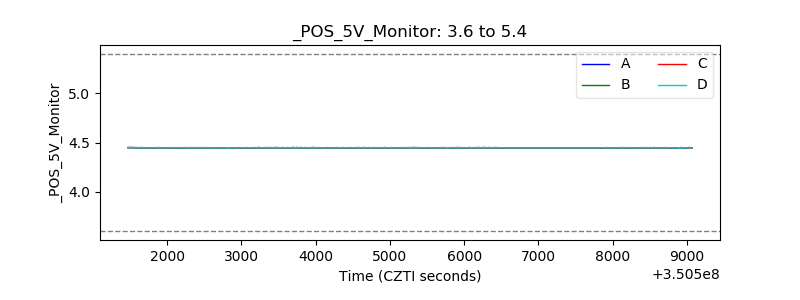 |
| _ROLL_ROT | 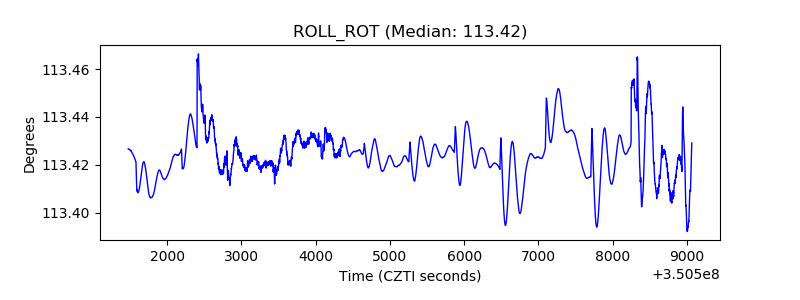 |
| _Roll_DEC | 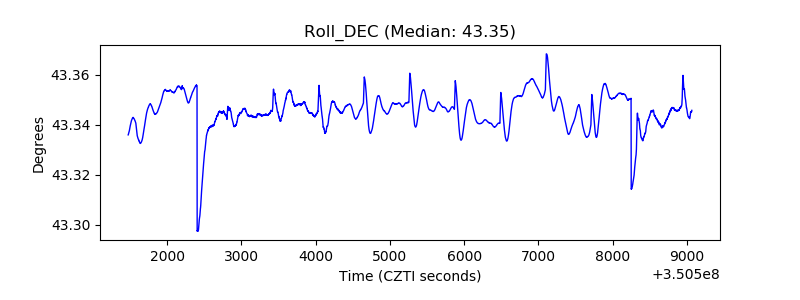 |
| _Roll_RA |  |
| Veto Counter | 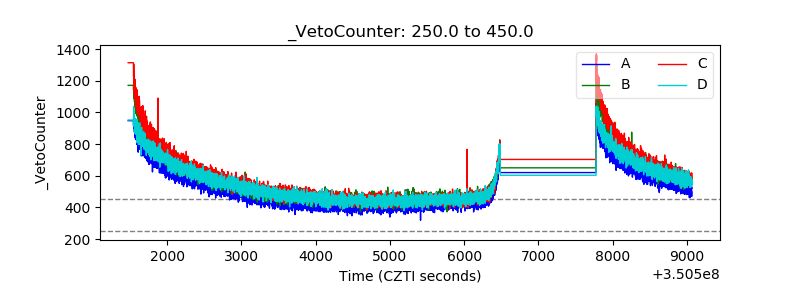 |