| Param | Original file | Final file |
|---|---|---|
| Filename | modeM0/AS1A10_123T02_9000004160_29022cztM0_level2.evt | modeM0/AS1A10_123T02_9000004160_29022cztM0_level2_quad_clean.evt |
| Size (bytes) | 489,332,160 | 110,736,000 |
| Size | 466.7 MB | 105.6 MB |
| Events in quadrant A | 3,232,983 | 734,045 |
| Events in quadrant B | 3,331,160 | 768,888 |
| Events in quadrant C | 3,416,093 | 731,942 |
| Events in quadrant D | 4,415,496 | 683,167 |
| Mode M9 | |||
|---|---|---|---|
| Quadrant | BADHDUFLAG | Total packets | Discarded packets |
| A | 0 | 13 | 0 |
| B | 0 | 13 | 0 |
| C | 0 | 13 | 0 |
| D | 0 | 13 | 0 |
| Mode SS | |||
|---|---|---|---|
| Quadrant | BADHDUFLAG | Total packets | Discarded packets |
| A | 0 | 128 | 0 |
| B | 0 | 128 | 0 |
| C | 0 | 128 | 0 |
| D | 0 | 128 | 0 |
| Mode M0 | |||
|---|---|---|---|
| Quadrant | BADHDUFLAG | Total packets | Discarded packets |
| A | 0 | 13556 | 2 |
| B | 0 | 13786 | 2 |
| C | 0 | 14143 | 2 |
| D | 0 | 17316 | 2 |
| Quadrant | Total seconds | Saturated seconds | Saturation percentage |
|---|---|---|---|
| A | 6239 | 54 | 0.865523% |
| B | 6239 | 74 | 1.186088% |
| C | 6239 | 124 | 1.987498% |
| D | 6240 | 265 | 4.246795% |
Noise dominated data is calculated using 1-second bins in cleaned event files. If a bin has >2000 counts, and if more than 50% of those come from <1% of pixels, then it is considered to be noise-dominated and hence unusable.
| Quadrant | # 1 sec bins | Bins with >0 counts | Bins with >2000 counts | High rate bins dominated by noise | Noise dominated (total time) | Noise dominated (detector-on time) | Marked lightcurve |
|---|---|---|---|---|---|---|---|
| A | 7574 | 6240 | 0 | 0 | 0.00% | 0.00% | 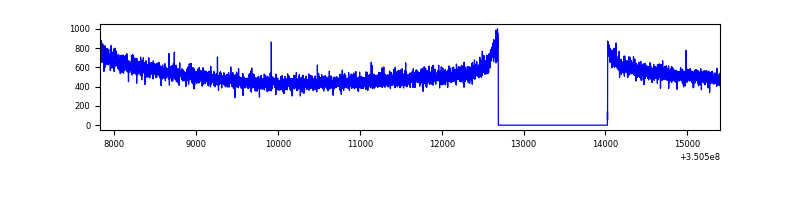 |
| B | 7574 | 6240 | 4 | 4 | 0.05% | 0.06% | 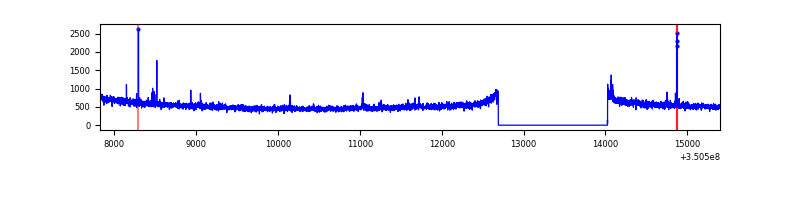 |
| C | 7574 | 6240 | 2 | 2 | 0.03% | 0.03% | 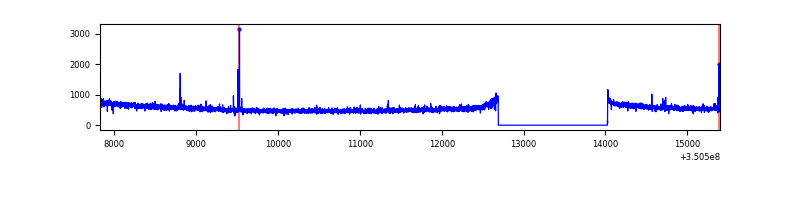 |
| D | 7575 | 6241 | 166 | 166 | 2.19% | 2.66% | 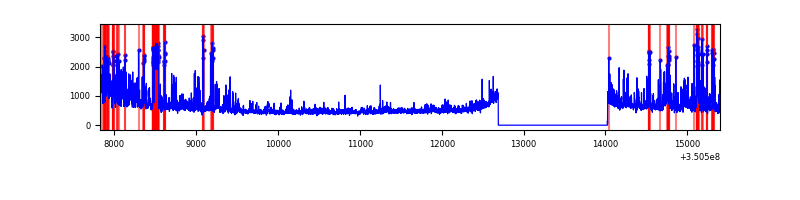 |
Top three noisy pixels from each quadrant. If the there are fewer than three noisy pixels in the level2.evt file, extra rows are filled as -1
| Pixel properties | Quadrant properties | ||||||
|---|---|---|---|---|---|---|---|
| Quadrant | DetID | PixID | Counts | Sigma | Mean | Median | Sigma |
| A | 13 | 254 | 11026 | 62.27 | 837 | 821 | 163.9 |
| A | 3 | 137 | 7732 | 42.17 | 837 | 821 | 163.9 |
| A | 0 | 226 | 7150 | 38.62 | 837 | 821 | 163.9 |
| B | 0 | 190 | 21246 | 131.24 | 839 | 819 | 155.6 |
| B | 12 | 111 | 18425 | 113.12 | 839 | 819 | 155.6 |
| B | 11 | 111 | 16762 | 102.43 | 839 | 819 | 155.6 |
| C | 14 | 238 | 134050 | 698.37 | 826 | 833 | 190.8 |
| C | 2 | 16 | 28868 | 146.97 | 826 | 833 | 190.8 |
| C | 3 | 233 | 20271 | 101.9 | 826 | 833 | 190.8 |
| D | 1 | 52 | 963191 | 5069.53 | 813 | 795 | 189.8 |
| D | 8 | 195 | 327258 | 1719.68 | 813 | 795 | 189.8 |
| D | 2 | 250 | 60428 | 314.12 | 813 | 795 | 189.8 |
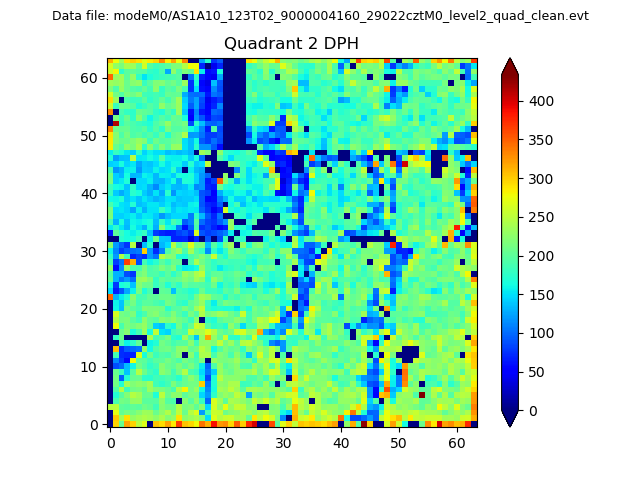
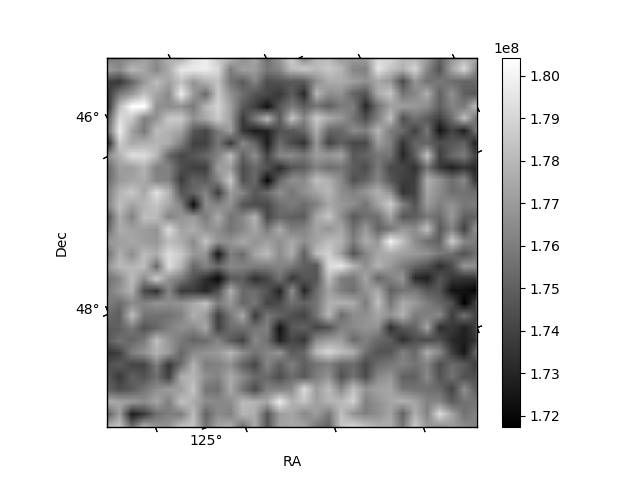
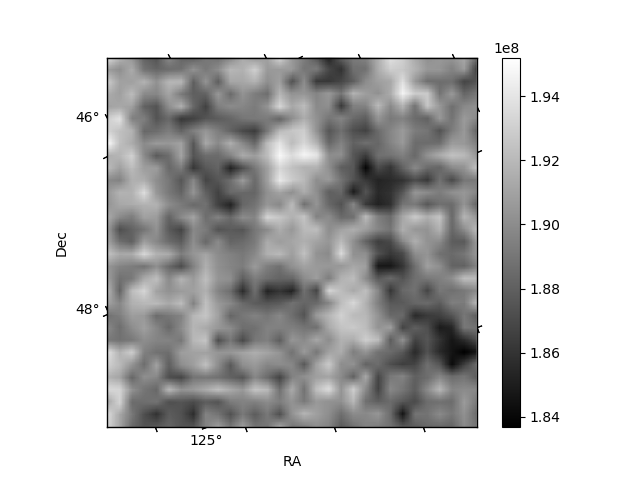
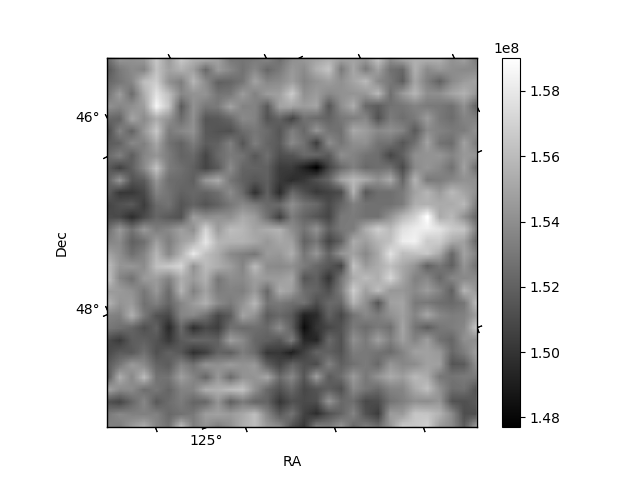
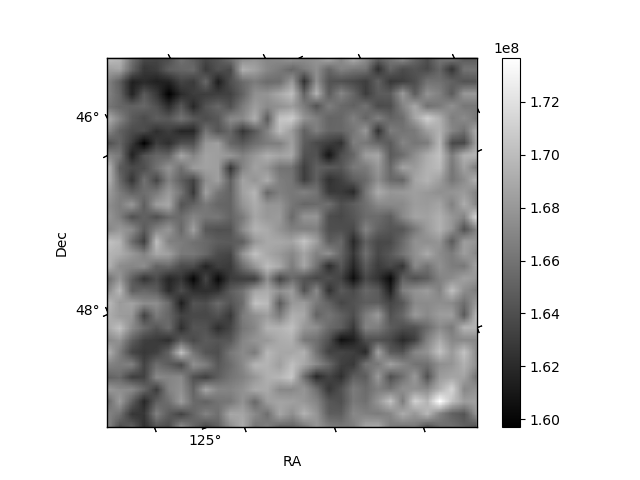
Histogram calculated using DETX and DETY for each event in the final _common_clean file
| Quadrant A | 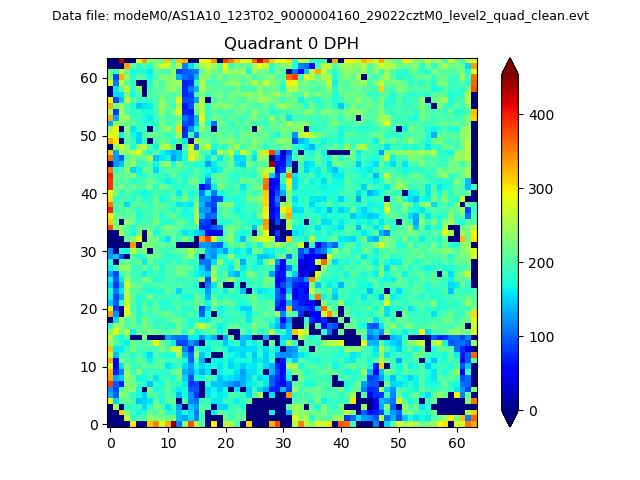 |
 |
Quadrant B |
|---|---|---|---|
| Quadrant D |  |
 |
Quadrant C |
| Plot type | Count rate plots | Images |
|---|---|---|
| Comparison with Poisson distribution Blue bars denote a histogram of data divided into 1 sec bins. Red curve is a Poisson curve with rate = median count rate of data. |
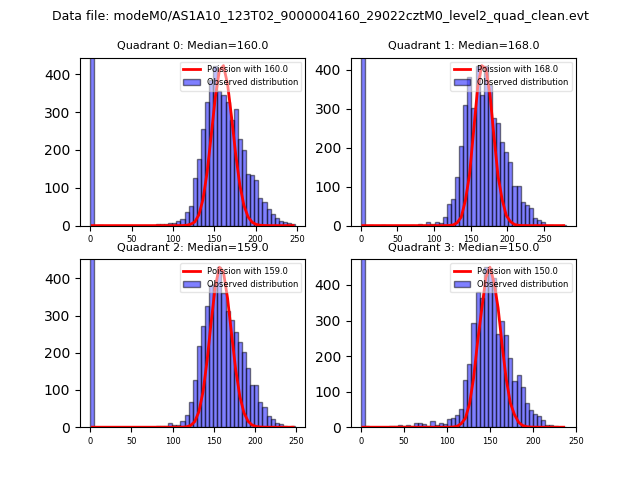 |
 |
| Quadrant-wise count rates Data is divided into 100 sec bins |
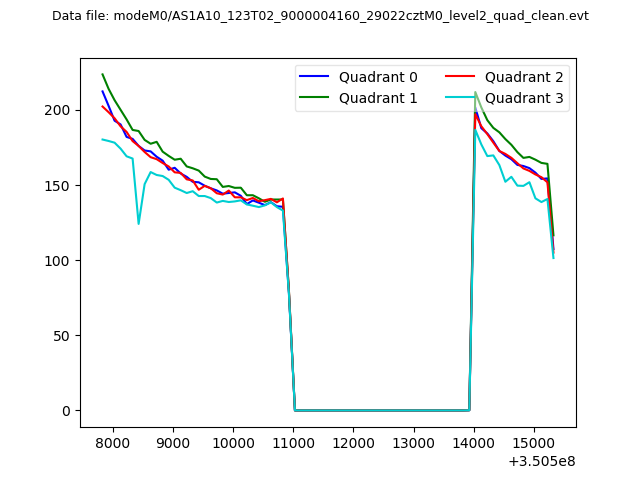 |
|
| Module-wise count rates for Quadrant A Data is divided into 100 sec bins |
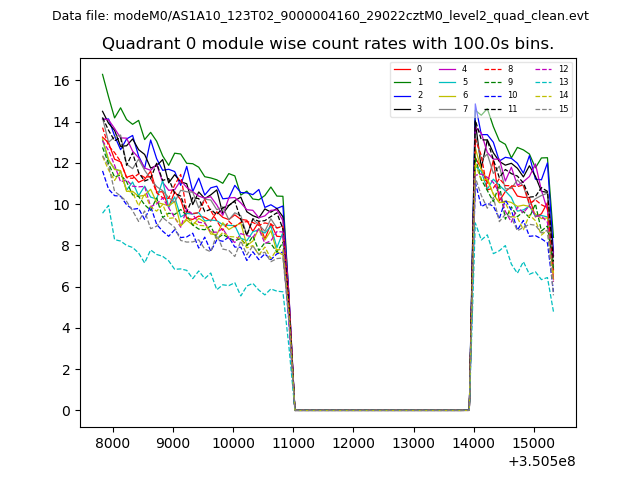 |
 |
| Module-wise count rates for Quadrant B Data is divided into 100 sec bins |
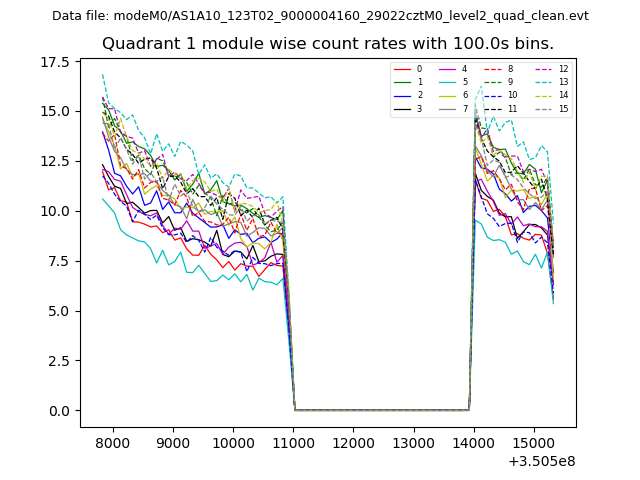 |
 |
| Module-wise count rates for Quadrant C Data is divided into 100 sec bins |
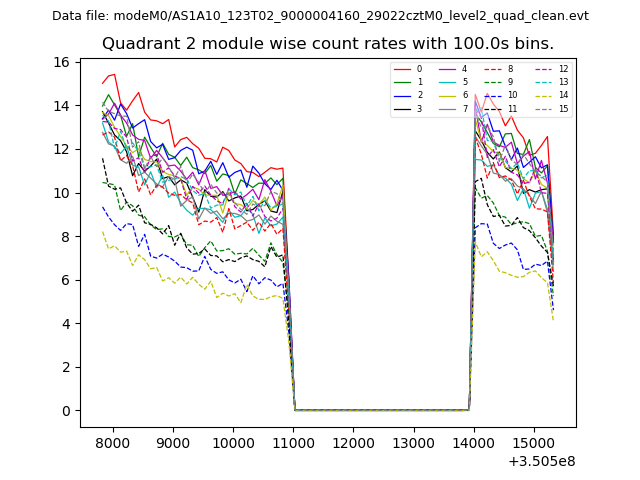 |
 |
| Module-wise count rates for Quadrant D Data is divided into 100 sec bins |
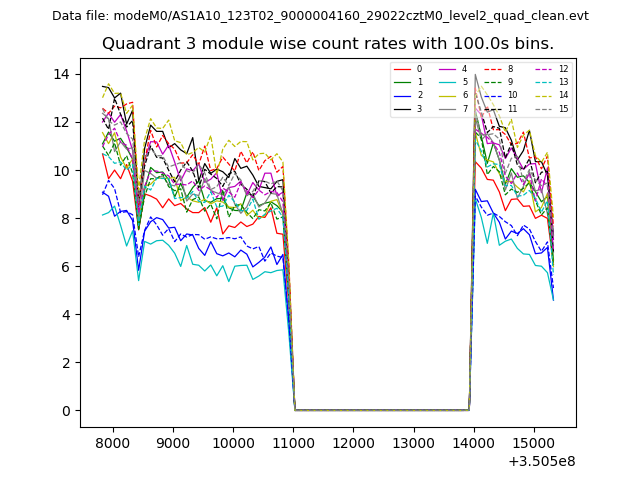 |
 |
| Parameter | Plot |
|---|---|
| CZT HV Monitor |  |
| D_VDD | 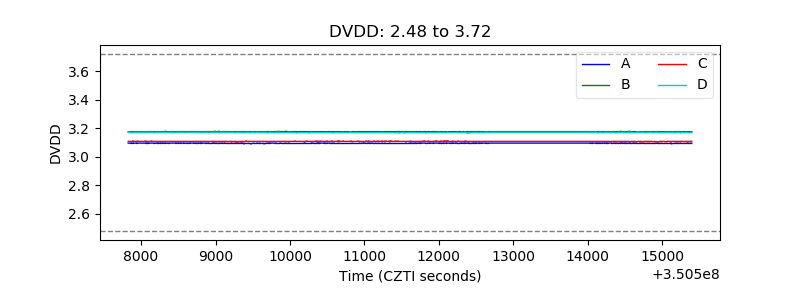 |
| Temperature 1 | 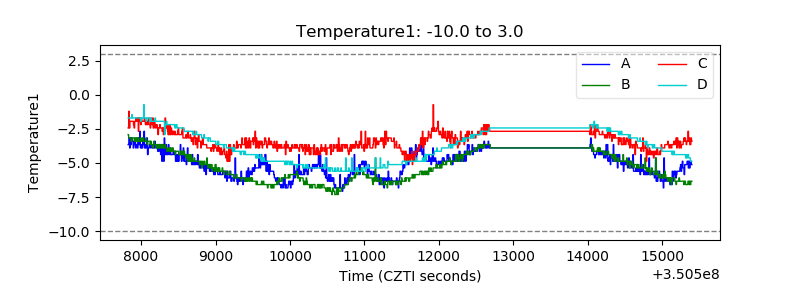 |
| Veto HV Monitor | 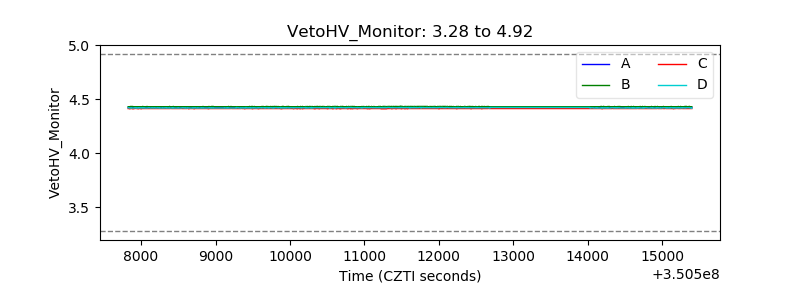 |
| Veto LLD | 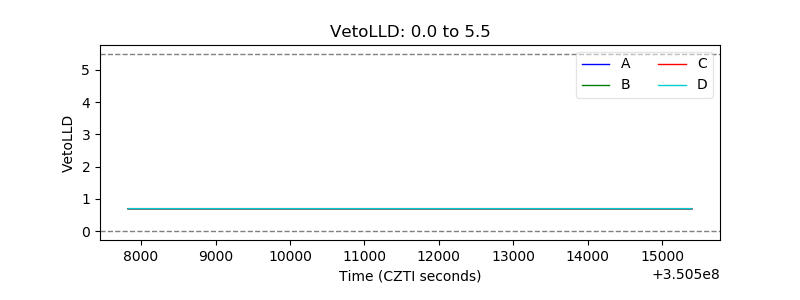 |
| Alpha Counter | 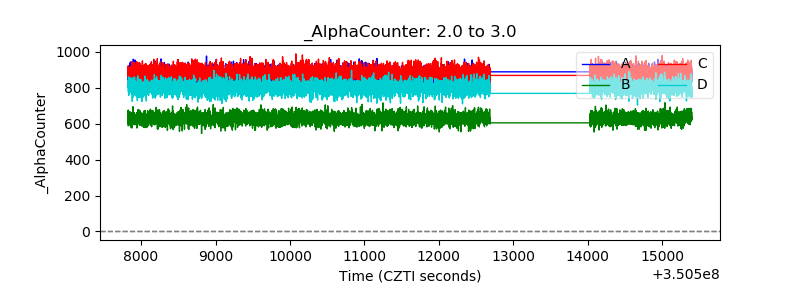 |
| _CPM_Rate | 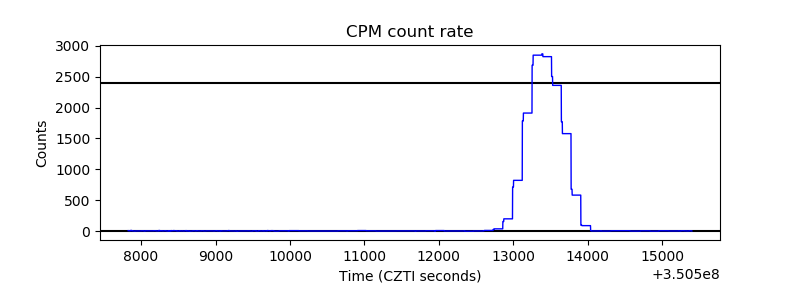 |
| CZT Counter | 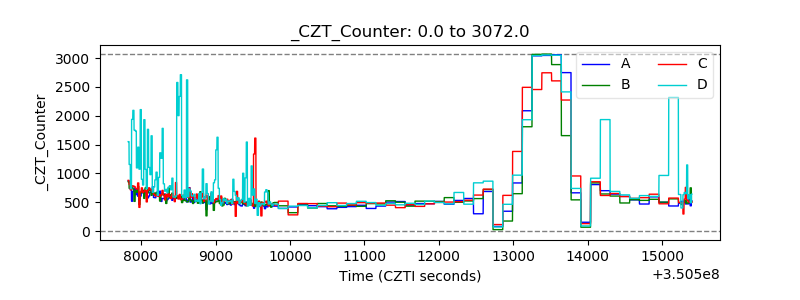 |
| +2.5 Volts monitor |  |
| +5 Volts monitor |  |
| _ROLL_ROT | 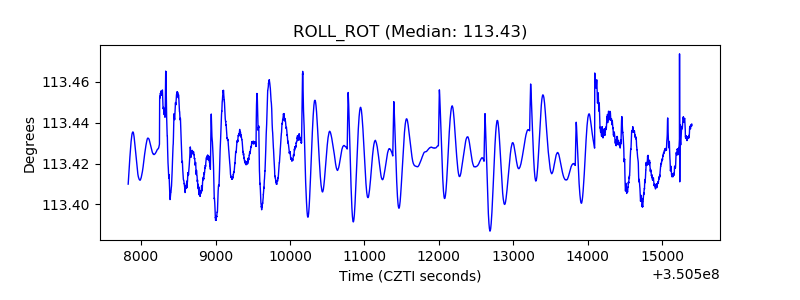 |
| _Roll_DEC |  |
| _Roll_RA | 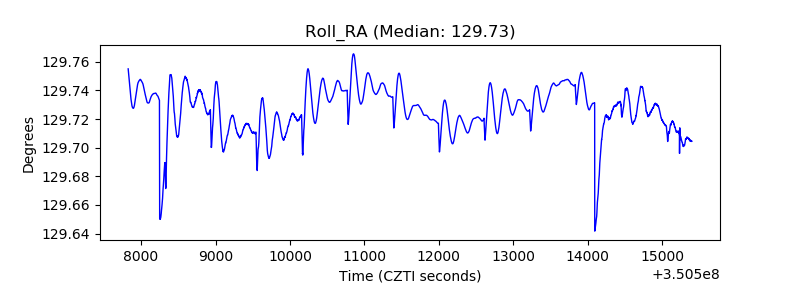 |
| Veto Counter | 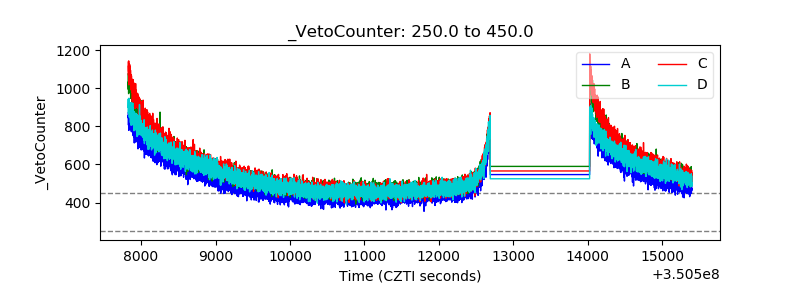 |