| Param | Original file | Final file |
|---|---|---|
| Filename | modeM0/AS1A10_123T02_9000004160_29023cztM0_level2.evt | modeM0/AS1A10_123T02_9000004160_29023cztM0_level2_quad_clean.evt |
| Size (bytes) | 548,556,480 | 97,761,600 |
| Size | 523.1 MB | 93.2 MB |
| Events in quadrant A | 3,113,326 | 642,832 |
| Events in quadrant B | 3,208,726 | 677,254 |
| Events in quadrant C | 3,372,759 | 640,613 |
| Events in quadrant D | 6,494,869 | 563,861 |
| Mode M9 | |||
|---|---|---|---|
| Quadrant | BADHDUFLAG | Total packets | Discarded packets |
| A | 0 | 21 | 0 |
| B | 0 | 22 | 0 |
| C | 0 | 22 | 0 |
| D | 0 | 22 | 0 |
| Mode SS | |||
|---|---|---|---|
| Quadrant | BADHDUFLAG | Total packets | Discarded packets |
| A | 0 | 128 | 0 |
| B | 0 | 128 | 0 |
| C | 0 | 128 | 0 |
| D | 0 | 128 | 0 |
| Mode M0 | |||
|---|---|---|---|
| Quadrant | BADHDUFLAG | Total packets | Discarded packets |
| A | 0 | 13176 | 2 |
| B | 0 | 13377 | 2 |
| C | 0 | 13890 | 2 |
| D | 0 | 23615 | 2 |
| Quadrant | Total seconds | Saturated seconds | Saturation percentage |
|---|---|---|---|
| A | 6241 | 20 | 0.320461% |
| B | 6241 | 45 | 0.721038% |
| C | 6241 | 88 | 1.410030% |
| D | 6241 | 983 | 15.750681% |
Noise dominated data is calculated using 1-second bins in cleaned event files. If a bin has >2000 counts, and if more than 50% of those come from <1% of pixels, then it is considered to be noise-dominated and hence unusable.
| Quadrant | # 1 sec bins | Bins with >0 counts | Bins with >2000 counts | High rate bins dominated by noise | Noise dominated (total time) | Noise dominated (detector-on time) | Marked lightcurve |
|---|---|---|---|---|---|---|---|
| A | 7591 | 6242 | 0 | 0 | 0.00% | 0.00% | 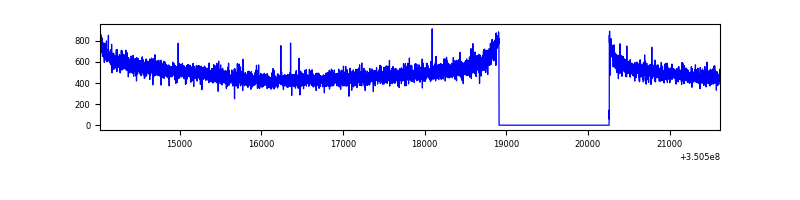 |
| B | 7591 | 6242 | 3 | 3 | 0.04% | 0.05% | 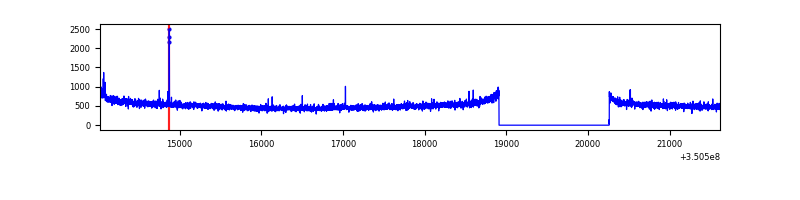 |
| C | 7591 | 6242 | 6 | 6 | 0.08% | 0.10% | 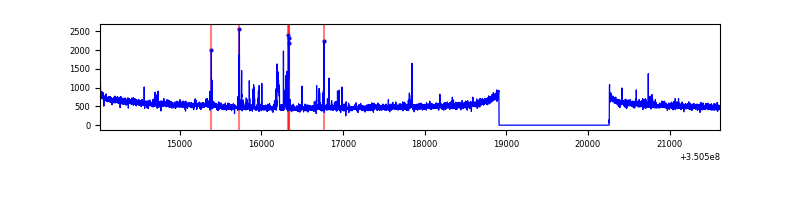 |
| D | 7591 | 6242 | 899 | 899 | 11.84% | 14.40% | 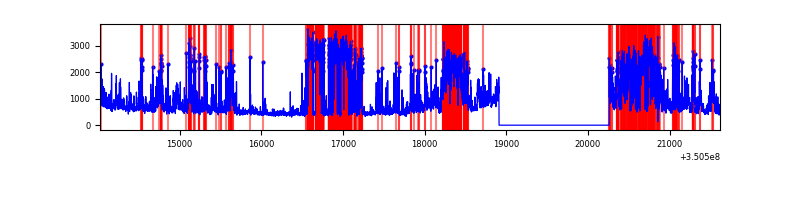 |
Top three noisy pixels from each quadrant. If the there are fewer than three noisy pixels in the level2.evt file, extra rows are filled as -1
| Pixel properties | Quadrant properties | ||||||
|---|---|---|---|---|---|---|---|
| Quadrant | DetID | PixID | Counts | Sigma | Mean | Median | Sigma |
| A | 13 | 254 | 10314 | 59.66 | 807 | 790 | 159.6 |
| A | 3 | 137 | 7487 | 41.95 | 807 | 790 | 159.6 |
| A | 0 | 226 | 6832 | 37.85 | 807 | 790 | 159.6 |
| B | 12 | 111 | 18284 | 115.36 | 813 | 794 | 151.6 |
| B | 11 | 111 | 16871 | 106.04 | 813 | 794 | 151.6 |
| B | 14 | 111 | 15513 | 97.09 | 813 | 794 | 151.6 |
| C | 14 | 238 | 129602 | 701.4 | 794 | 800 | 183.6 |
| C | 2 | 16 | 121488 | 657.21 | 794 | 800 | 183.6 |
| C | 3 | 233 | 14902 | 76.79 | 794 | 800 | 183.6 |
| D | 1 | 52 | 2552629 | 14750.47 | 735 | 718 | 173.0 |
| D | 7 | 80 | 899226 | 5193.52 | 735 | 718 | 173.0 |
| D | 8 | 195 | 256813 | 1480.27 | 735 | 718 | 173.0 |
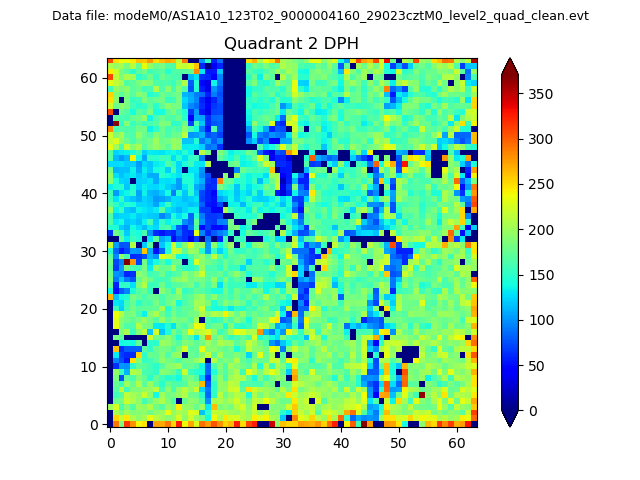
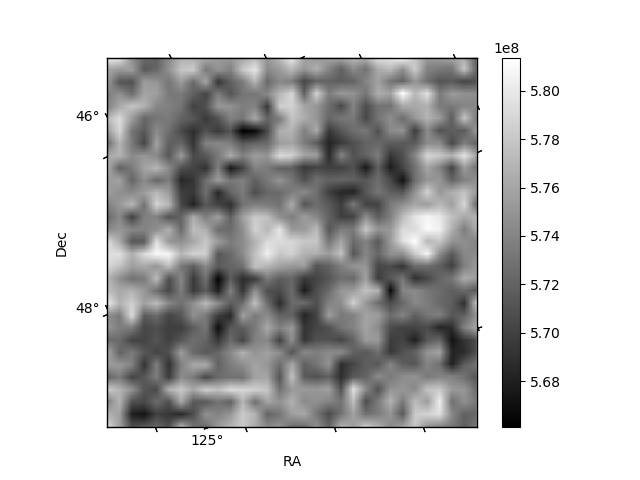
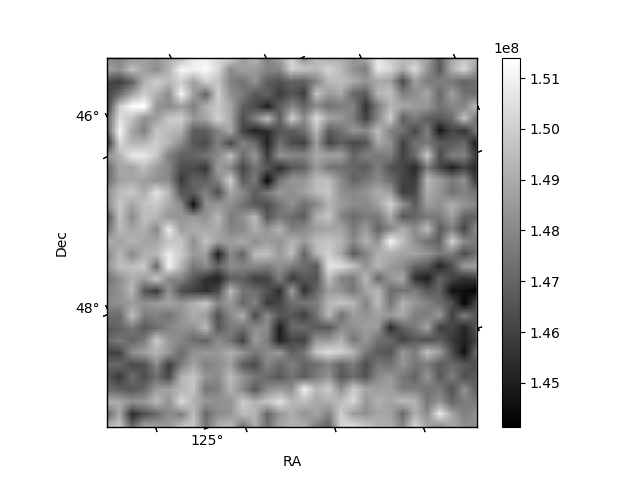
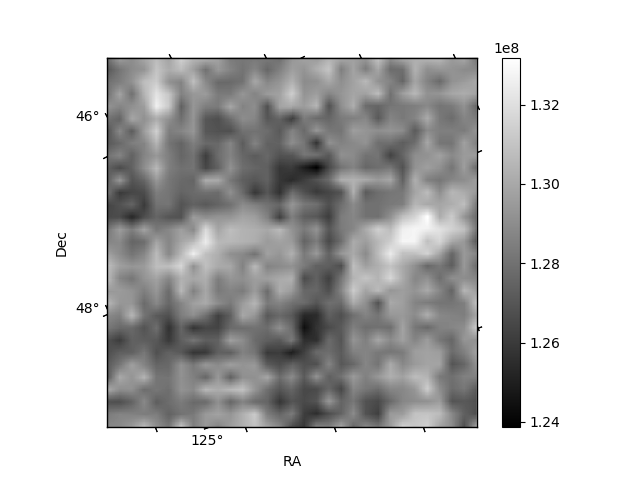
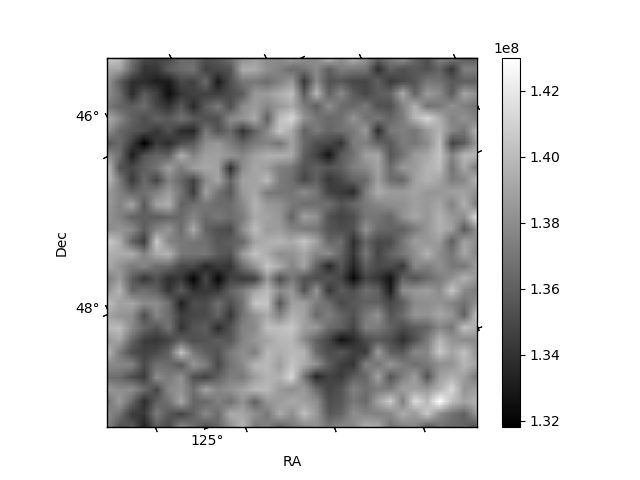
Histogram calculated using DETX and DETY for each event in the final _common_clean file
| Quadrant A | 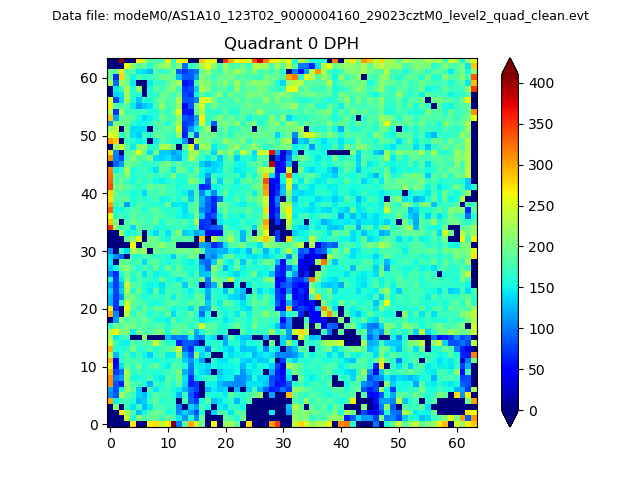 |
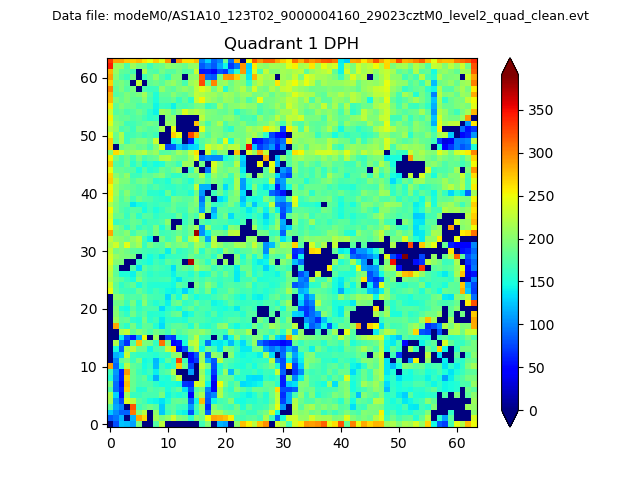 |
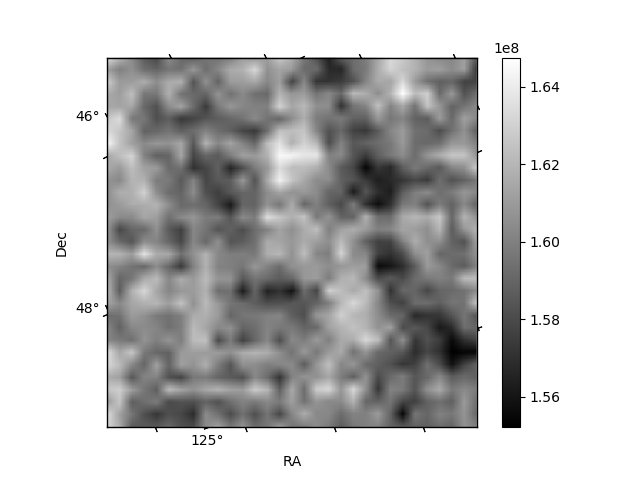
Quadrant B |
|---|---|---|---|
| Quadrant D | 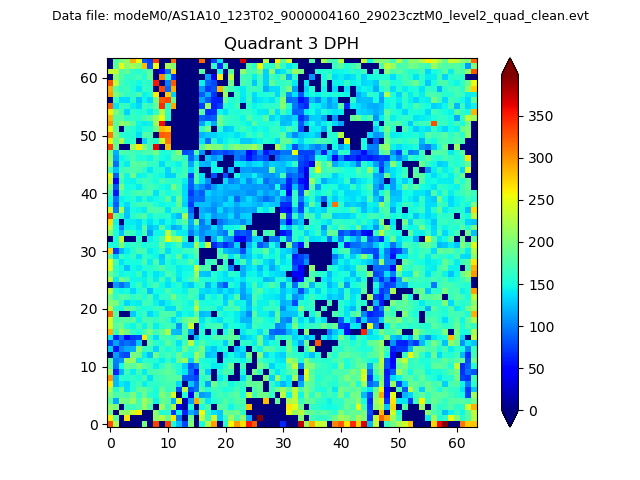 |
 |
Quadrant C |
| Plot type | Count rate plots | Images |
|---|---|---|
| Comparison with Poisson distribution Blue bars denote a histogram of data divided into 1 sec bins. Red curve is a Poisson curve with rate = median count rate of data. |
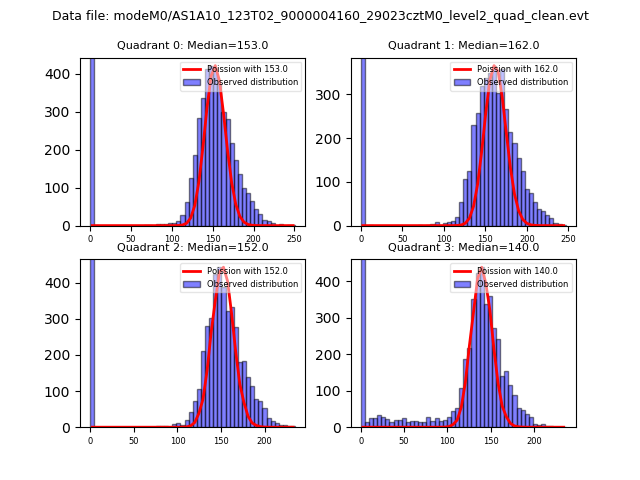 |
 |
| Quadrant-wise count rates Data is divided into 100 sec bins |
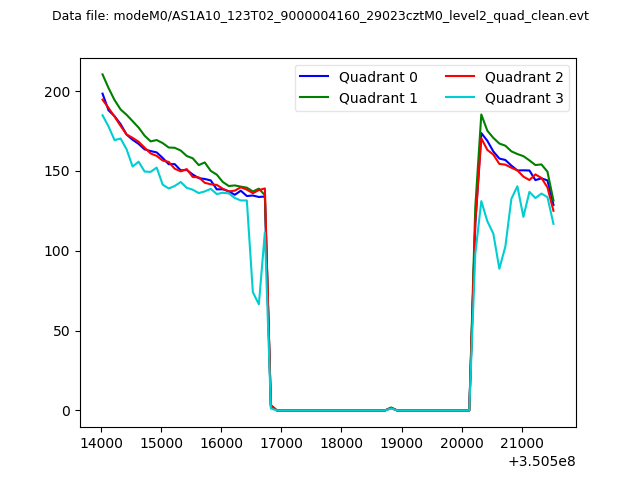 |
|
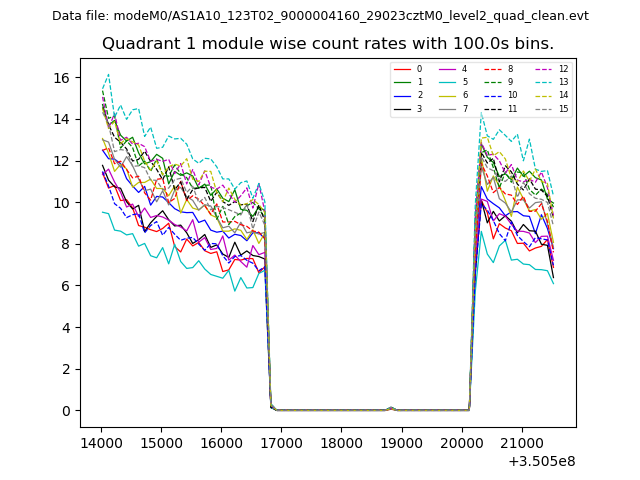
| Module-wise count rates for Quadrant A Data is divided into 100 sec bins |
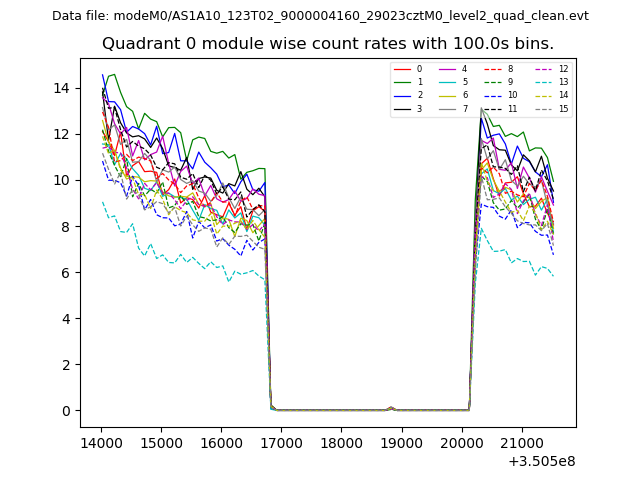 |
 |
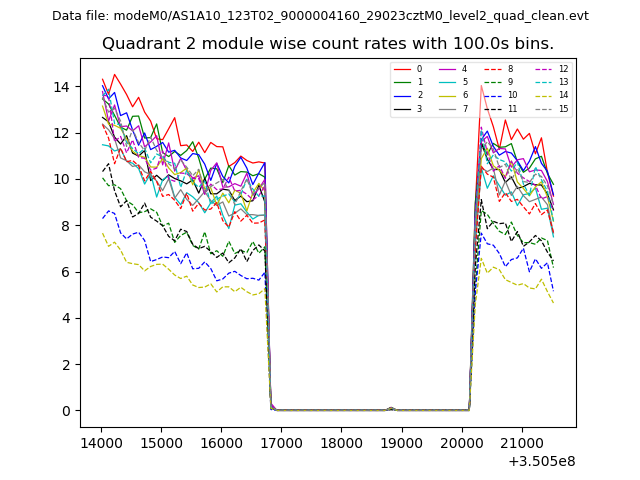
| Module-wise count rates for Quadrant B Data is divided into 100 sec bins |
 |
 |
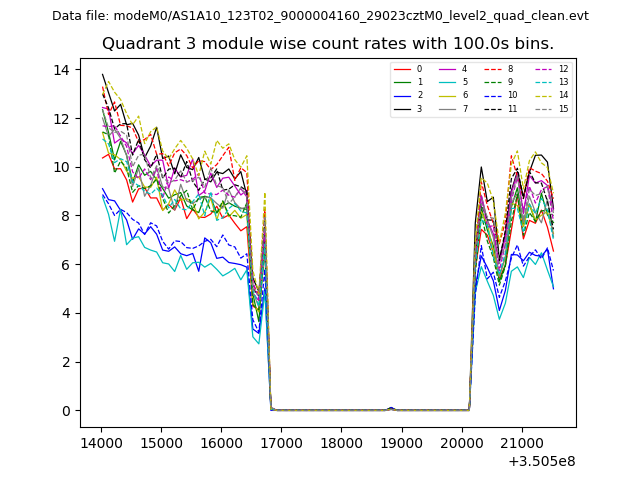
| Module-wise count rates for Quadrant C Data is divided into 100 sec bins |
 |
 |
| Module-wise count rates for Quadrant D Data is divided into 100 sec bins |
 |
 |
| Parameter | Plot |
|---|---|
| CZT HV Monitor | 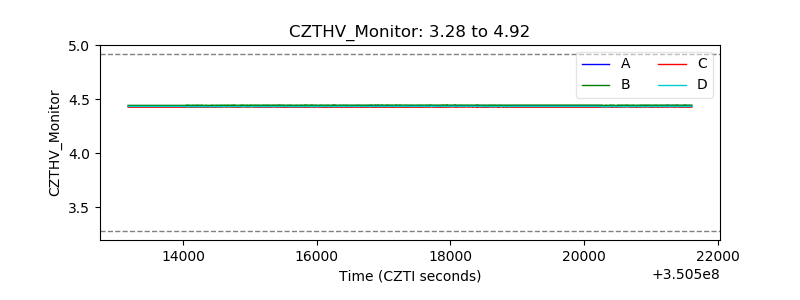 |
| D_VDD | 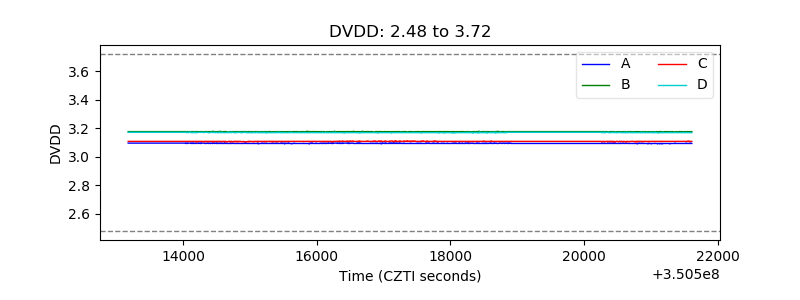 |
| Temperature 1 | 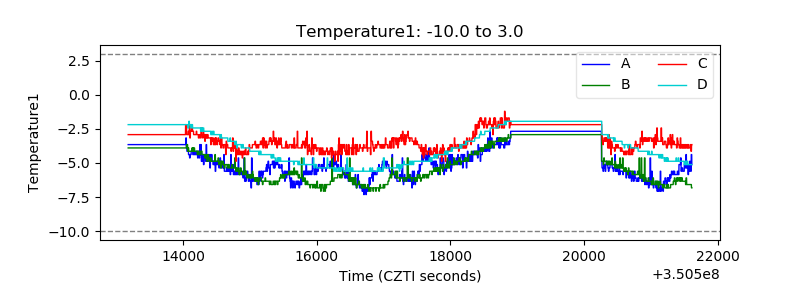 |
| Veto HV Monitor | 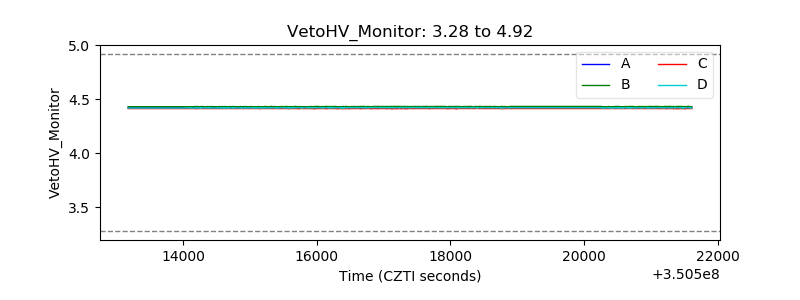 |
| Veto LLD |  |
| Alpha Counter | 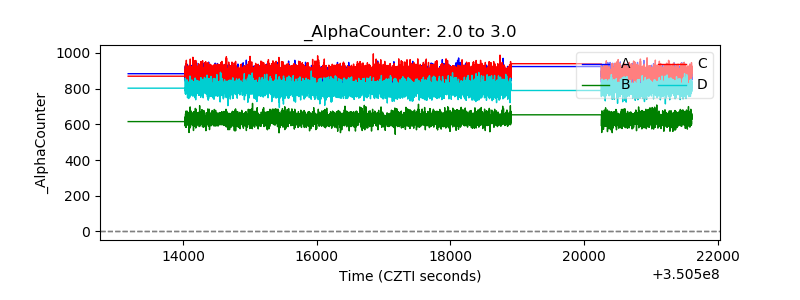 |
| _CPM_Rate | 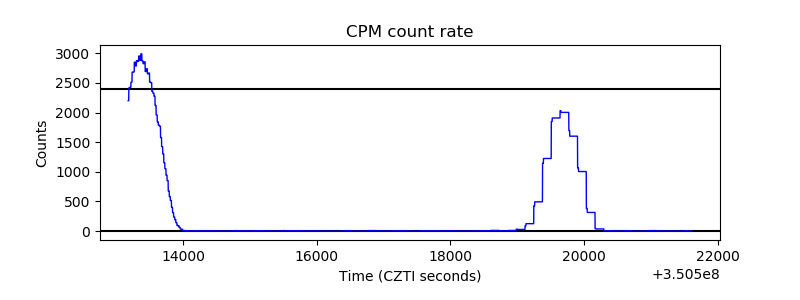 |
| CZT Counter | 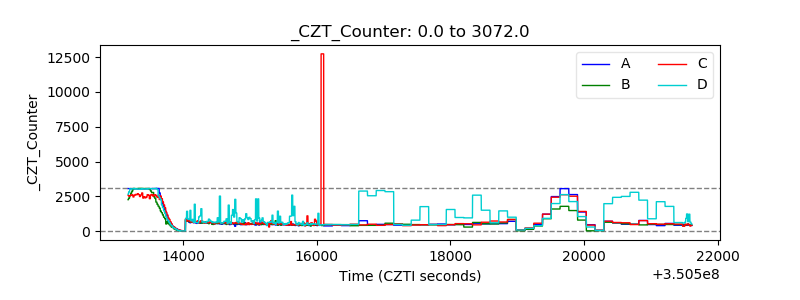 |
| +2.5 Volts monitor |  |
| +5 Volts monitor |  |
| _ROLL_ROT | 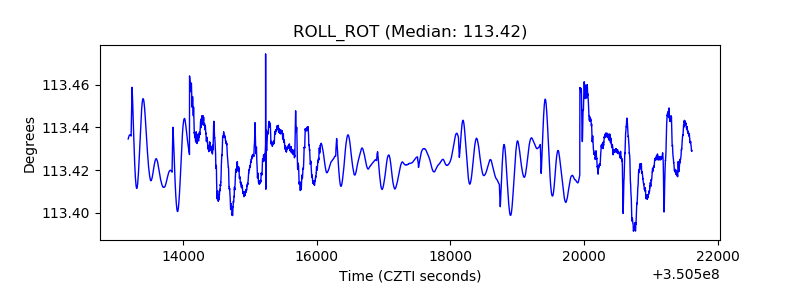 |
| _Roll_DEC | 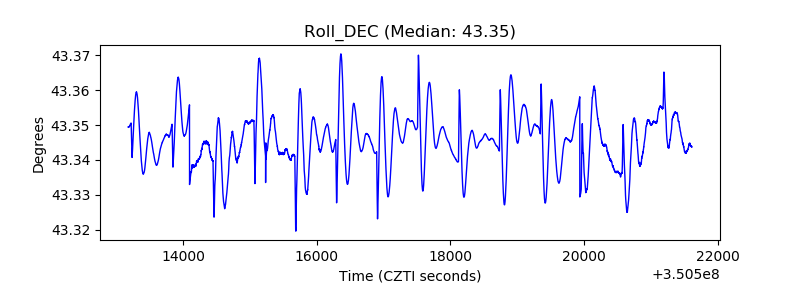 |
| _Roll_RA | 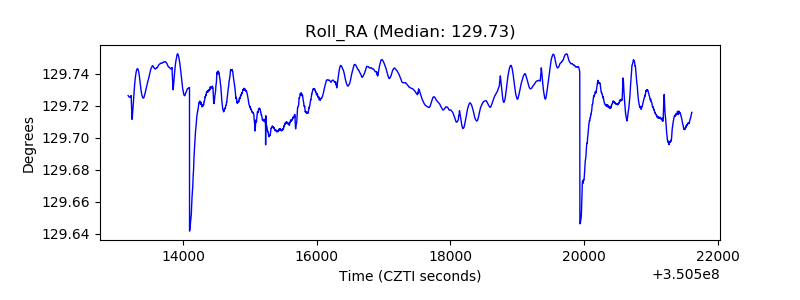 |
| Veto Counter | 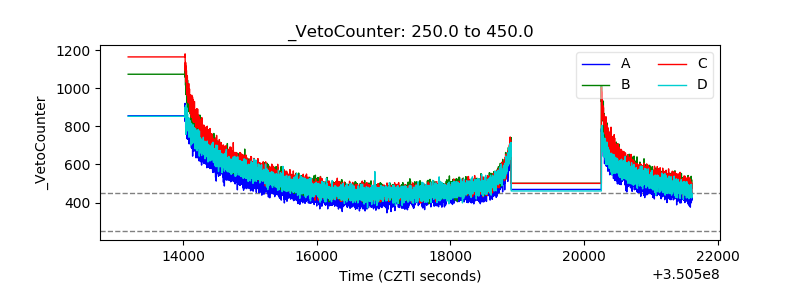 |