| Param | Original file | Final file |
|---|---|---|
| Filename | modeM0/AS1A10_123T02_9000004160_29024cztM0_level2.evt | modeM0/AS1A10_123T02_9000004160_29024cztM0_level2_quad_clean.evt |
| Size (bytes) | 477,884,160 | 93,551,040 |
| Size | 455.7 MB | 89.2 MB |
| Events in quadrant A | 3,022,493 | 609,954 |
| Events in quadrant B | 3,101,037 | 637,119 |
| Events in quadrant C | 3,117,996 | 598,629 |
| Events in quadrant D | 4,803,040 | 547,049 |
| Mode M9 | |||
|---|---|---|---|
| Quadrant | BADHDUFLAG | Total packets | Discarded packets |
| A | 0 | 21 | 0 |
| B | 0 | 22 | 0 |
| C | 0 | 22 | 0 |
| D | 0 | 22 | 0 |
| Mode SS | |||
|---|---|---|---|
| Quadrant | BADHDUFLAG | Total packets | Discarded packets |
| A | 0 | 128 | 0 |
| B | 0 | 128 | 0 |
| C | 0 | 128 | 0 |
| D | 0 | 128 | 0 |
| Mode M0 | |||
|---|---|---|---|
| Quadrant | BADHDUFLAG | Total packets | Discarded packets |
| A | 0 | 13085 | 2 |
| B | 0 | 13178 | 2 |
| C | 0 | 13231 | 2 |
| D | 0 | 18518 | 2 |
| Quadrant | Total seconds | Saturated seconds | Saturation percentage |
|---|---|---|---|
| A | 6307 | 15 | 0.237831% |
| B | 6307 | 19 | 0.301253% |
| C | 6307 | 46 | 0.729348% |
| D | 6307 | 381 | 6.040907% |
Noise dominated data is calculated using 1-second bins in cleaned event files. If a bin has >2000 counts, and if more than 50% of those come from <1% of pixels, then it is considered to be noise-dominated and hence unusable.
| Quadrant | # 1 sec bins | Bins with >0 counts | Bins with >2000 counts | High rate bins dominated by noise | Noise dominated (total time) | Noise dominated (detector-on time) | Marked lightcurve |
|---|---|---|---|---|---|---|---|
| A | 7537 | 6308 | 0 | 0 | 0.00% | 0.00% |  |
| B | 7537 | 6308 | 0 | 0 | 0.00% | 0.00% |  |
| C | 7537 | 6308 | 0 | 0 | 0.00% | 0.00% |  |
| D | 7537 | 6308 | 320 | 320 | 4.25% | 5.07% |  |
Top three noisy pixels from each quadrant. If the there are fewer than three noisy pixels in the level2.evt file, extra rows are filled as -1
| Pixel properties | Quadrant properties | ||||||
|---|---|---|---|---|---|---|---|
| Quadrant | DetID | PixID | Counts | Sigma | Mean | Median | Sigma |
| A | 13 | 254 | 10495 | 63.03 | 781 | 768 | 154.3 |
| A | 15 | 174 | 8766 | 51.83 | 781 | 768 | 154.3 |
| A | 3 | 137 | 7478 | 43.48 | 781 | 768 | 154.3 |
| B | 12 | 111 | 17806 | 115.88 | 785 | 767 | 147.0 |
| B | 11 | 111 | 16515 | 107.1 | 785 | 767 | 147.0 |
| B | 14 | 111 | 15783 | 102.12 | 785 | 767 | 147.0 |
| C | 14 | 238 | 123976 | 693.33 | 760 | 765 | 177.7 |
| C | 2 | 114 | 14719 | 78.52 | 760 | 765 | 177.7 |
| C | 2 | 16 | 9766 | 50.65 | 760 | 765 | 177.7 |
| D | 1 | 52 | 1104822 | 6360.97 | 734 | 714 | 173.6 |
| D | 7 | 80 | 698264 | 4018.72 | 734 | 714 | 173.6 |
| D | 8 | 195 | 224005 | 1286.42 | 734 | 714 | 173.6 |
Histogram calculated using DETX and DETY for each event in the final _common_clean file
| Quadrant A |  |
 |
Quadrant B |
|---|---|---|---|
| Quadrant D |  |
 |
Quadrant C |
| Plot type | Count rate plots | Images |
|---|---|---|
| Comparison with Poisson distribution Blue bars denote a histogram of data divided into 1 sec bins. Red curve is a Poisson curve with rate = median count rate of data. |
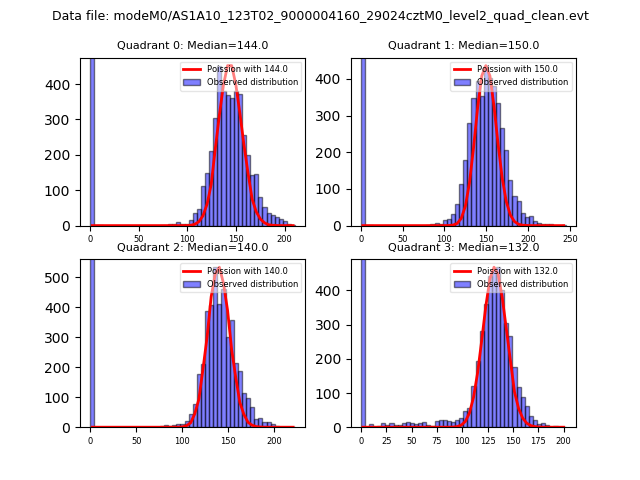 |
 |
| Quadrant-wise count rates Data is divided into 100 sec bins |
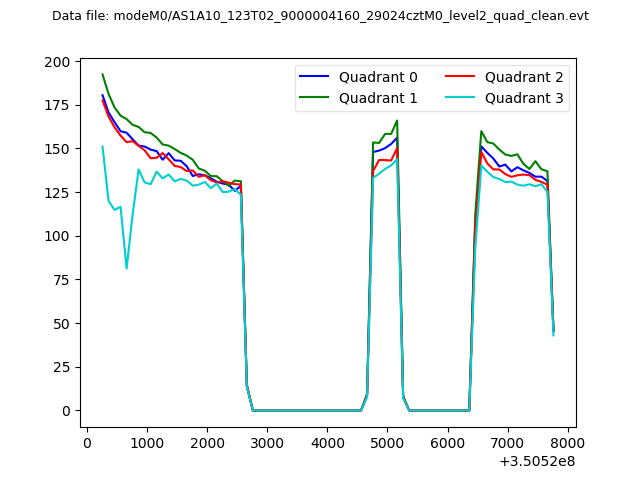 |
|
| Module-wise count rates for Quadrant A Data is divided into 100 sec bins |
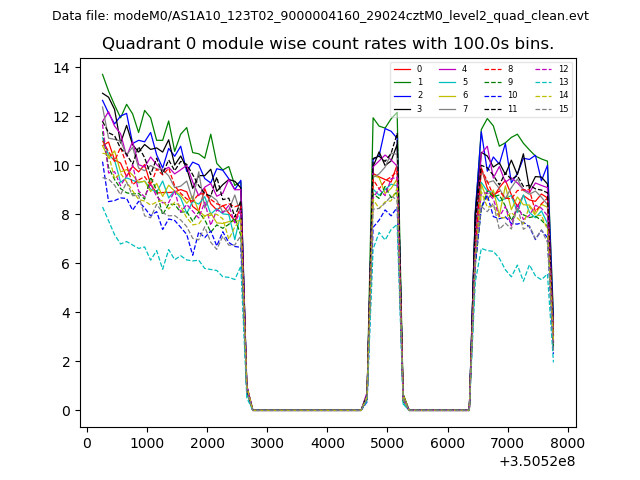 |
 |
| Module-wise count rates for Quadrant B Data is divided into 100 sec bins |
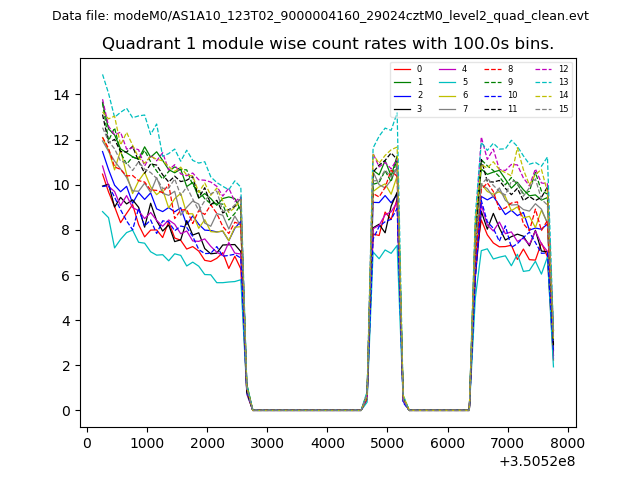 |
 |
| Module-wise count rates for Quadrant C Data is divided into 100 sec bins |
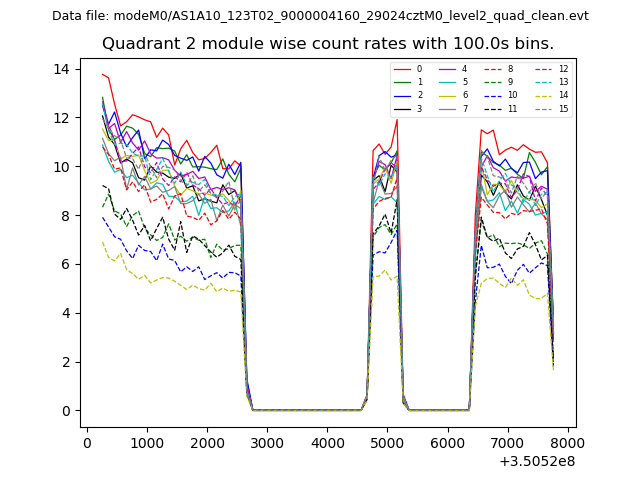 |
 |
| Module-wise count rates for Quadrant D Data is divided into 100 sec bins |
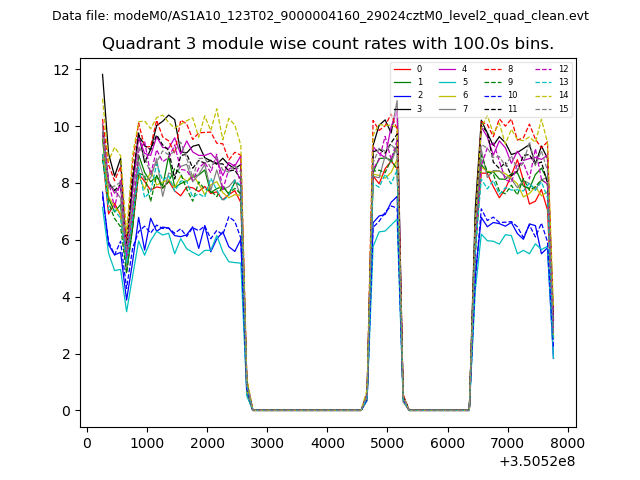 |
 |
| Parameter | Plot |
|---|---|
| CZT HV Monitor | 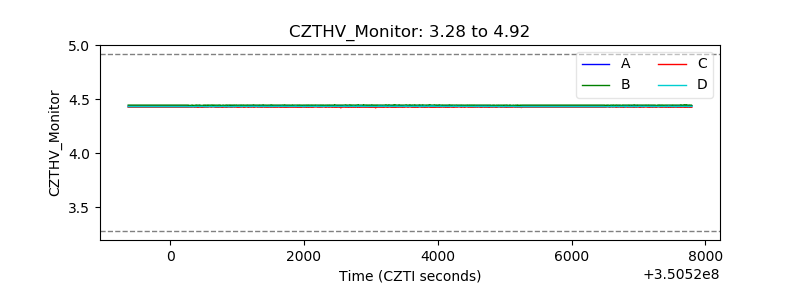 |
| D_VDD |  |
| Temperature 1 |  |
| Veto HV Monitor |  |
| Veto LLD |  |
| Alpha Counter | 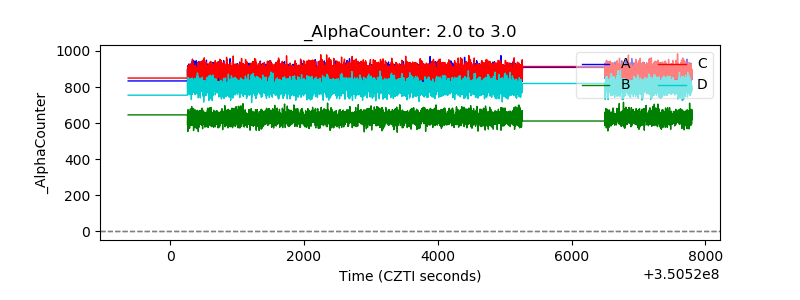 |
| _CPM_Rate | 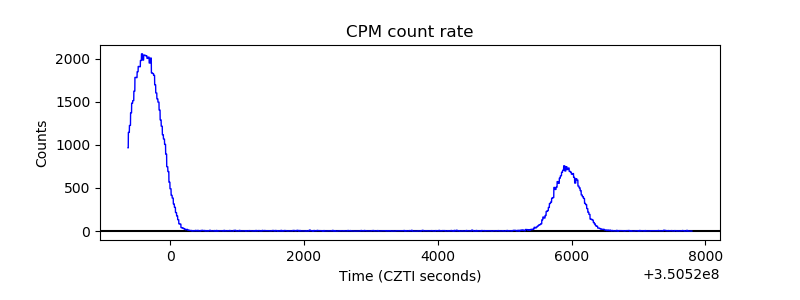 |
| CZT Counter |  |
| +2.5 Volts monitor |  |
| +5 Volts monitor |  |
| _ROLL_ROT | 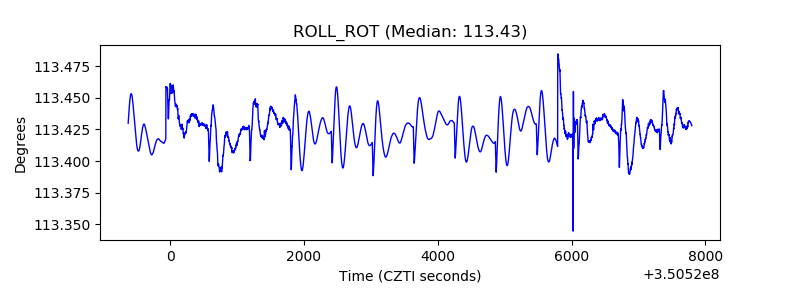 |
| _Roll_DEC | 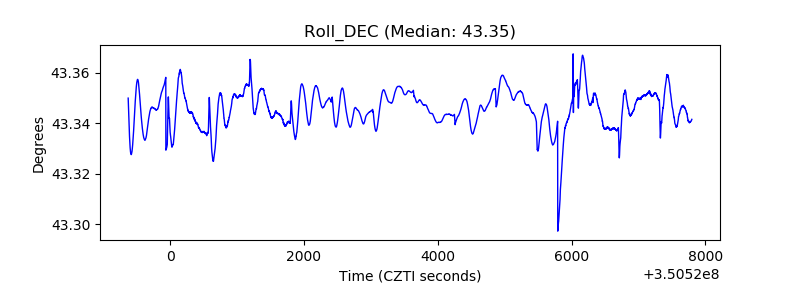 |
| _Roll_RA |  |
| Veto Counter | 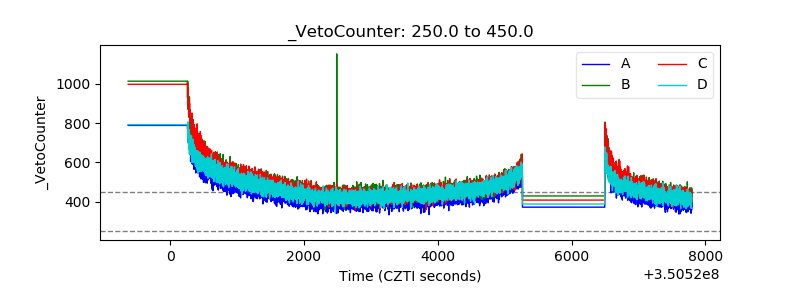 |