| Param | Original file | Final file |
|---|---|---|
| Filename | modeM0/AS1A10_123T02_9000004160_29025cztM0_level2.evt | modeM0/AS1A10_123T02_9000004160_29025cztM0_level2_quad_clean.evt |
| Size (bytes) | 464,595,840 | 101,168,640 |
| Size | 443.1 MB | 96.5 MB |
| Events in quadrant A | 3,219,428 | 651,808 |
| Events in quadrant B | 3,291,296 | 676,781 |
| Events in quadrant C | 3,307,130 | 638,623 |
| Events in quadrant D | 3,783,621 | 616,052 |
| Mode M9 | |||
|---|---|---|---|
| Quadrant | BADHDUFLAG | Total packets | Discarded packets |
| A | 0 | 20 | 0 |
| B | 0 | 20 | 0 |
| C | 0 | 20 | 0 |
| D | 0 | 20 | 0 |
| Mode SS | |||
|---|---|---|---|
| Quadrant | BADHDUFLAG | Total packets | Discarded packets |
| A | 0 | 142 | 0 |
| B | 0 | 142 | 0 |
| C | 0 | 142 | 0 |
| D | 0 | 142 | 0 |
| Mode M0 | |||
|---|---|---|---|
| Quadrant | BADHDUFLAG | Total packets | Discarded packets |
| A | 0 | 14146 | 2 |
| B | 0 | 14239 | 2 |
| C | 0 | 14255 | 2 |
| D | 0 | 16016 | 2 |
| Quadrant | Total seconds | Saturated seconds | Saturation percentage |
|---|---|---|---|
| A | 6900 | 31 | 0.449275% |
| B | 6900 | 44 | 0.637681% |
| C | 6901 | 85 | 1.231706% |
| D | 6901 | 81 | 1.173743% |
Noise dominated data is calculated using 1-second bins in cleaned event files. If a bin has >2000 counts, and if more than 50% of those come from <1% of pixels, then it is considered to be noise-dominated and hence unusable.
| Quadrant | # 1 sec bins | Bins with >0 counts | Bins with >2000 counts | High rate bins dominated by noise | Noise dominated (total time) | Noise dominated (detector-on time) | Marked lightcurve |
|---|---|---|---|---|---|---|---|
| A | 8900 | 6902 | 0 | 0 | 0.00% | 0.00% | 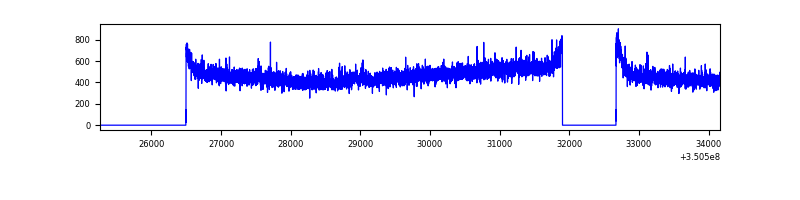 |
| B | 8900 | 6902 | 0 | 0 | 0.00% | 0.00% | 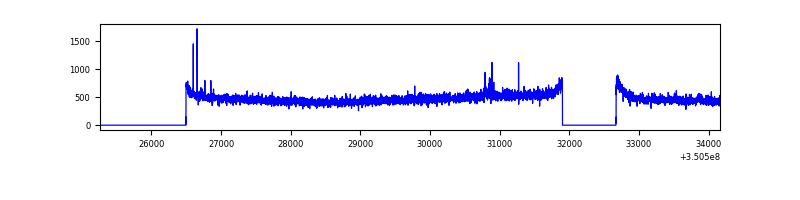 |
| C | 8901 | 6903 | 0 | 0 | 0.00% | 0.00% | 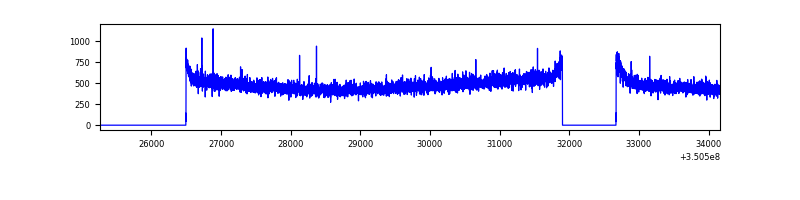 |
| D | 8901 | 6903 | 49 | 49 | 0.55% | 0.71% | 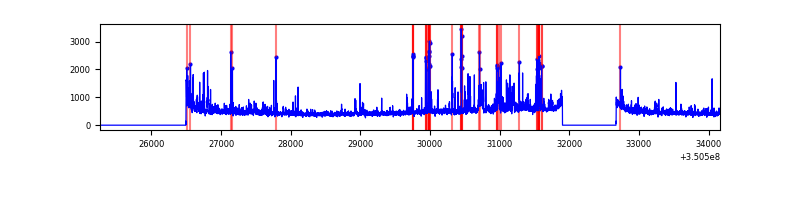 |
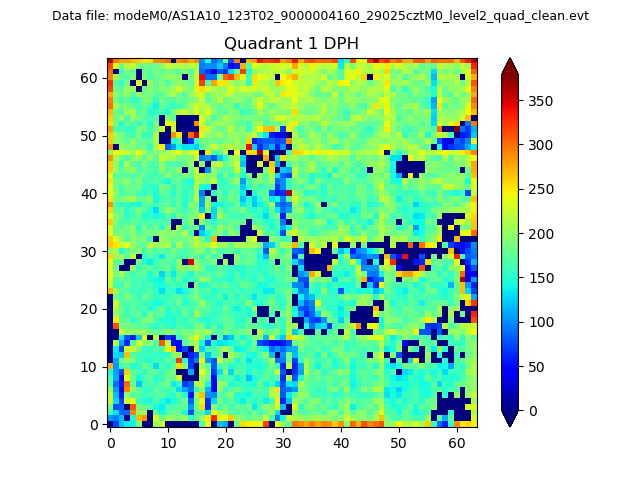
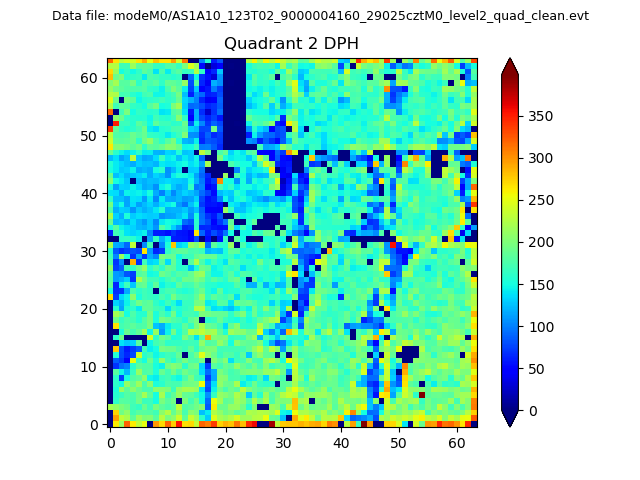
Top three noisy pixels from each quadrant. If the there are fewer than three noisy pixels in the level2.evt file, extra rows are filled as -1
| Pixel properties | Quadrant properties | ||||||
|---|---|---|---|---|---|---|---|
| Quadrant | DetID | PixID | Counts | Sigma | Mean | Median | Sigma |
| A | 13 | 254 | 11277 | 63.23 | 831 | 813 | 165.5 |
| A | 3 | 137 | 8292 | 45.19 | 831 | 813 | 165.5 |
| A | 0 | 226 | 6949 | 37.08 | 831 | 813 | 165.5 |
| B | 12 | 111 | 19829 | 120.23 | 832 | 810 | 158.2 |
| B | 11 | 111 | 18290 | 110.5 | 832 | 810 | 158.2 |
| B | 14 | 111 | 17388 | 104.8 | 832 | 810 | 158.2 |
| C | 14 | 238 | 130791 | 684.69 | 809 | 813 | 189.8 |
| C | 2 | 114 | 16051 | 80.27 | 809 | 813 | 189.8 |
| C | 3 | 233 | 8842 | 42.29 | 809 | 813 | 189.8 |
| D | 8 | 195 | 271643 | 1419.16 | 801 | 780 | 190.9 |
| D | 1 | 52 | 217095 | 1133.36 | 801 | 780 | 190.9 |
| D | 7 | 80 | 182576 | 952.5 | 801 | 780 | 190.9 |
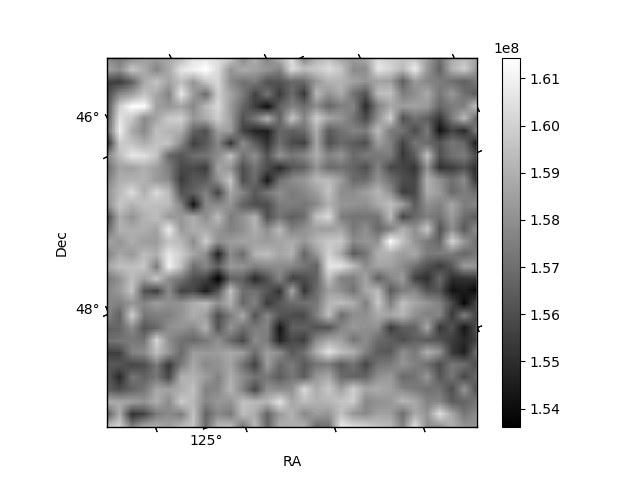
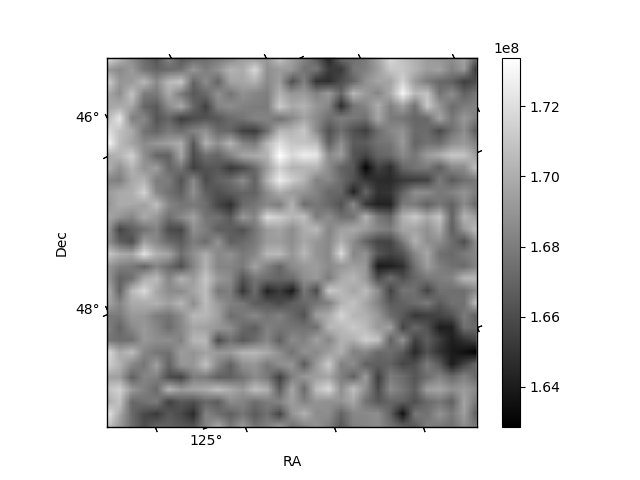
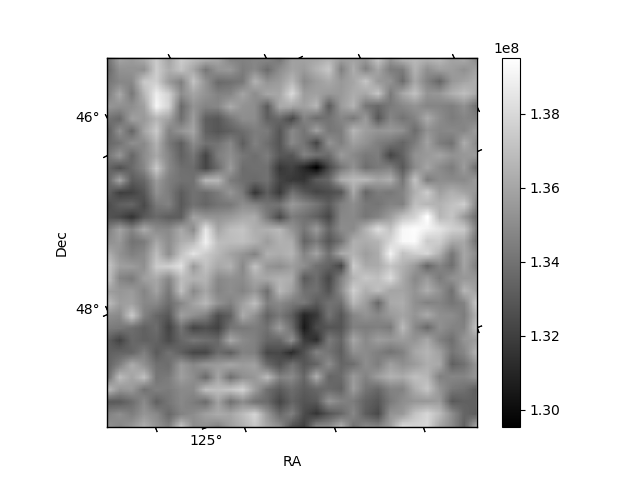
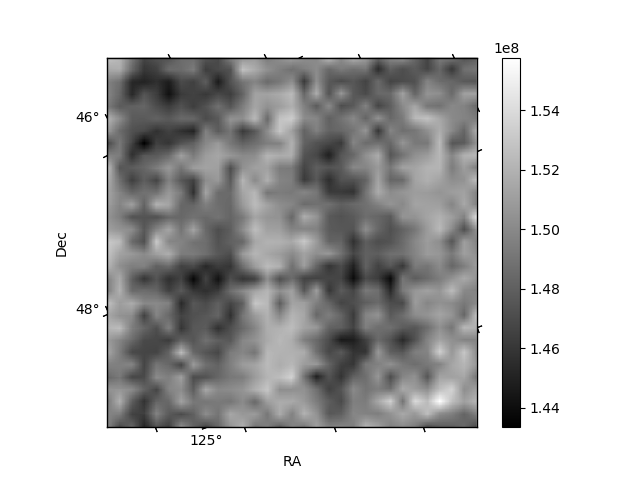
Histogram calculated using DETX and DETY for each event in the final _common_clean file
| Quadrant A | 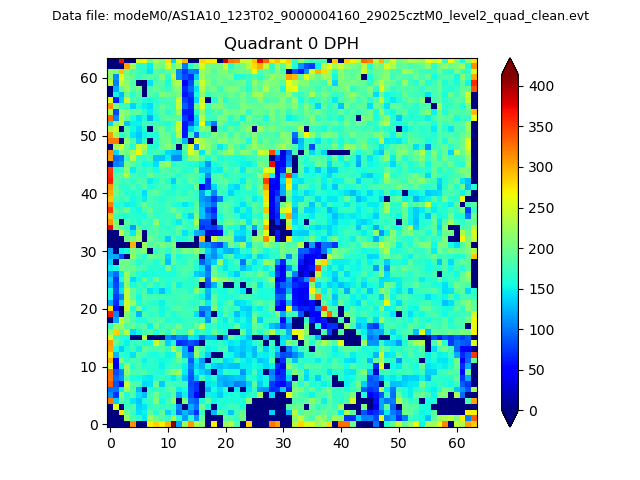 |
 |
Quadrant B |
|---|---|---|---|
| Quadrant D | 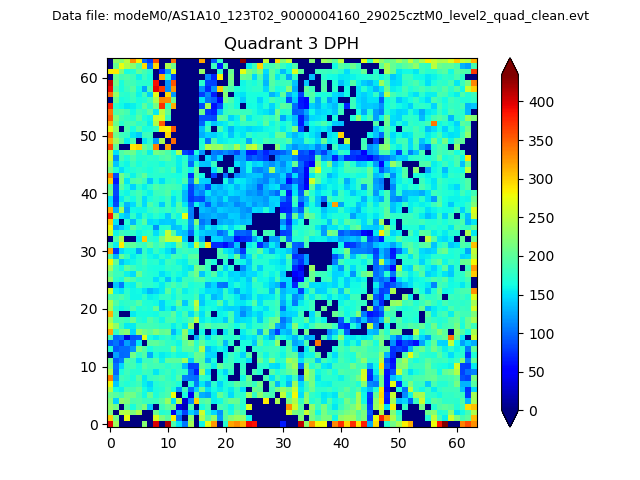 |
 |
Quadrant C |
| Plot type | Count rate plots | Images |
|---|---|---|
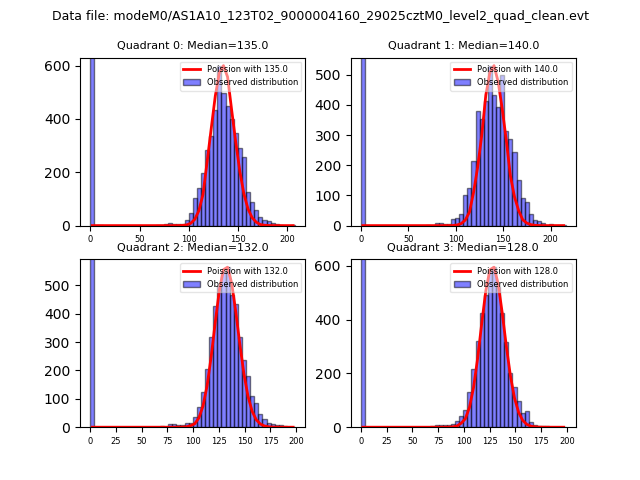
| Comparison with Poisson distribution Blue bars denote a histogram of data divided into 1 sec bins. Red curve is a Poisson curve with rate = median count rate of data. |
 |
 |
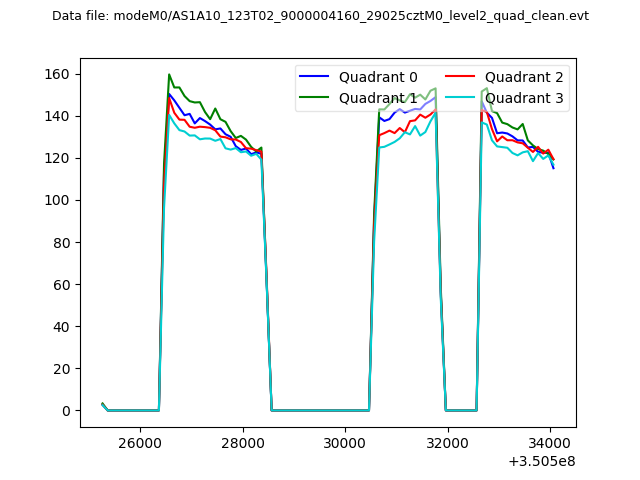
| Quadrant-wise count rates Data is divided into 100 sec bins |
 |
|
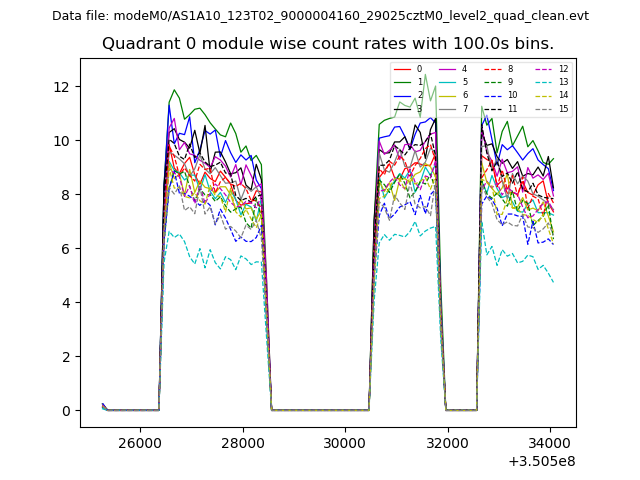
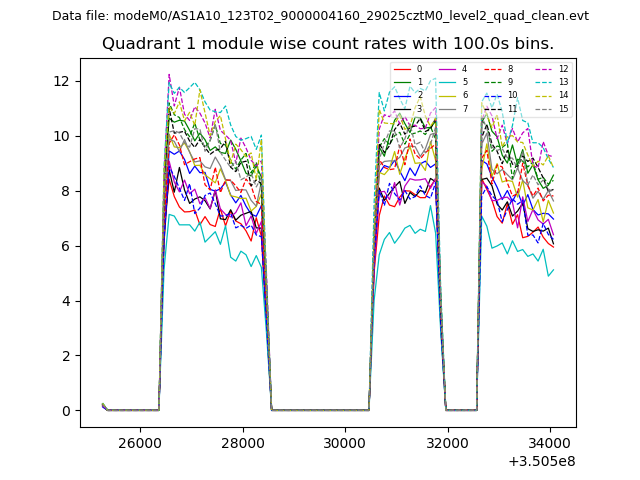
| Module-wise count rates for Quadrant A Data is divided into 100 sec bins |
 |
 |
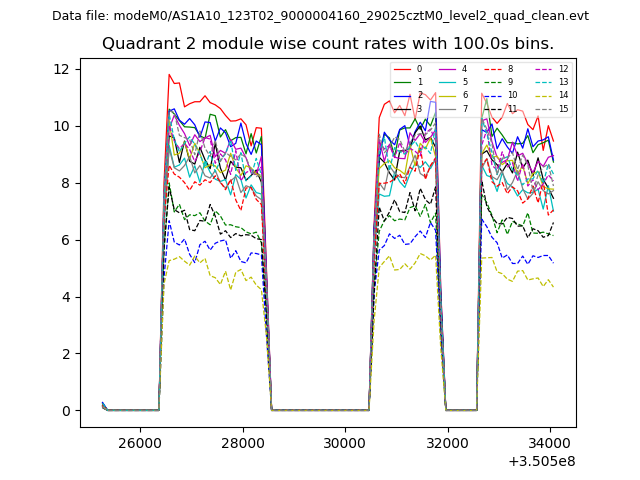
| Module-wise count rates for Quadrant B Data is divided into 100 sec bins |
 |
 |
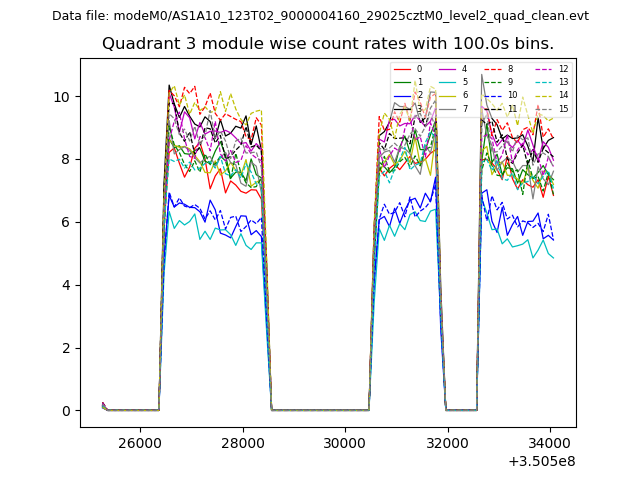
| Module-wise count rates for Quadrant C Data is divided into 100 sec bins |
 |
 |
| Module-wise count rates for Quadrant D Data is divided into 100 sec bins |
 |
 |
| Parameter | Plot |
|---|---|
| CZT HV Monitor | 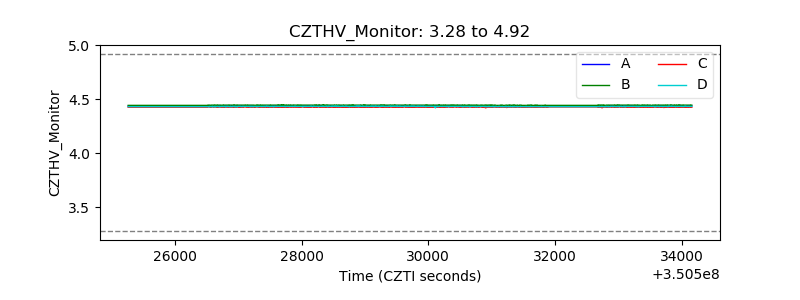 |
| D_VDD | 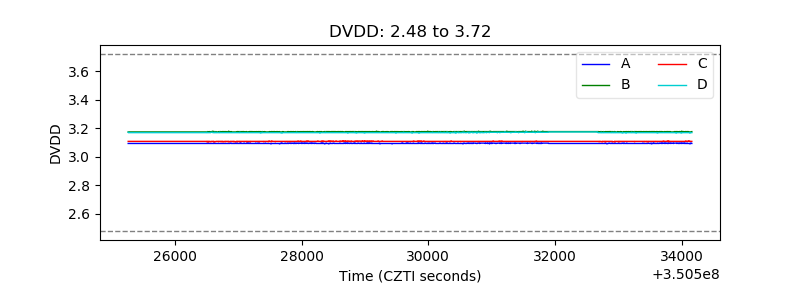 |
| Temperature 1 | 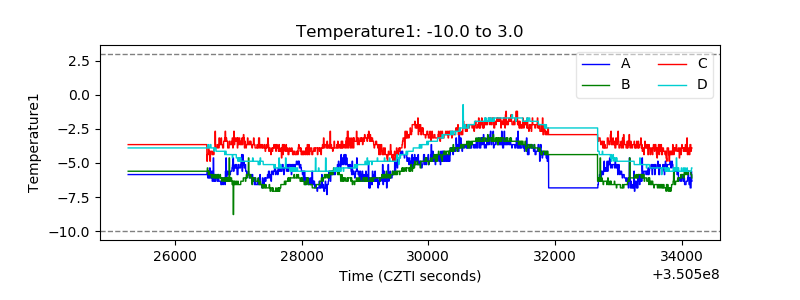 |
| Veto HV Monitor | 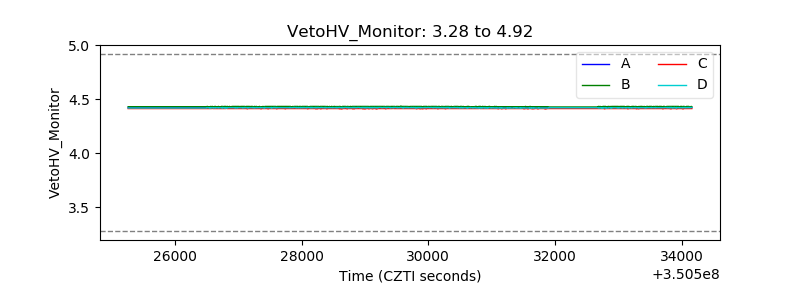 |
| Veto LLD | 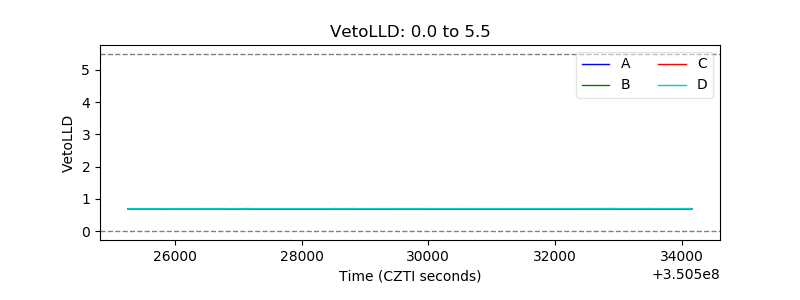 |
| Alpha Counter | 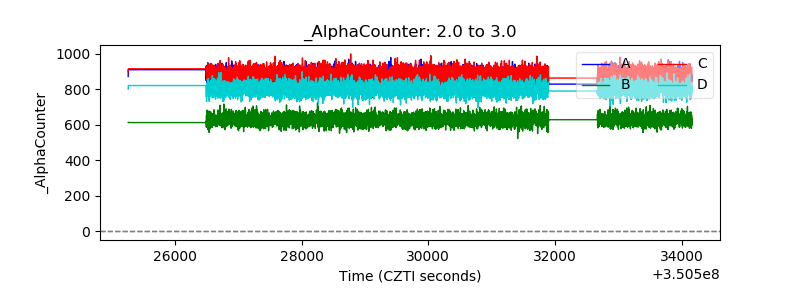 |
| _CPM_Rate | 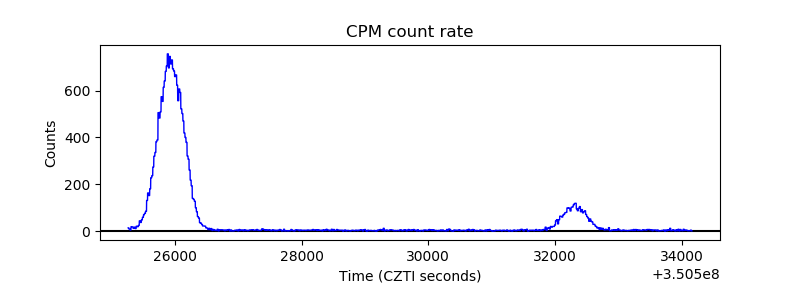 |
| CZT Counter | 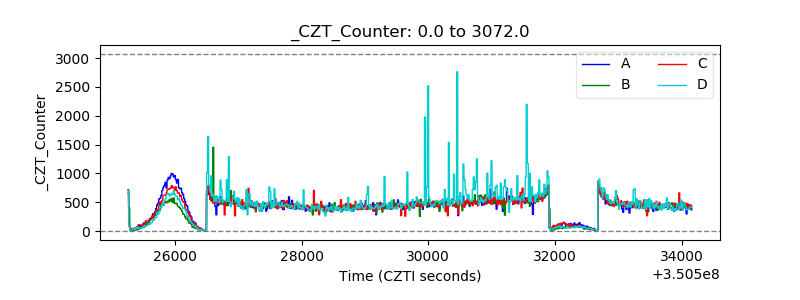 |
| +2.5 Volts monitor |  |
| +5 Volts monitor |  |
| _ROLL_ROT | 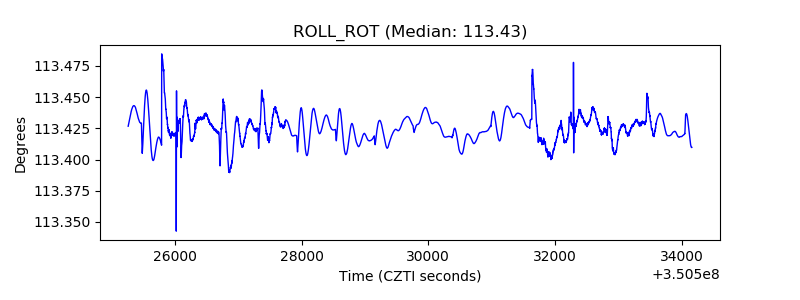 |
| _Roll_DEC | 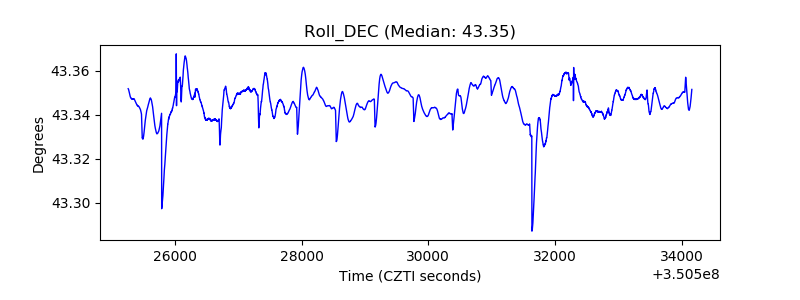 |
| _Roll_RA | 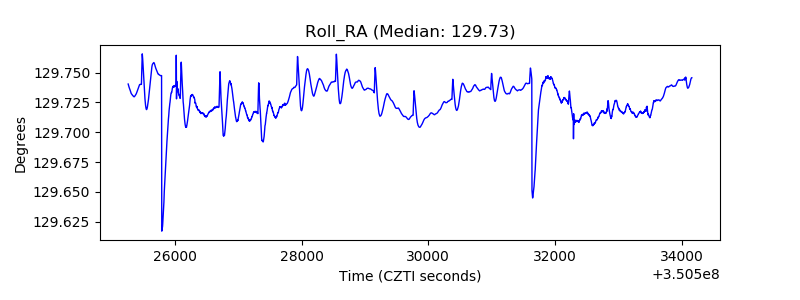 |
| Veto Counter | 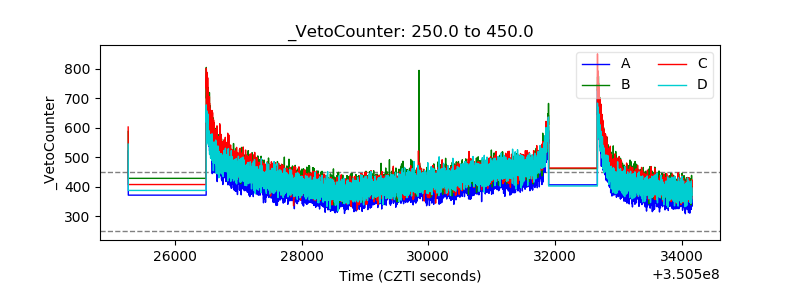 |