| Param | Original file | Final file |
|---|---|---|
| Filename | modeM0/AS1A10_123T02_9000004160_29026cztM0_level2.evt | modeM0/AS1A10_123T02_9000004160_29026cztM0_level2_quad_clean.evt |
| Size (bytes) | 499,668,480 | 105,744,960 |
| Size | 476.5 MB | 100.8 MB |
| Events in quadrant A | 3,438,407 | 677,864 |
| Events in quadrant B | 3,583,729 | 701,026 |
| Events in quadrant C | 3,547,924 | 663,871 |
| Events in quadrant D | 4,059,661 | 644,597 |
| Mode M9 | |||
|---|---|---|---|
| Quadrant | BADHDUFLAG | Total packets | Discarded packets |
| A | 0 | 9 | 0 |
| B | 0 | 10 | 0 |
| C | 0 | 10 | 0 |
| D | 0 | 10 | 0 |
| Mode SS | |||
|---|---|---|---|
| Quadrant | BADHDUFLAG | Total packets | Discarded packets |
| A | 0 | 152 | 0 |
| B | 0 | 152 | 0 |
| C | 0 | 152 | 0 |
| D | 0 | 152 | 0 |
| Mode M0 | |||
|---|---|---|---|
| Quadrant | BADHDUFLAG | Total packets | Discarded packets |
| A | 0 | 15212 | 2 |
| B | 0 | 15400 | 2 |
| C | 0 | 15356 | 2 |
| D | 0 | 17058 | 2 |
| Quadrant | Total seconds | Saturated seconds | Saturation percentage |
|---|---|---|---|
| A | 7400 | 82 | 1.108108% |
| B | 7400 | 139 | 1.878378% |
| C | 7400 | 140 | 1.891892% |
| D | 7400 | 105 | 1.418919% |
Noise dominated data is calculated using 1-second bins in cleaned event files. If a bin has >2000 counts, and if more than 50% of those come from <1% of pixels, then it is considered to be noise-dominated and hence unusable.
| Quadrant | # 1 sec bins | Bins with >0 counts | Bins with >2000 counts | High rate bins dominated by noise | Noise dominated (total time) | Noise dominated (detector-on time) | Marked lightcurve |
|---|---|---|---|---|---|---|---|
| A | 7695 | 7401 | 0 | 0 | 0.00% | 0.00% | 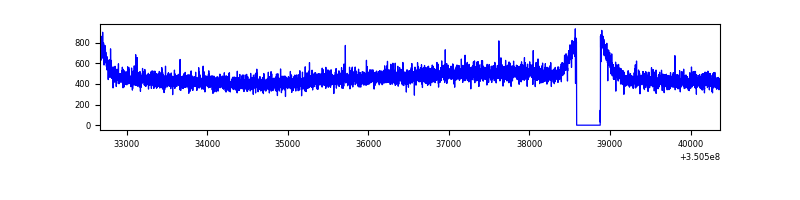 |
| B | 7695 | 7401 | 1 | 1 | 0.01% | 0.01% | 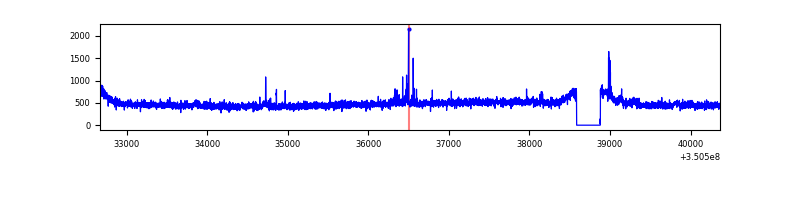 |
| C | 7695 | 7401 | 4 | 4 | 0.05% | 0.05% | 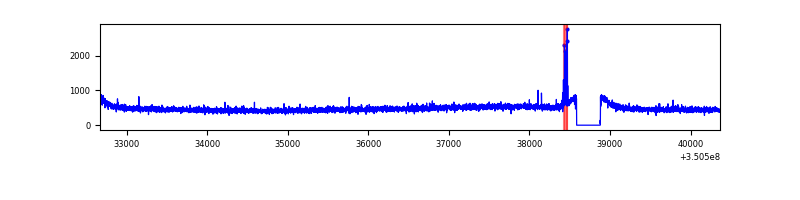 |
| D | 7695 | 7401 | 50 | 50 | 0.65% | 0.68% | 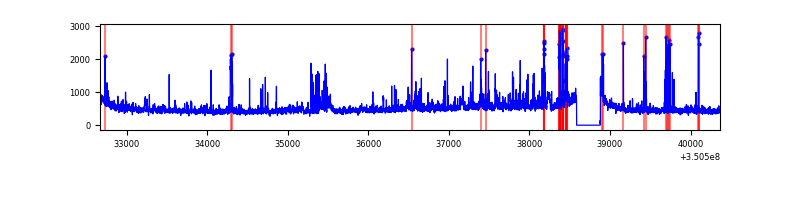 |
Top three noisy pixels from each quadrant. If the there are fewer than three noisy pixels in the level2.evt file, extra rows are filled as -1
| Pixel properties | Quadrant properties | ||||||
|---|---|---|---|---|---|---|---|
| Quadrant | DetID | PixID | Counts | Sigma | Mean | Median | Sigma |
| A | 13 | 254 | 12803 | 66.78 | 890 | 869 | 178.7 |
| A | 3 | 137 | 9032 | 45.68 | 890 | 869 | 178.7 |
| A | 0 | 226 | 7512 | 37.17 | 890 | 869 | 178.7 |
| B | 0 | 229 | 30987 | 175.92 | 891 | 866 | 171.2 |
| B | 10 | 245 | 22958 | 129.03 | 891 | 866 | 171.2 |
| B | 12 | 111 | 21592 | 121.05 | 891 | 866 | 171.2 |
| C | 14 | 238 | 138248 | 672.67 | 863 | 868 | 204.2 |
| C | 2 | 16 | 25202 | 119.15 | 863 | 868 | 204.2 |
| C | 2 | 114 | 17181 | 79.87 | 863 | 868 | 204.2 |
| D | 1 | 52 | 356682 | 1719.2 | 861 | 837 | 207.0 |
| D | 8 | 195 | 318843 | 1536.39 | 861 | 837 | 207.0 |
| D | 7 | 80 | 104559 | 501.11 | 861 | 837 | 207.0 |
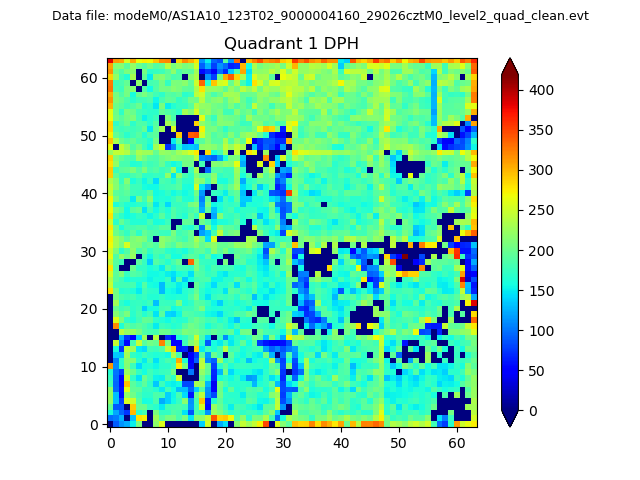
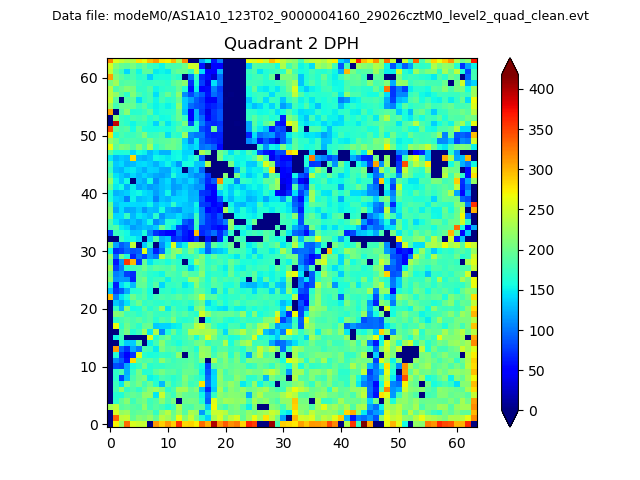
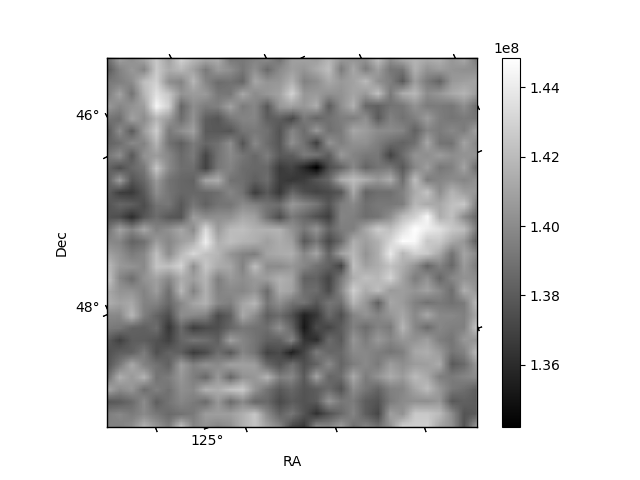
Histogram calculated using DETX and DETY for each event in the final _common_clean file
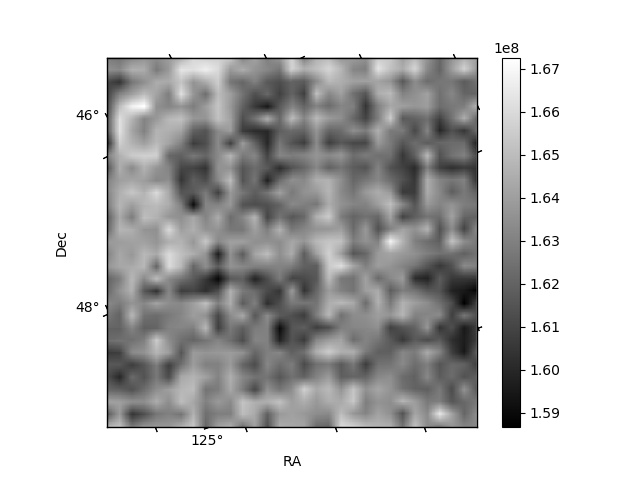
| Quadrant A |  |
 |
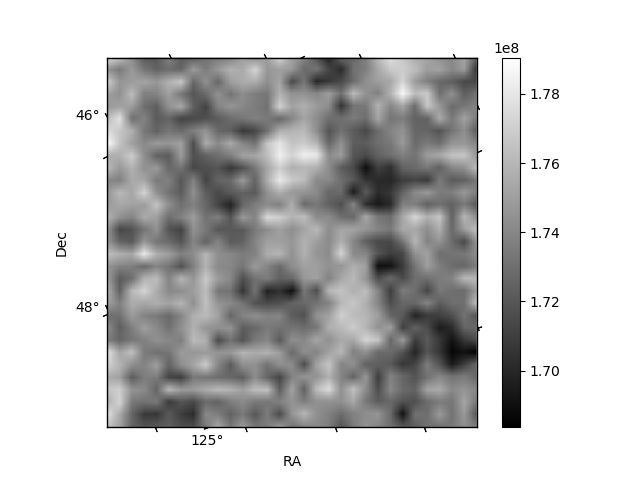
Quadrant B |
|---|---|---|---|
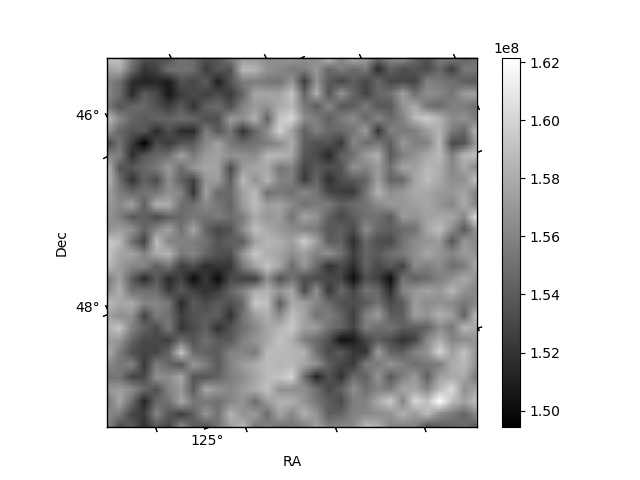
| Quadrant D |  |
 |
Quadrant C |
| Plot type | Count rate plots | Images |
|---|---|---|
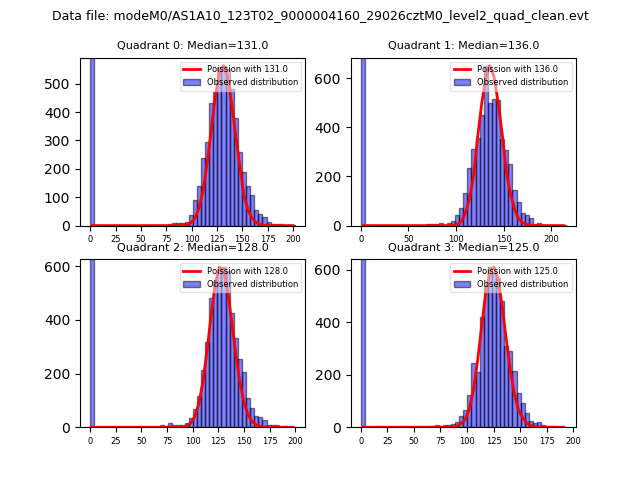
| Comparison with Poisson distribution Blue bars denote a histogram of data divided into 1 sec bins. Red curve is a Poisson curve with rate = median count rate of data. |
 |
 |
| Quadrant-wise count rates Data is divided into 100 sec bins |
 |
|
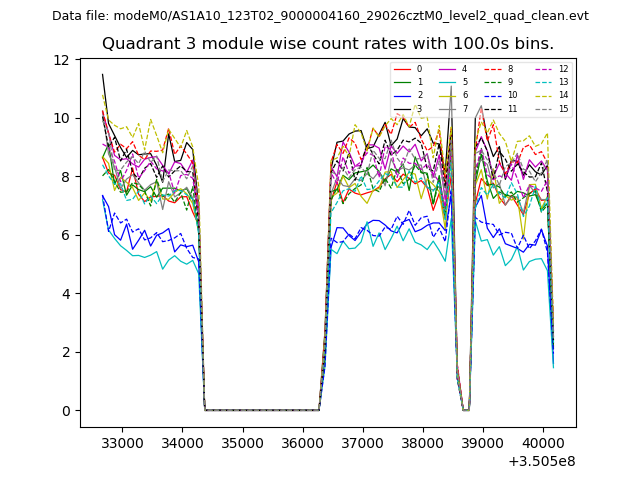
| Module-wise count rates for Quadrant A Data is divided into 100 sec bins |
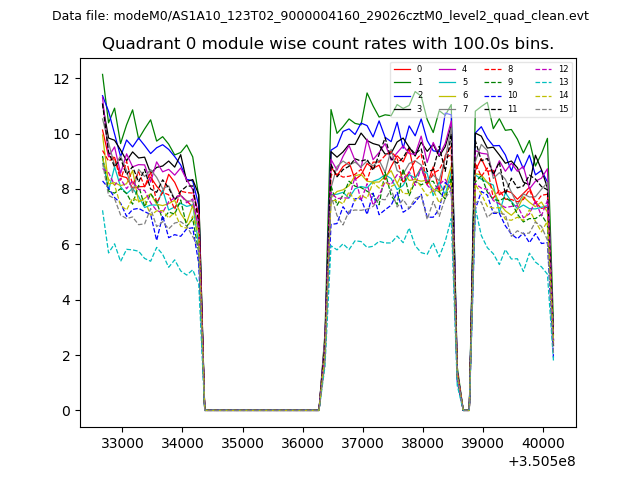 |
 |
| Module-wise count rates for Quadrant B Data is divided into 100 sec bins |
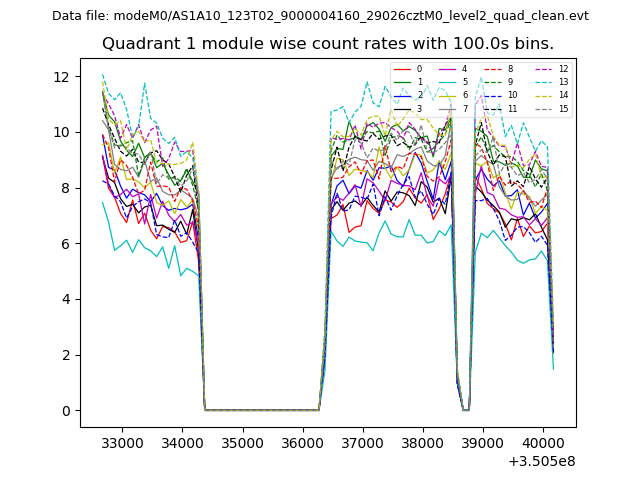 |
 |
| Module-wise count rates for Quadrant C Data is divided into 100 sec bins |
 |
 |
| Module-wise count rates for Quadrant D Data is divided into 100 sec bins |
 |
 |
| Parameter | Plot |
|---|---|
| CZT HV Monitor |  |
| D_VDD | 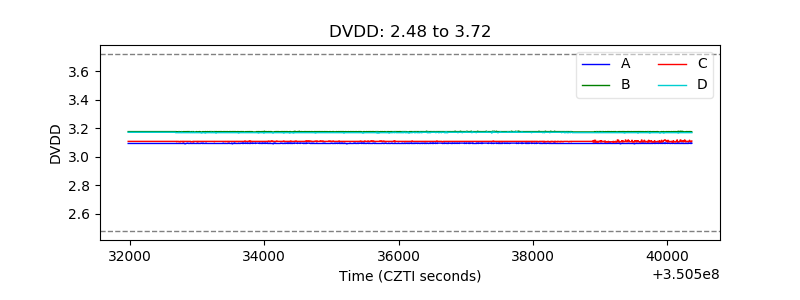 |
| Temperature 1 | 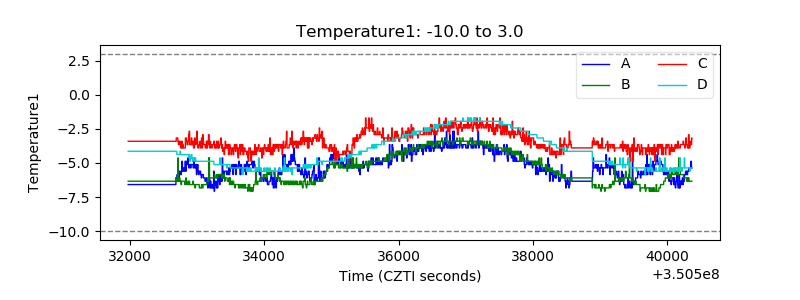 |
| Veto HV Monitor | 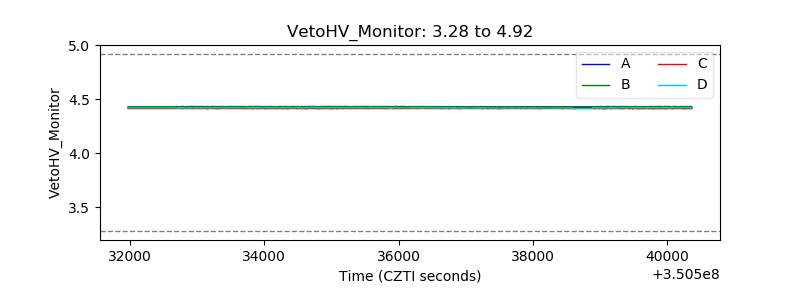 |
| Veto LLD | 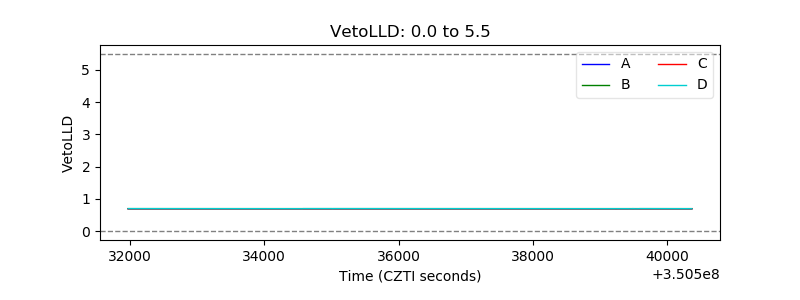 |
| Alpha Counter | 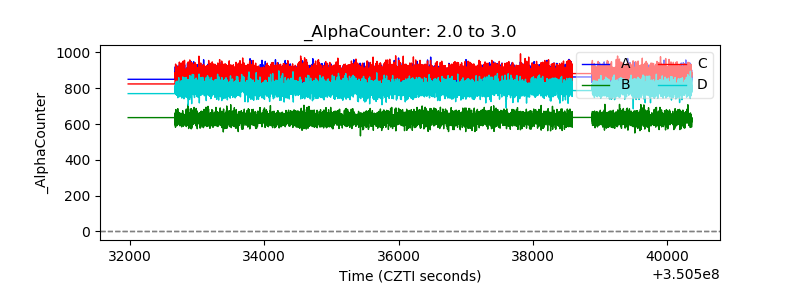 |
| _CPM_Rate | 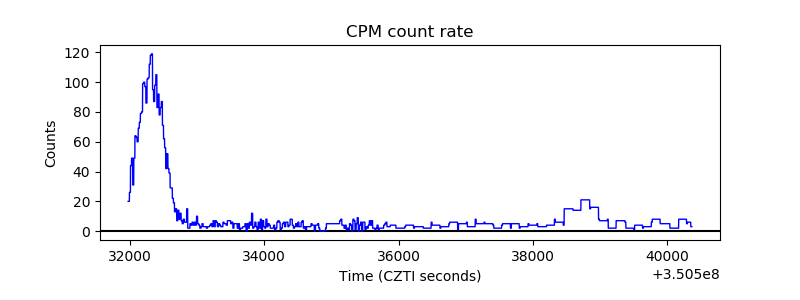 |
| CZT Counter | 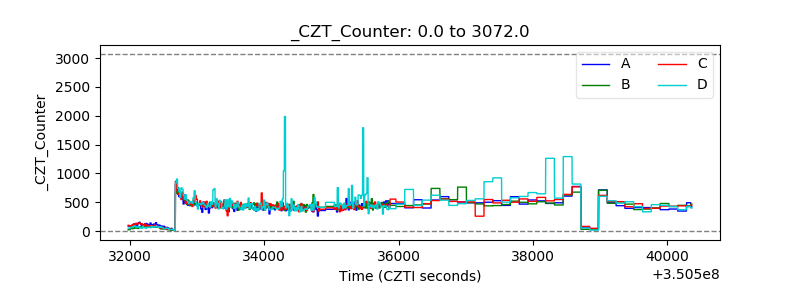 |
| +2.5 Volts monitor |  |
| +5 Volts monitor |  |
| _ROLL_ROT | 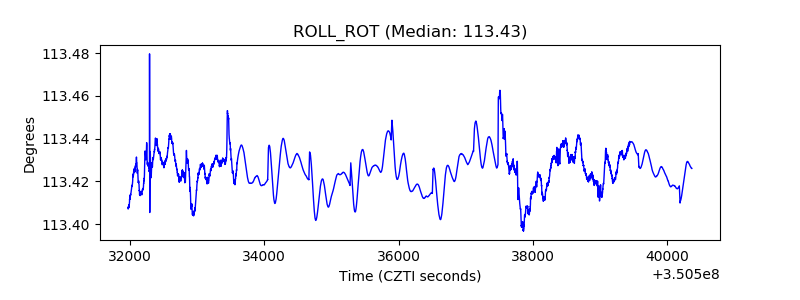 |
| _Roll_DEC | 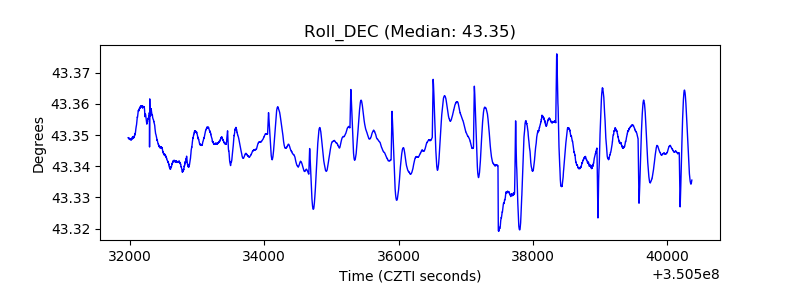 |
| _Roll_RA | 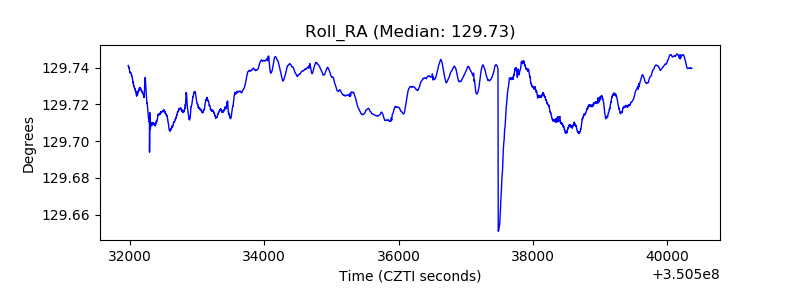 |
| Veto Counter | 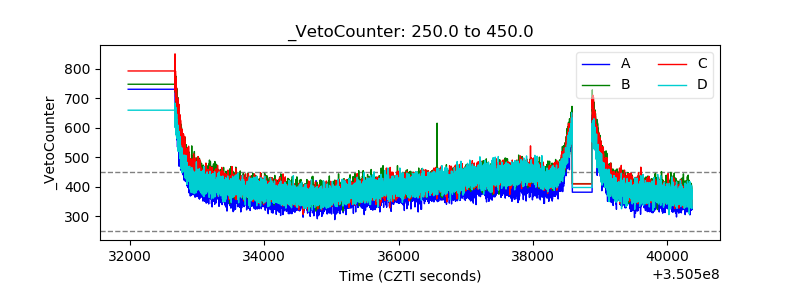 |