| Param | Original file | Final file |
|---|---|---|
| Filename | modeM0/AS1A10_123T02_9000004160_29028cztM0_level2.evt | modeM0/AS1A10_123T02_9000004160_29028cztM0_level2_quad_clean.evt |
| Size (bytes) | 638,694,720 | 87,154,560 |
| Size | 609.1 MB | 83.1 MB |
| Events in quadrant A | 3,484,258 | 540,482 |
| Events in quadrant B | 3,590,246 | 558,748 |
| Events in quadrant C | 3,652,540 | 526,857 |
| Events in quadrant D | 8,103,571 | 486,920 |
| Mode M9 | |||
|---|---|---|---|
| Quadrant | BADHDUFLAG | Total packets | Discarded packets |
| A | 0 | 3 | 0 |
| B | 0 | 3 | 0 |
| C | 0 | 3 | 0 |
| D | 0 | 3 | 0 |
| Mode SS | |||
|---|---|---|---|
| Quadrant | BADHDUFLAG | Total packets | Discarded packets |
| A | 0 | 152 | 0 |
| B | 0 | 152 | 0 |
| C | 0 | 152 | 0 |
| D | 0 | 152 | 0 |
| Mode M0 | |||
|---|---|---|---|
| Quadrant | BADHDUFLAG | Total packets | Discarded packets |
| A | 0 | 15401 | 1 |
| B | 0 | 15475 | 1 |
| C | 0 | 15612 | 1 |
| D | 0 | 29295 | 1 |
| Quadrant | Total seconds | Saturated seconds | Saturation percentage |
|---|---|---|---|
| A | 7564 | 104 | 1.374934% |
| B | 7565 | 120 | 1.586252% |
| C | 7565 | 144 | 1.903503% |
| D | 7565 | 1117 | 14.765367% |
Noise dominated data is calculated using 1-second bins in cleaned event files. If a bin has >2000 counts, and if more than 50% of those come from <1% of pixels, then it is considered to be noise-dominated and hence unusable.
| Quadrant | # 1 sec bins | Bins with >0 counts | Bins with >2000 counts | High rate bins dominated by noise | Noise dominated (total time) | Noise dominated (detector-on time) | Marked lightcurve |
|---|---|---|---|---|---|---|---|
| A | 7879 | 7565 | 0 | 0 | 0.00% | 0.00% | 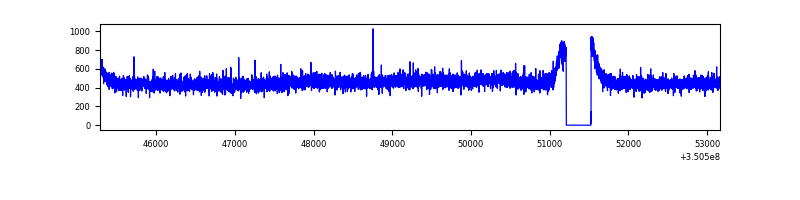 |
| B | 7880 | 7566 | 1 | 1 | 0.01% | 0.01% | 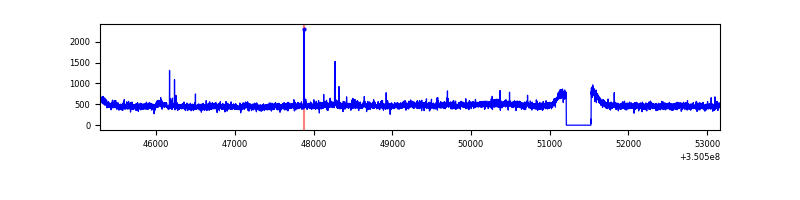 |
| C | 7880 | 7566 | 4 | 4 | 0.05% | 0.05% | 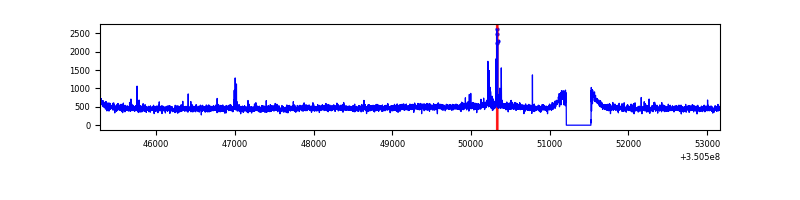 |
| D | 7880 | 7566 | 1036 | 1036 | 13.15% | 13.69% | 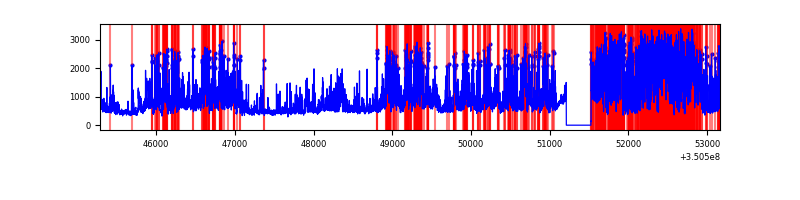 |
Top three noisy pixels from each quadrant. If the there are fewer than three noisy pixels in the level2.evt file, extra rows are filled as -1
| Pixel properties | Quadrant properties | ||||||
|---|---|---|---|---|---|---|---|
| Quadrant | DetID | PixID | Counts | Sigma | Mean | Median | Sigma |
| A | 13 | 254 | 12840 | 64.98 | 902 | 881 | 184.1 |
| A | 3 | 137 | 9441 | 46.51 | 902 | 881 | 184.1 |
| A | 0 | 226 | 7440 | 35.64 | 902 | 881 | 184.1 |
| B | 0 | 229 | 33228 | 185.48 | 900 | 876 | 174.4 |
| B | 12 | 111 | 22777 | 125.57 | 900 | 876 | 174.4 |
| B | 11 | 111 | 20570 | 112.91 | 900 | 876 | 174.4 |
| C | 14 | 238 | 138848 | 675.58 | 869 | 872 | 204.2 |
| C | 3 | 233 | 63955 | 308.88 | 869 | 872 | 204.2 |
| C | 2 | 16 | 43294 | 207.71 | 869 | 872 | 204.2 |
| D | 7 | 80 | 4135597 | 21227.39 | 816 | 794 | 194.8 |
| D | 8 | 195 | 474239 | 2430.59 | 816 | 794 | 194.8 |
| D | 1 | 52 | 402635 | 2062.99 | 816 | 794 | 194.8 |
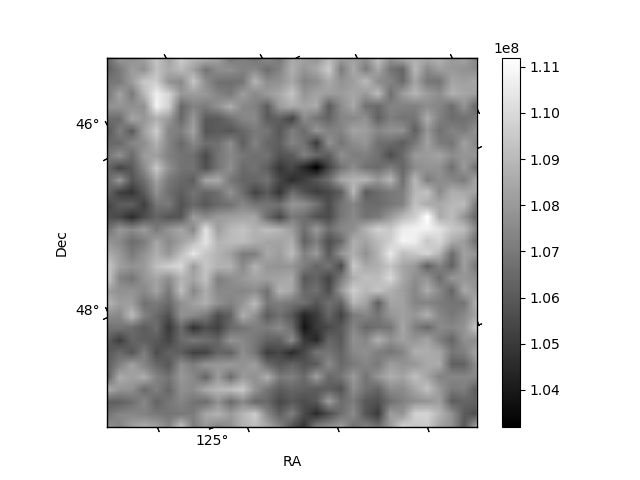
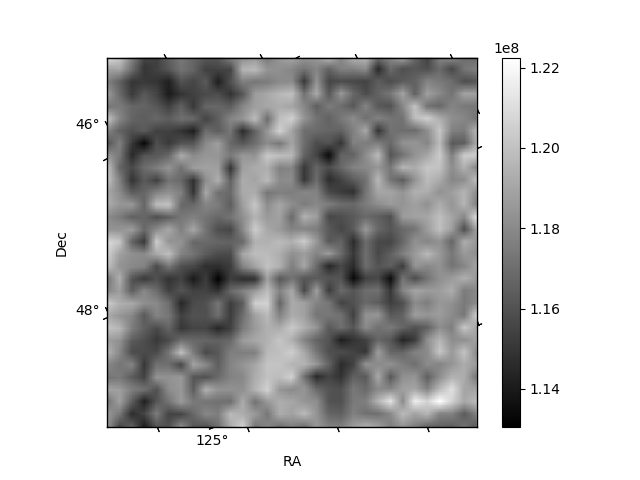
Histogram calculated using DETX and DETY for each event in the final _common_clean file
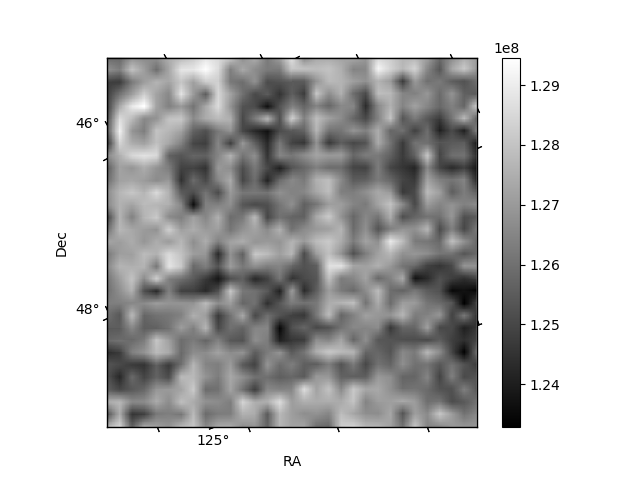
| Quadrant A |  |
 |
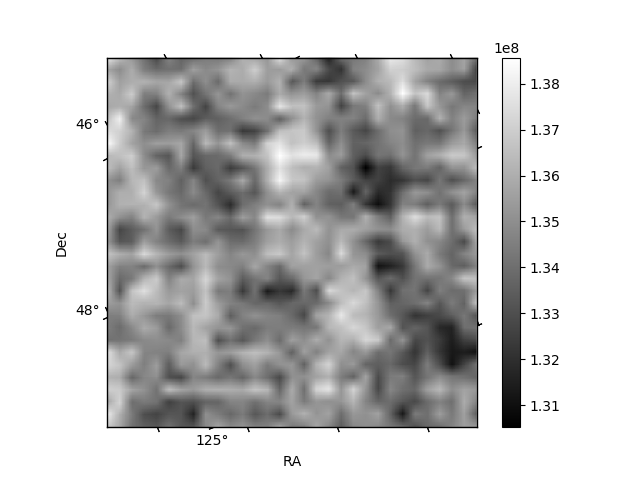
Quadrant B |
|---|---|---|---|
| Quadrant D |  |
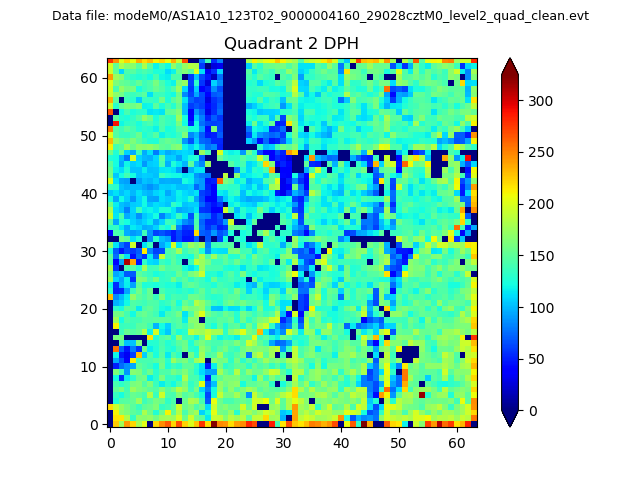 |
Quadrant C |
| Plot type | Count rate plots | Images |
|---|---|---|
| Comparison with Poisson distribution Blue bars denote a histogram of data divided into 1 sec bins. Red curve is a Poisson curve with rate = median count rate of data. |
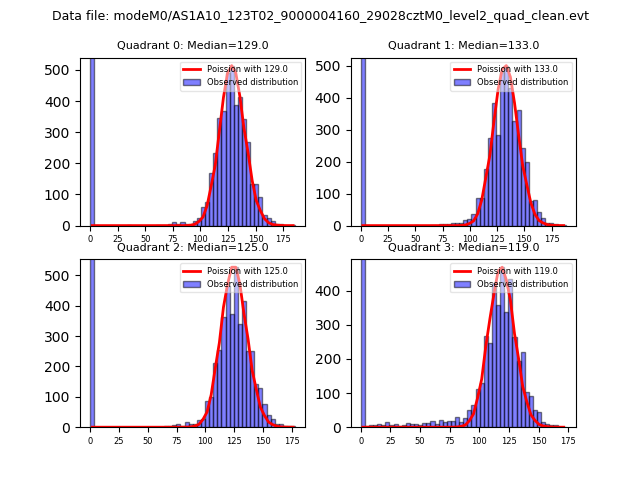 |
 |
| Quadrant-wise count rates Data is divided into 100 sec bins |
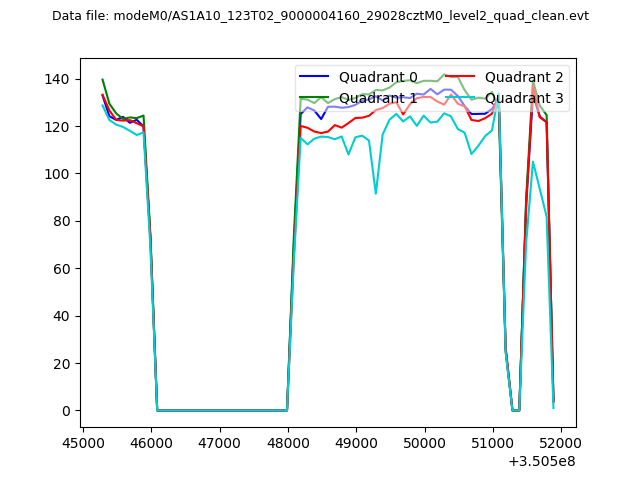 |
|
| Module-wise count rates for Quadrant A Data is divided into 100 sec bins |
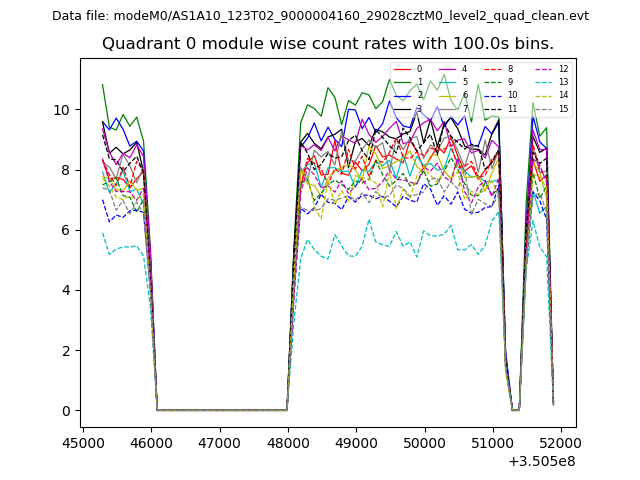 |
 |
| Module-wise count rates for Quadrant B Data is divided into 100 sec bins |
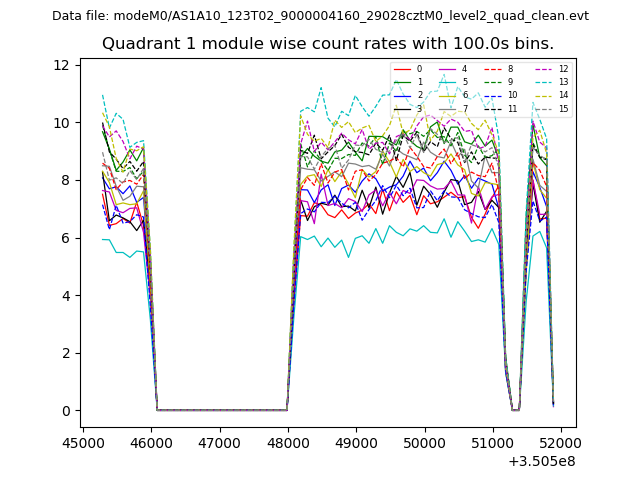 |
 |
| Module-wise count rates for Quadrant C Data is divided into 100 sec bins |
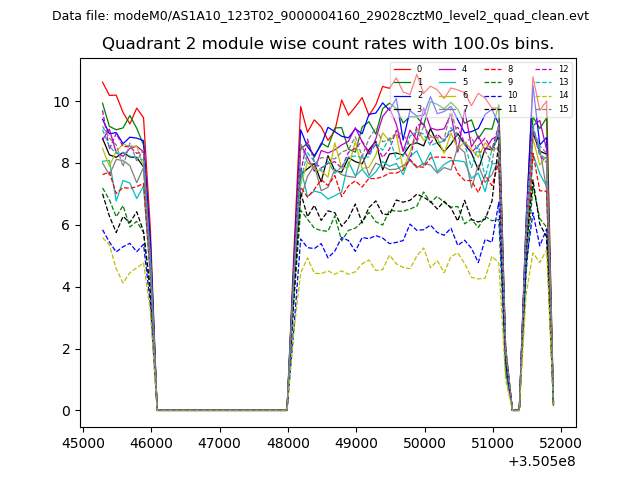 |
 |
| Module-wise count rates for Quadrant D Data is divided into 100 sec bins |
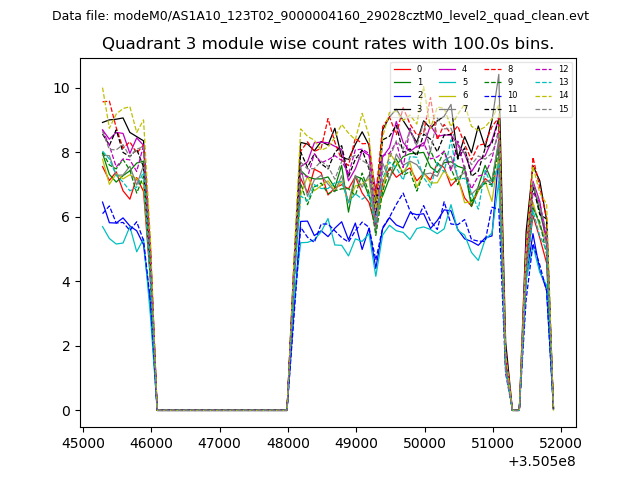 |
 |
| Parameter | Plot |
|---|---|
| CZT HV Monitor |  |
| D_VDD | 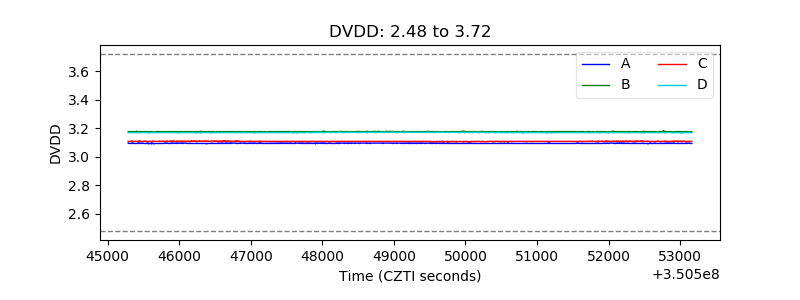 |
| Temperature 1 | 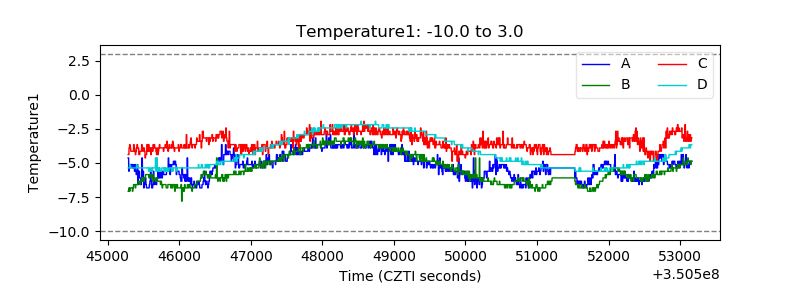 |
| Veto HV Monitor | 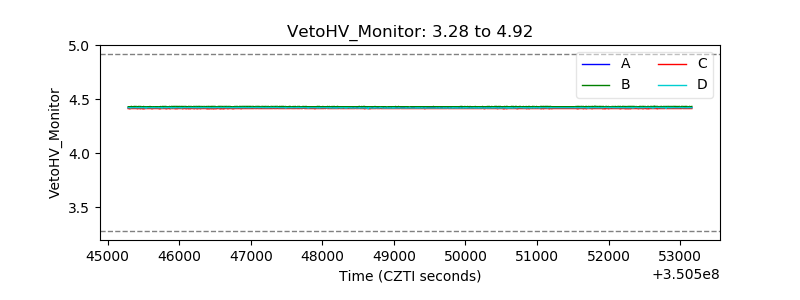 |
| Veto LLD | 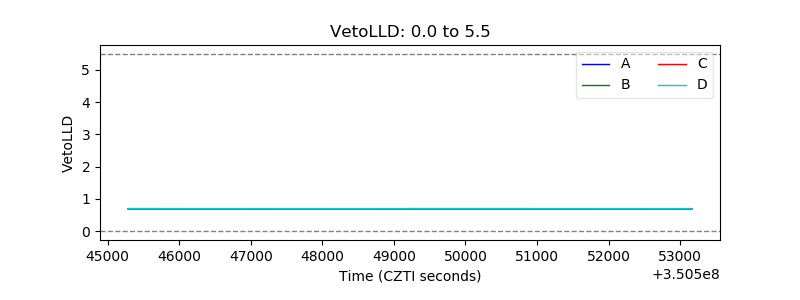 |
| Alpha Counter | 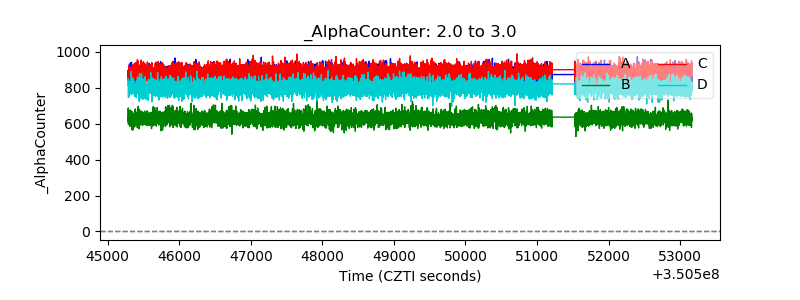 |
| _CPM_Rate | 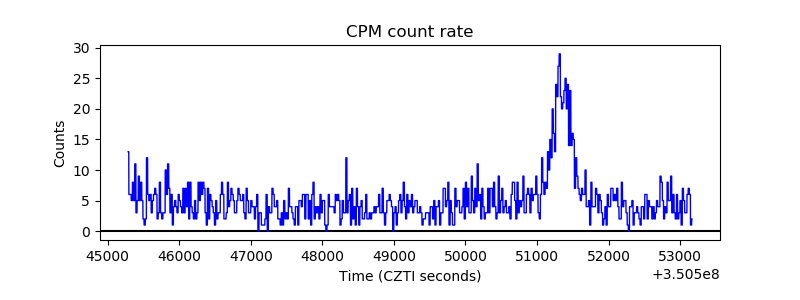 |
| CZT Counter | 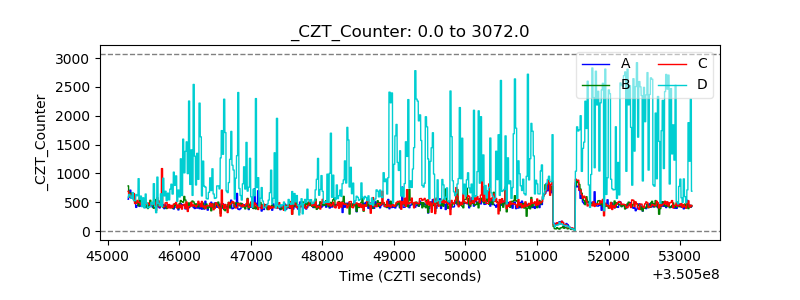 |
| +2.5 Volts monitor |  |
| +5 Volts monitor |  |
| _ROLL_ROT | 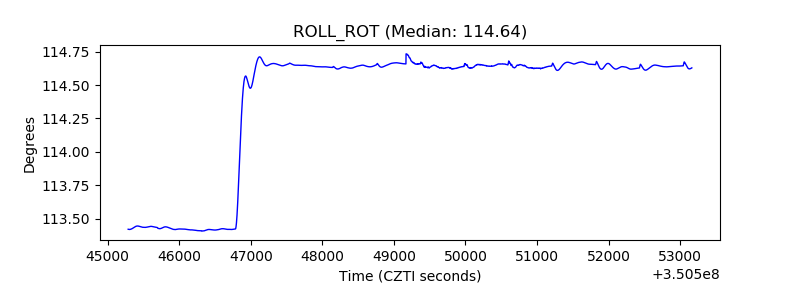 |
| _Roll_DEC | 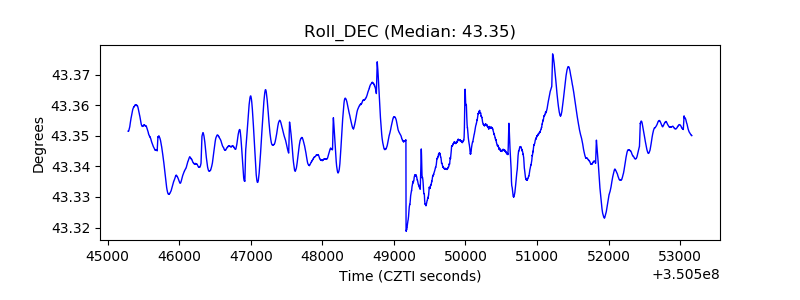 |
| _Roll_RA | 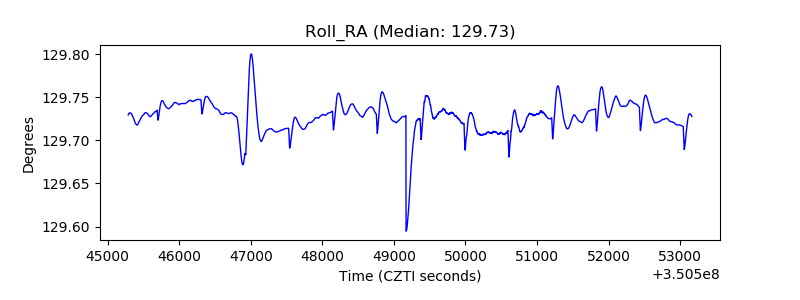 |
| Veto Counter | 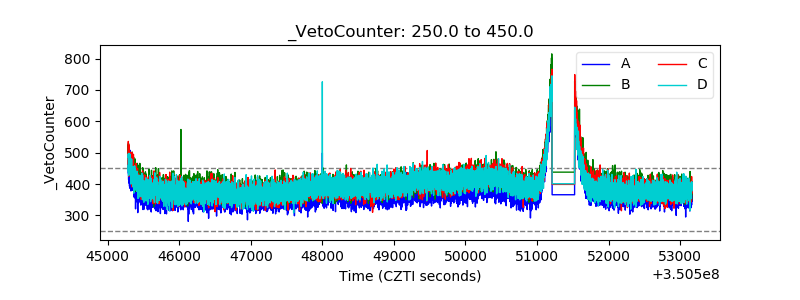 |