| Param | Original file | Final file |
|---|---|---|
| Filename | modeM0/AS1A10_123T02_9000004160_29030cztM0_level2.evt | modeM0/AS1A10_123T02_9000004160_29030cztM0_level2_quad_clean.evt |
| Size (bytes) | 1,231,698,240 | 142,776,000 |
| Size | 1.1 GB | 136.2 MB |
| Events in quadrant A | 5,915,286 | 917,088 |
| Events in quadrant B | 6,065,252 | 948,572 |
| Events in quadrant C | 6,209,216 | 888,925 |
| Events in quadrant D | 18,248,942 | 684,537 |
| Mode M9 | |||
|---|---|---|---|
| Quadrant | BADHDUFLAG | Total packets | Discarded packets |
| A | 0 | 13 | 0 |
| B | 0 | 13 | 0 |
| C | 0 | 13 | 0 |
| D | 0 | 13 | 0 |
| Mode SS | |||
|---|---|---|---|
| Quadrant | BADHDUFLAG | Total packets | Discarded packets |
| A | 0 | 258 | 0 |
| B | 0 | 258 | 0 |
| C | 0 | 258 | 0 |
| D | 0 | 258 | 0 |
| Mode M0 | |||
|---|---|---|---|
| Quadrant | BADHDUFLAG | Total packets | Discarded packets |
| A | 0 | 25910 | 2 |
| B | 0 | 26034 | 2 |
| C | 0 | 26323 | 2 |
| D | 0 | 62707 | 2 |
| Quadrant | Total seconds | Saturated seconds | Saturation percentage |
|---|---|---|---|
| A | 12788 | 129 | 1.008758% |
| B | 12789 | 133 | 1.039956% |
| C | 12789 | 172 | 1.344906% |
| D | 12789 | 4666 | 36.484479% |
Noise dominated data is calculated using 1-second bins in cleaned event files. If a bin has >2000 counts, and if more than 50% of those come from <1% of pixels, then it is considered to be noise-dominated and hence unusable.
| Quadrant | # 1 sec bins | Bins with >0 counts | Bins with >2000 counts | High rate bins dominated by noise | Noise dominated (total time) | Noise dominated (detector-on time) | Marked lightcurve |
|---|---|---|---|---|---|---|---|
| A | 14028 | 12790 | 0 | 0 | 0.00% | 0.00% | 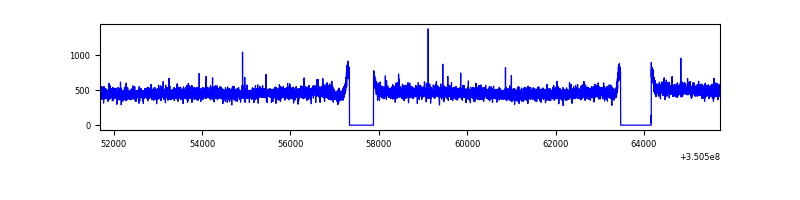 |
| B | 14029 | 12791 | 0 | 0 | 0.00% | 0.00% | 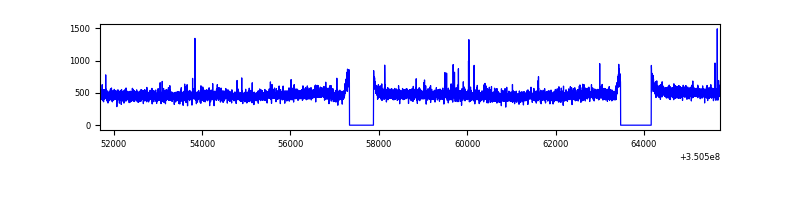 |
| C | 14029 | 12791 | 1 | 1 | 0.01% | 0.01% | 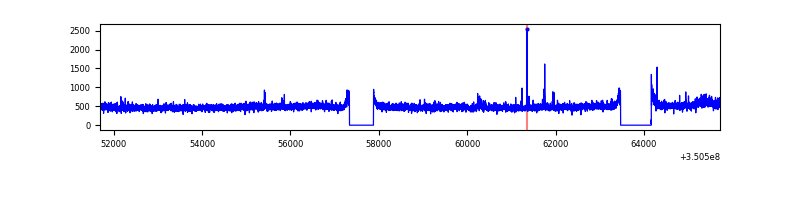 |
| D | 14029 | 12791 | 4435 | 4435 | 31.61% | 34.67% | 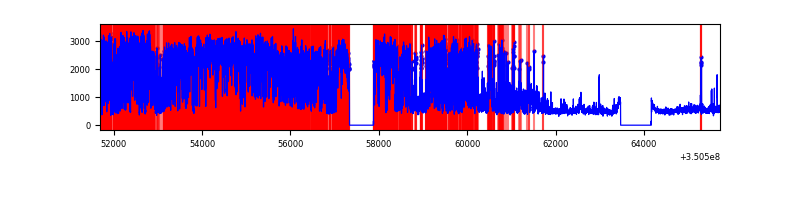 |
Top three noisy pixels from each quadrant. If the there are fewer than three noisy pixels in the level2.evt file, extra rows are filled as -1
| Pixel properties | Quadrant properties | ||||||
|---|---|---|---|---|---|---|---|
| Quadrant | DetID | PixID | Counts | Sigma | Mean | Median | Sigma |
| A | 13 | 254 | 21267 | 64.23 | 1531 | 1501 | 307.7 |
| A | 3 | 137 | 15851 | 46.63 | 1531 | 1501 | 307.7 |
| A | 0 | 226 | 12809 | 36.74 | 1531 | 1501 | 307.7 |
| B | 12 | 111 | 38222 | 125.37 | 1529 | 1490 | 293.0 |
| B | 11 | 111 | 35227 | 115.15 | 1529 | 1490 | 293.0 |
| B | 14 | 111 | 32847 | 107.02 | 1529 | 1490 | 293.0 |
| C | 14 | 238 | 235708 | 675.26 | 1471 | 1479 | 346.9 |
| C | 3 | 233 | 179232 | 512.44 | 1471 | 1479 | 346.9 |
| C | 2 | 16 | 39708 | 110.21 | 1471 | 1479 | 346.9 |
| D | 7 | 80 | 11836734 | 40664.69 | 1214 | 1177 | 291.1 |
| D | 1 | 52 | 1214515 | 4168.8 | 1214 | 1177 | 291.1 |
| D | 8 | 195 | 601233 | 2061.68 | 1214 | 1177 | 291.1 |
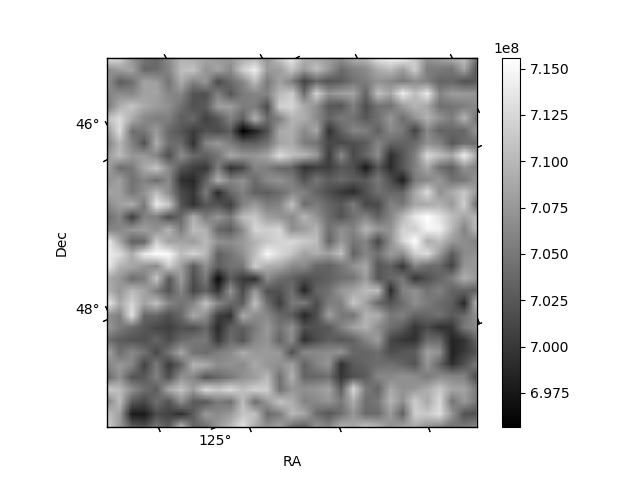
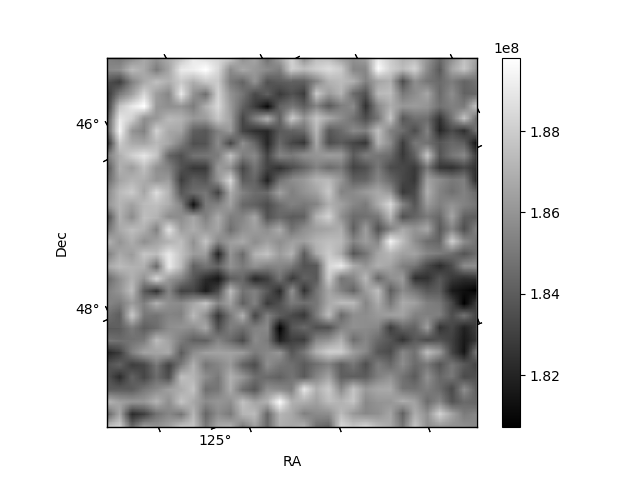
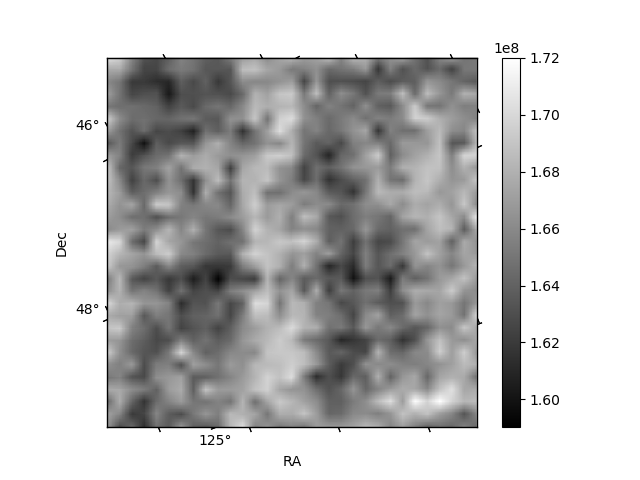
Histogram calculated using DETX and DETY for each event in the final _common_clean file
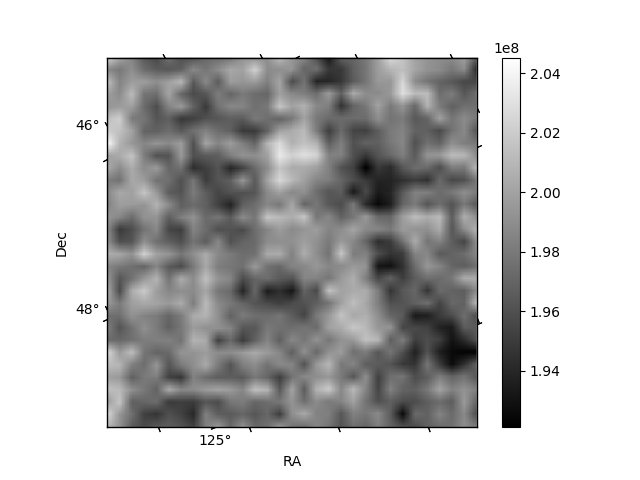
| Quadrant A | 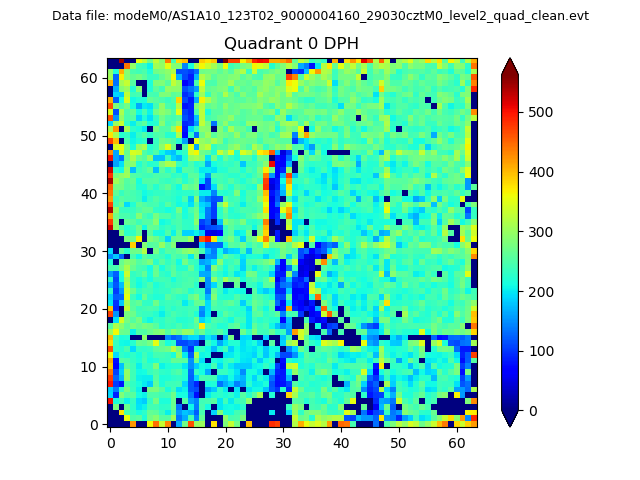 |
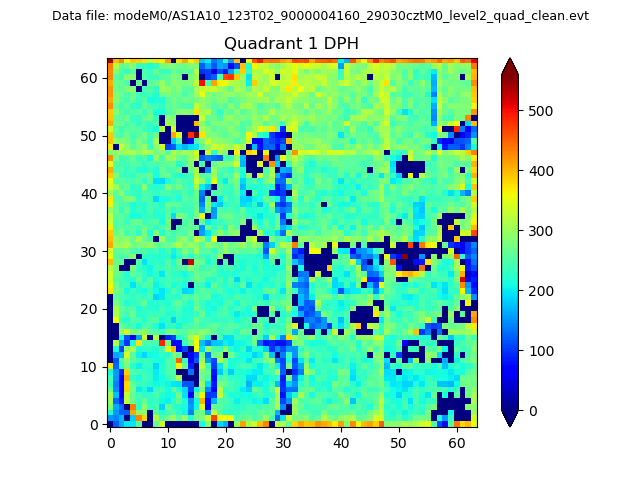 |
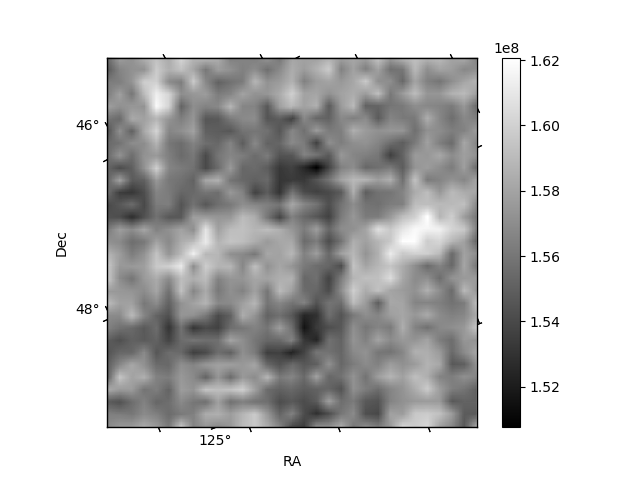
Quadrant B |
|---|---|---|---|
| Quadrant D |  |
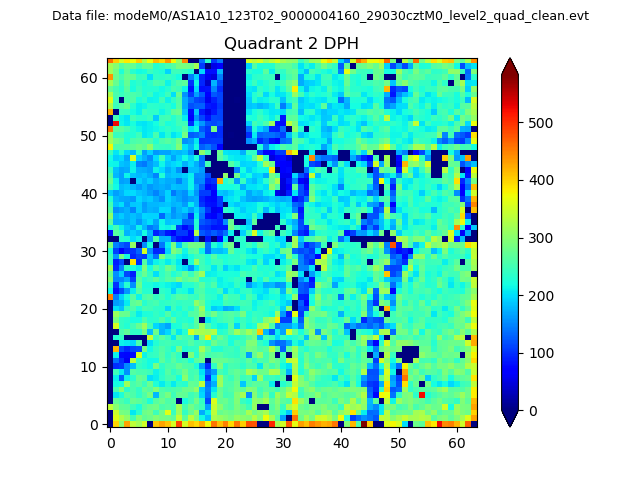 |
Quadrant C |
| Plot type | Count rate plots | Images |
|---|---|---|
| Comparison with Poisson distribution Blue bars denote a histogram of data divided into 1 sec bins. Red curve is a Poisson curve with rate = median count rate of data. |
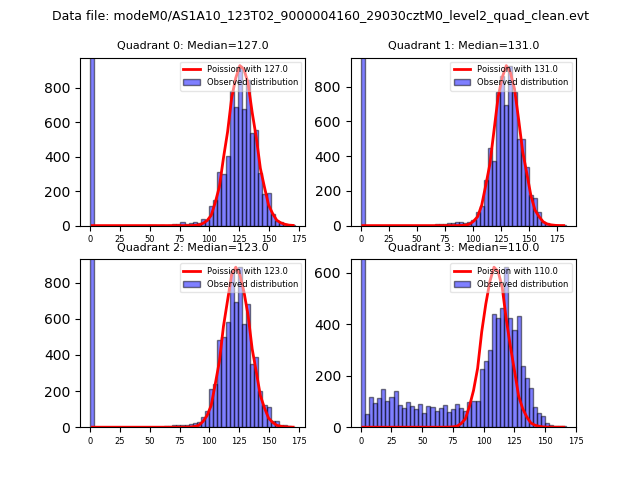 |
 |
| Quadrant-wise count rates Data is divided into 100 sec bins |
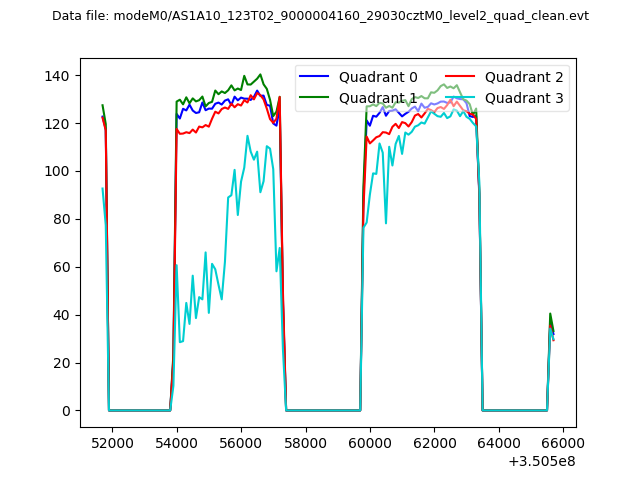 |
|
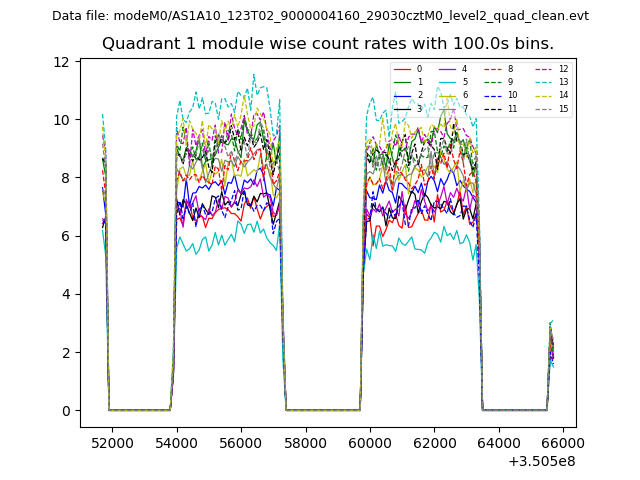
| Module-wise count rates for Quadrant A Data is divided into 100 sec bins |
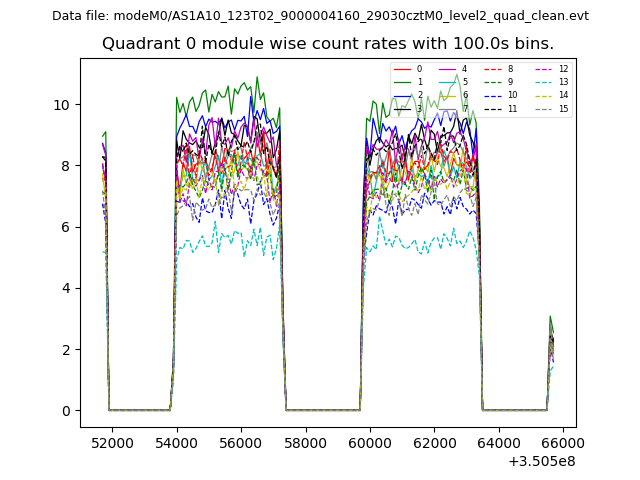 |
 |
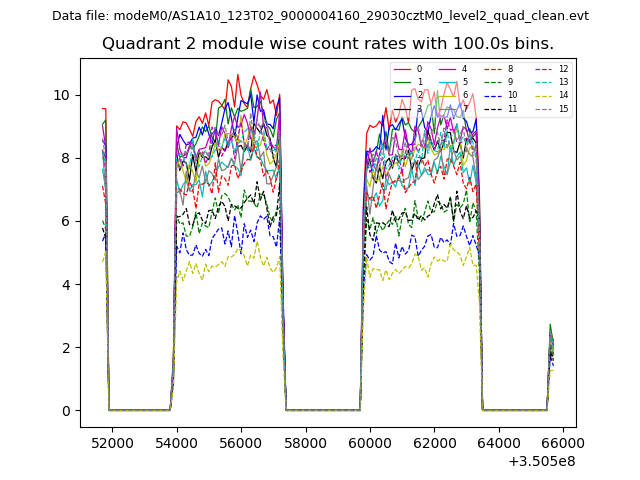
| Module-wise count rates for Quadrant B Data is divided into 100 sec bins |
 |
 |
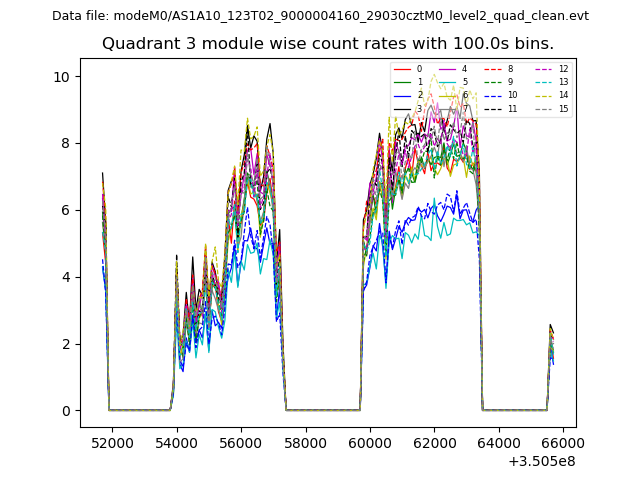
| Module-wise count rates for Quadrant C Data is divided into 100 sec bins |
 |
 |
| Module-wise count rates for Quadrant D Data is divided into 100 sec bins |
 |
 |
| Parameter | Plot |
|---|---|
| CZT HV Monitor |  |
| D_VDD | 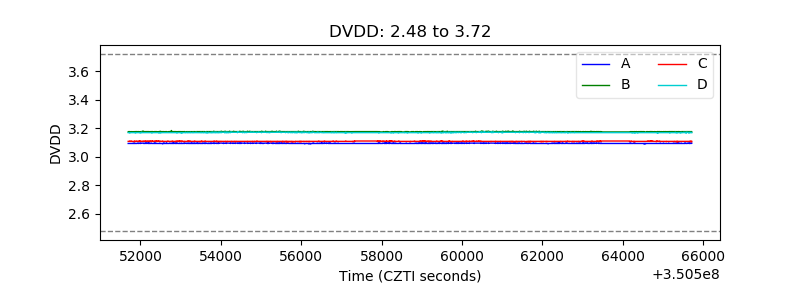 |
| Temperature 1 | 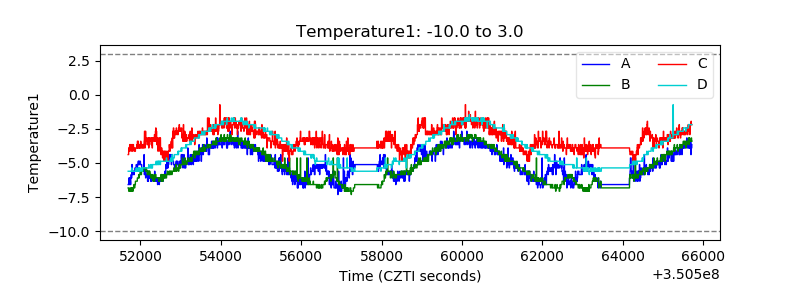 |
| Veto HV Monitor | 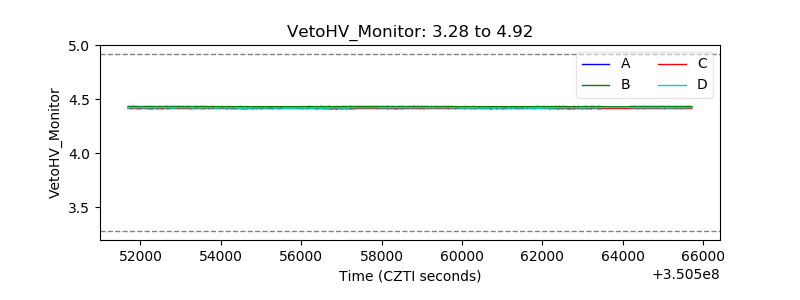 |
| Veto LLD |  |
| Alpha Counter | 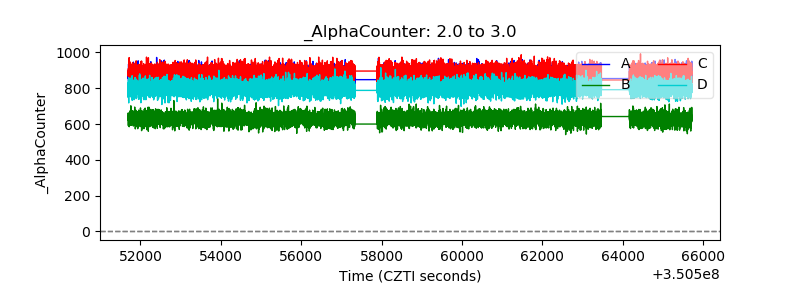 |
| _CPM_Rate | 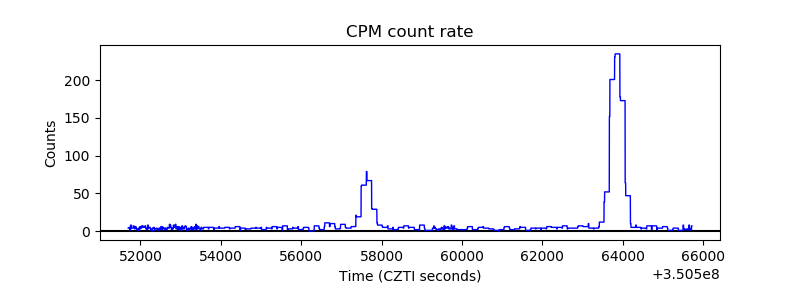 |
| CZT Counter | 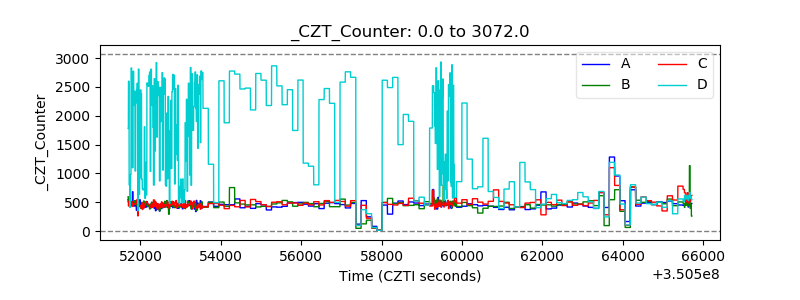 |
| +2.5 Volts monitor |  |
| +5 Volts monitor | 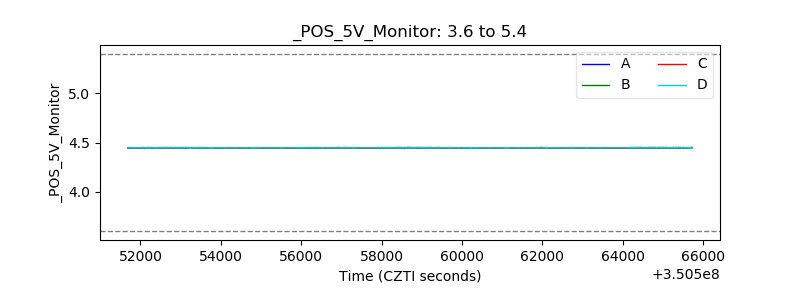 |
| _ROLL_ROT | 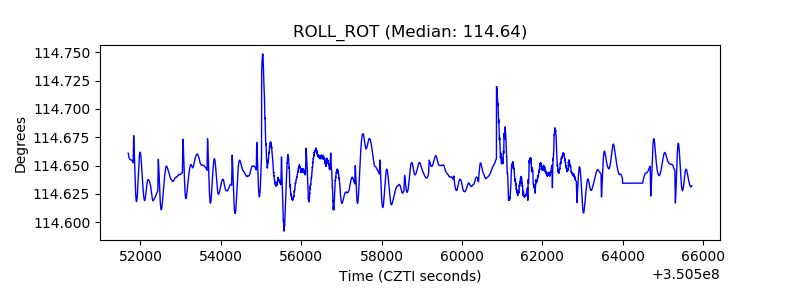 |
| _Roll_DEC | 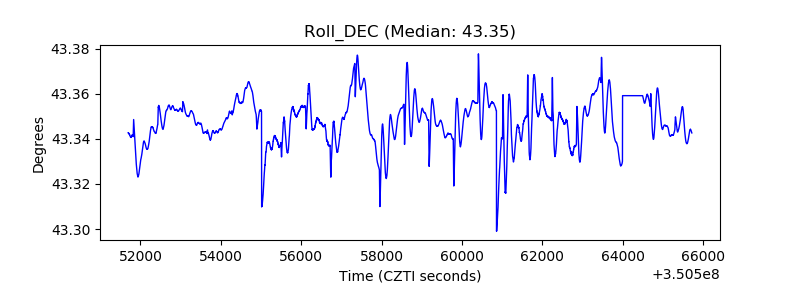 |
| _Roll_RA | 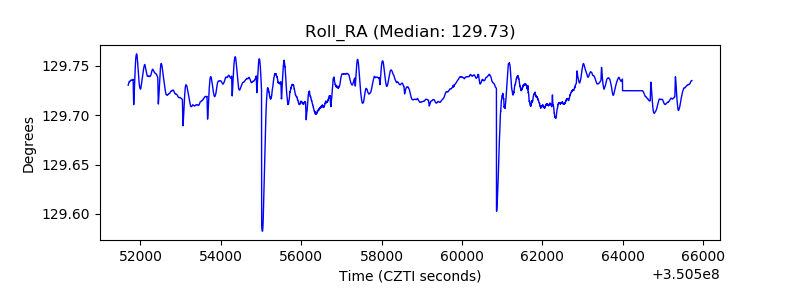 |
| Veto Counter |  |