| Param | Original file | Final file |
|---|---|---|
| Filename | modeM0/AS1A10_123T02_9000004160_29032cztM0_level2.evt | modeM0/AS1A10_123T02_9000004160_29032cztM0_level2_quad_clean.evt |
| Size (bytes) | 545,771,520 | 92,505,600 |
| Size | 520.5 MB | 88.2 MB |
| Events in quadrant A | 3,354,566 | 599,735 |
| Events in quadrant B | 3,422,107 | 614,533 |
| Events in quadrant C | 4,073,122 | 574,057 |
| Events in quadrant D | 5,220,946 | 542,134 |
| Mode M9 | |||
|---|---|---|---|
| Quadrant | BADHDUFLAG | Total packets | Discarded packets |
| A | 0 | 20 | 0 |
| B | 0 | 20 | 0 |
| C | 0 | 20 | 0 |
| D | 0 | 20 | 0 |
| Mode SS | |||
|---|---|---|---|
| Quadrant | BADHDUFLAG | Total packets | Discarded packets |
| A | 0 | 138 | 0 |
| B | 0 | 138 | 0 |
| C | 0 | 138 | 0 |
| D | 0 | 138 | 0 |
| Mode M0 | |||
|---|---|---|---|
| Quadrant | BADHDUFLAG | Total packets | Discarded packets |
| A | 0 | 14442 | 2 |
| B | 0 | 14602 | 2 |
| C | 0 | 16666 | 3 |
| D | 0 | 20106 | 2 |
| Quadrant | Total seconds | Saturated seconds | Saturation percentage |
|---|---|---|---|
| A | 6760 | 93 | 1.375740% |
| B | 6761 | 100 | 1.479071% |
| C | 6760 | 183 | 2.707101% |
| D | 6760 | 411 | 6.079882% |
Noise dominated data is calculated using 1-second bins in cleaned event files. If a bin has >2000 counts, and if more than 50% of those come from <1% of pixels, then it is considered to be noise-dominated and hence unusable.
| Quadrant | # 1 sec bins | Bins with >0 counts | Bins with >2000 counts | High rate bins dominated by noise | Noise dominated (total time) | Noise dominated (detector-on time) | Marked lightcurve |
|---|---|---|---|---|---|---|---|
| A | 8696 | 6762 | 2 | 2 | 0.02% | 0.03% | 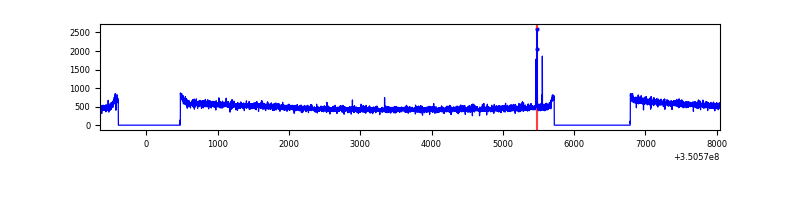 |
| B | 8697 | 6763 | 0 | 0 | 0.00% | 0.00% | 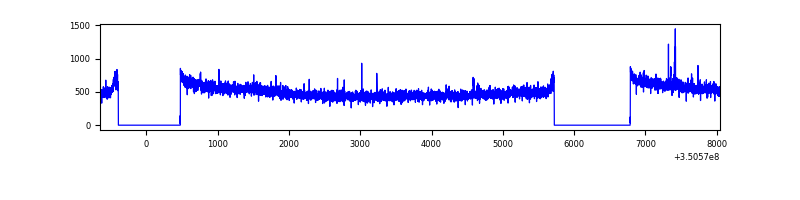 |
| C | 8696 | 6762 | 0 | 0 | 0.00% | 0.00% | 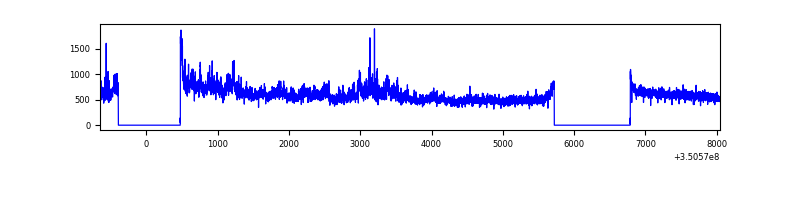 |
| D | 8696 | 6762 | 277 | 277 | 3.19% | 4.10% | 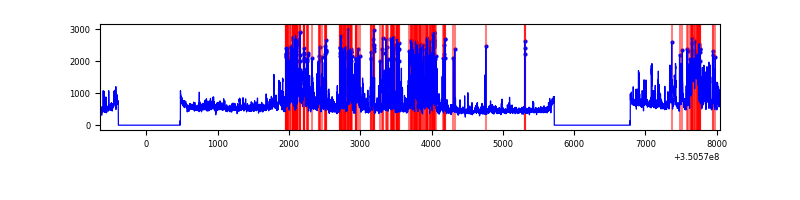 |
Top three noisy pixels from each quadrant. If the there are fewer than three noisy pixels in the level2.evt file, extra rows are filled as -1
| Pixel properties | Quadrant properties | ||||||
|---|---|---|---|---|---|---|---|
| Quadrant | DetID | PixID | Counts | Sigma | Mean | Median | Sigma |
| A | 1 | 113 | 17211 | 94.04 | 865 | 847 | 174.0 |
| A | 13 | 254 | 10062 | 52.96 | 865 | 847 | 174.0 |
| A | 3 | 137 | 8840 | 45.93 | 865 | 847 | 174.0 |
| B | 10 | 245 | 35178 | 210.2 | 858 | 838 | 163.4 |
| B | 12 | 111 | 20305 | 119.16 | 858 | 838 | 163.4 |
| B | 11 | 111 | 18789 | 109.88 | 858 | 838 | 163.4 |
| C | 3 | 233 | 685276 | 3547.68 | 825 | 829 | 192.9 |
| C | 14 | 238 | 132137 | 680.61 | 825 | 829 | 192.9 |
| C | 2 | 16 | 26657 | 133.87 | 825 | 829 | 192.9 |
| D | 1 | 52 | 1388266 | 7099.48 | 822 | 799 | 195.4 |
| D | 7 | 80 | 404328 | 2064.8 | 822 | 799 | 195.4 |
| D | 8 | 195 | 289958 | 1479.59 | 822 | 799 | 195.4 |
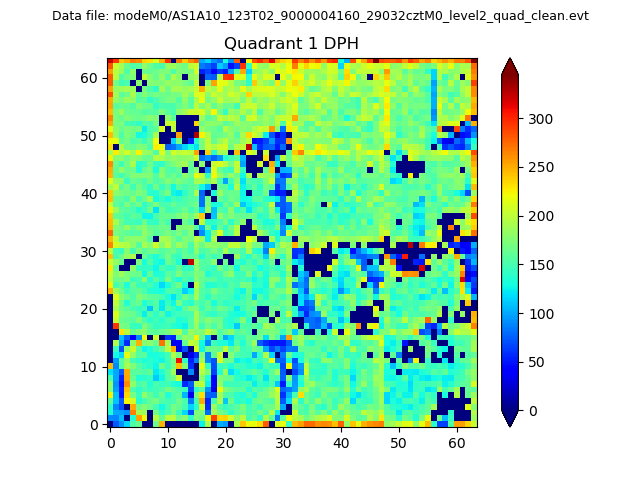
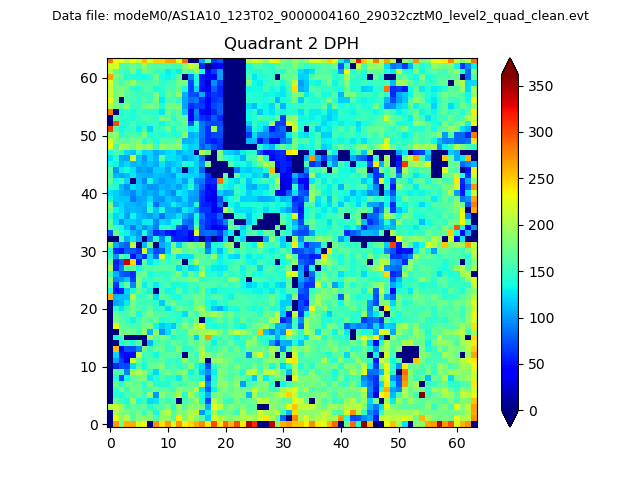
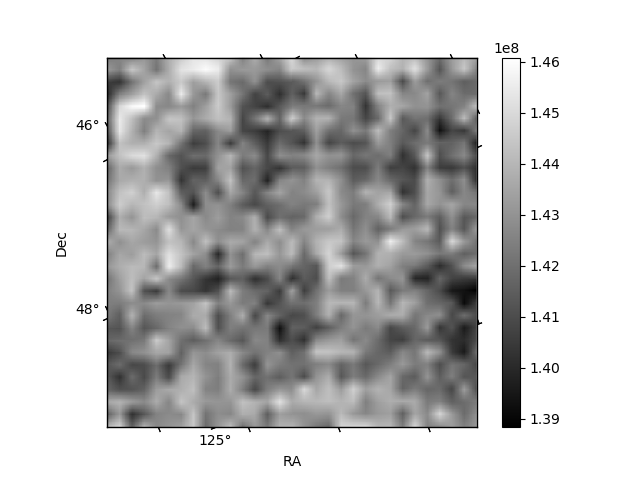
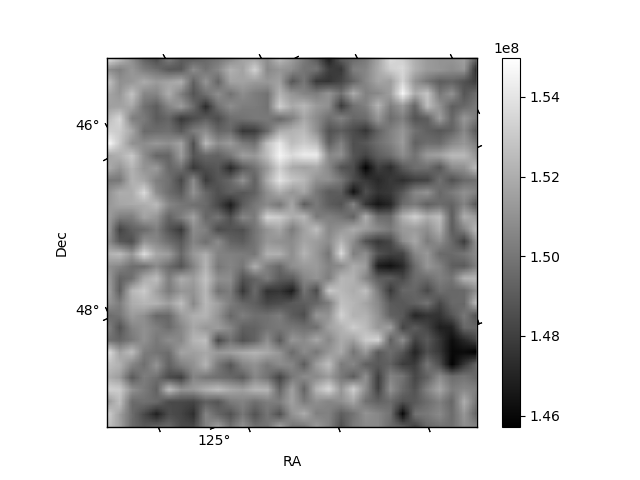
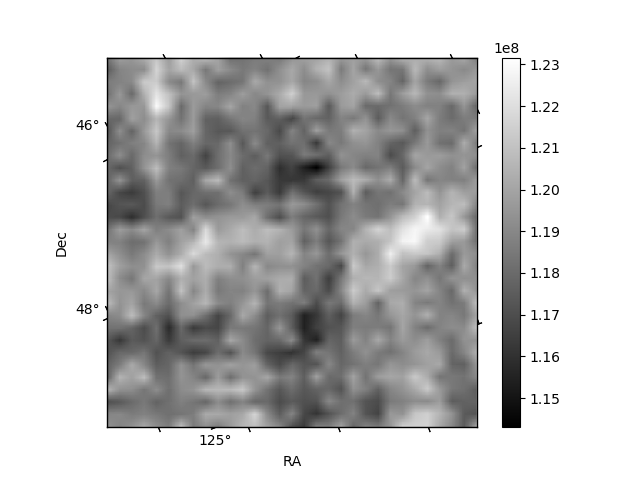
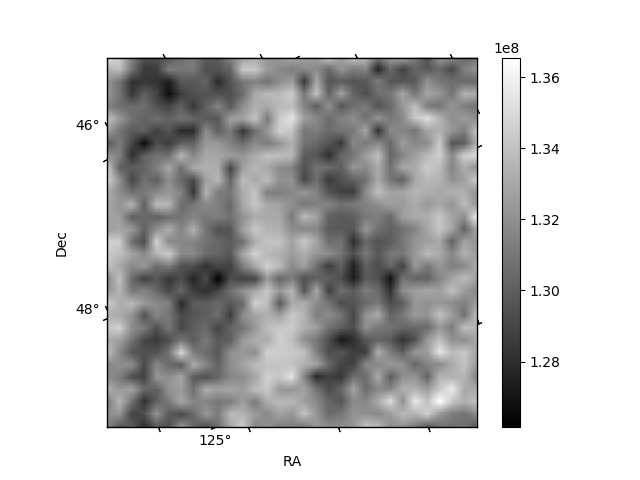
Histogram calculated using DETX and DETY for each event in the final _common_clean file
| Quadrant A |  |
 |
Quadrant B |
|---|---|---|---|
| Quadrant D |  |
 |
Quadrant C |
| Plot type | Count rate plots | Images |
|---|---|---|
| Comparison with Poisson distribution Blue bars denote a histogram of data divided into 1 sec bins. Red curve is a Poisson curve with rate = median count rate of data. |
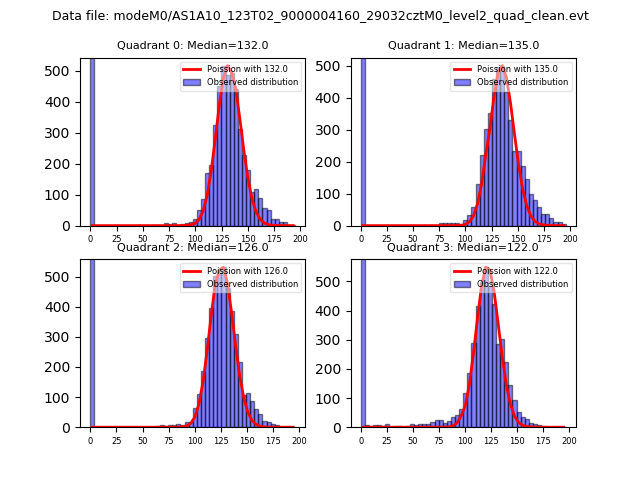 |
 |
| Quadrant-wise count rates Data is divided into 100 sec bins |
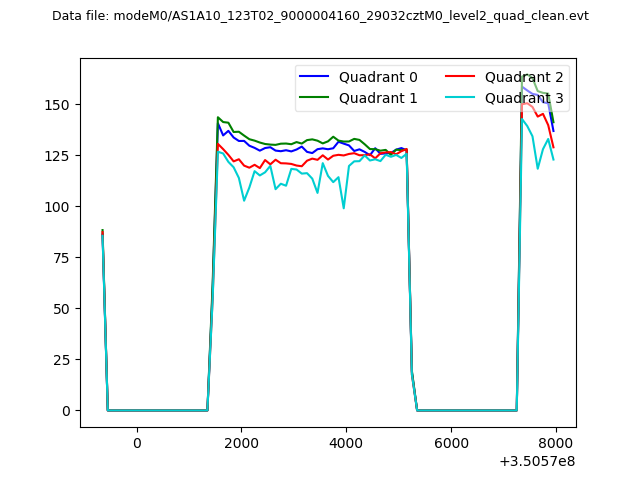 |
|
| Module-wise count rates for Quadrant A Data is divided into 100 sec bins |
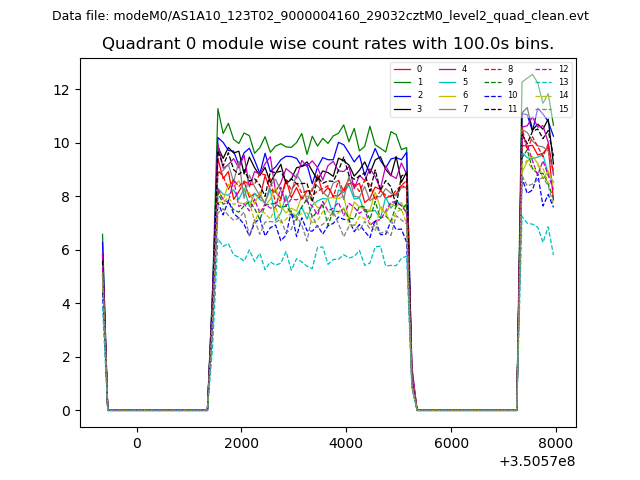 |
 |
| Module-wise count rates for Quadrant B Data is divided into 100 sec bins |
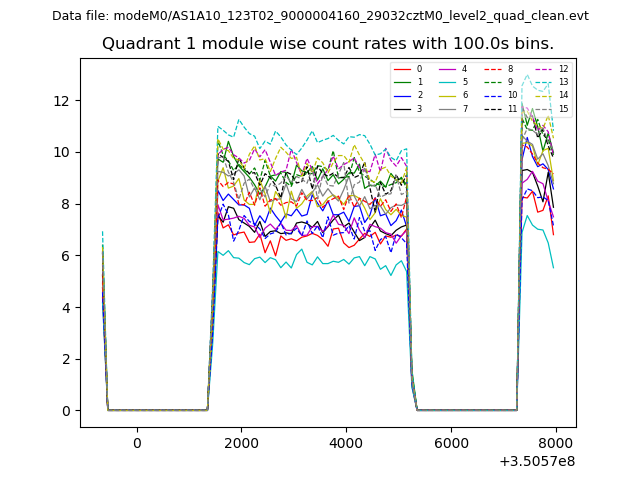 |
 |
| Module-wise count rates for Quadrant C Data is divided into 100 sec bins |
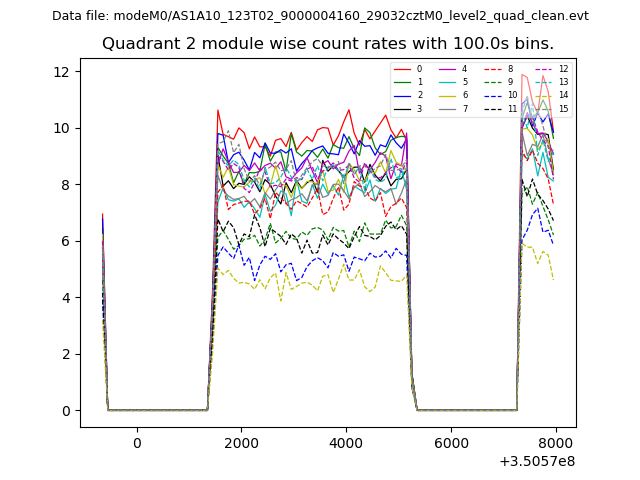 |
 |
| Module-wise count rates for Quadrant D Data is divided into 100 sec bins |
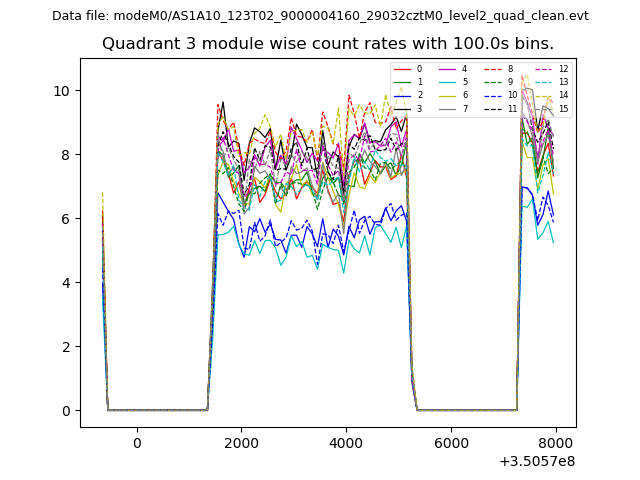 |
 |
| Parameter | Plot |
|---|---|
| CZT HV Monitor | 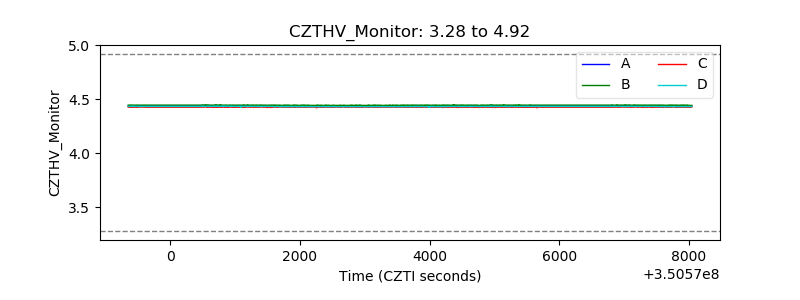 |
| D_VDD | 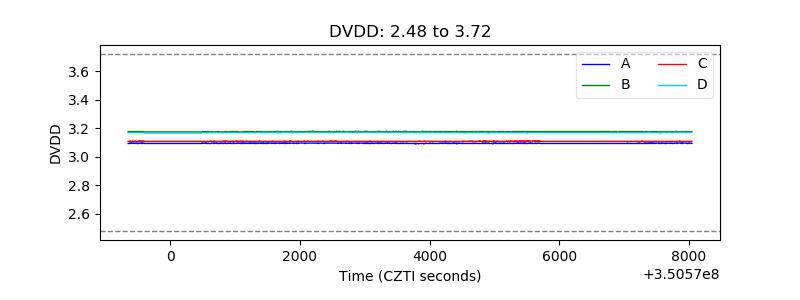 |
| Temperature 1 | 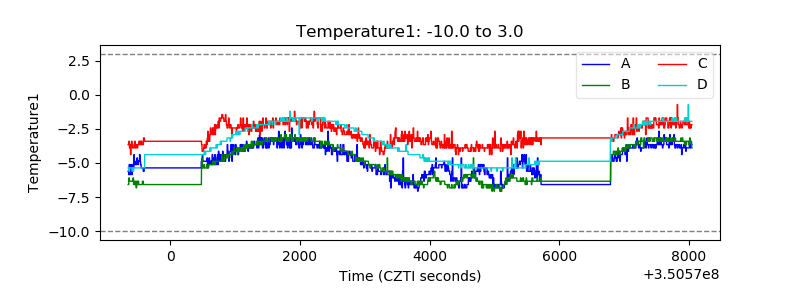 |
| Veto HV Monitor | 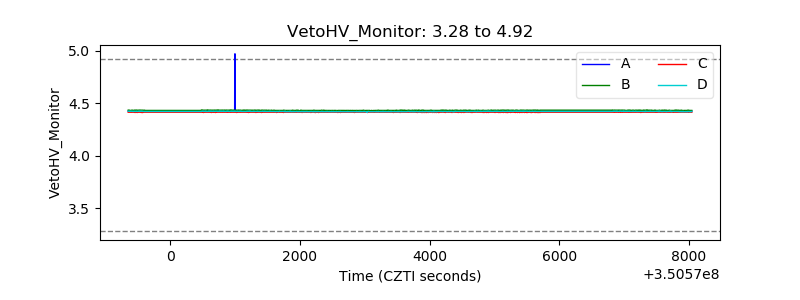 |
| Veto LLD | 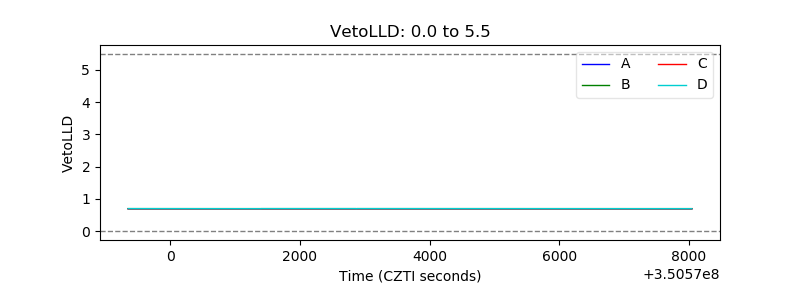 |
| Alpha Counter | 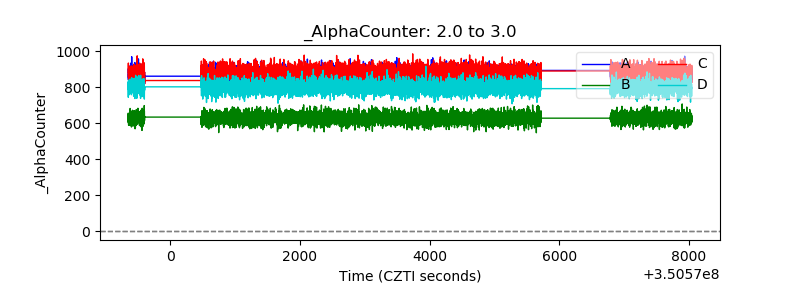 |
| _CPM_Rate | 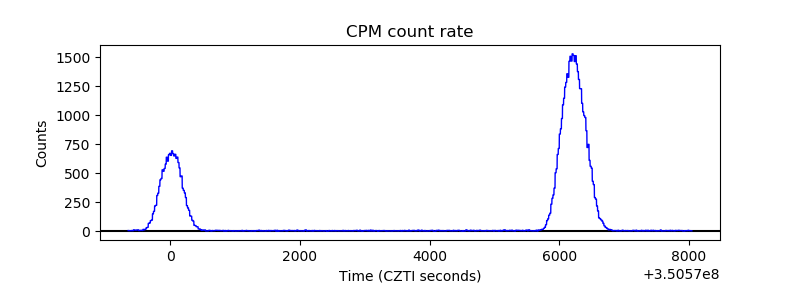 |
| CZT Counter | 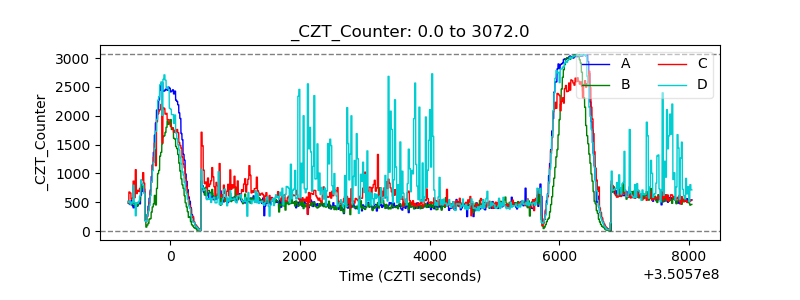 |
| +2.5 Volts monitor |  |
| +5 Volts monitor |  |
| _ROLL_ROT | 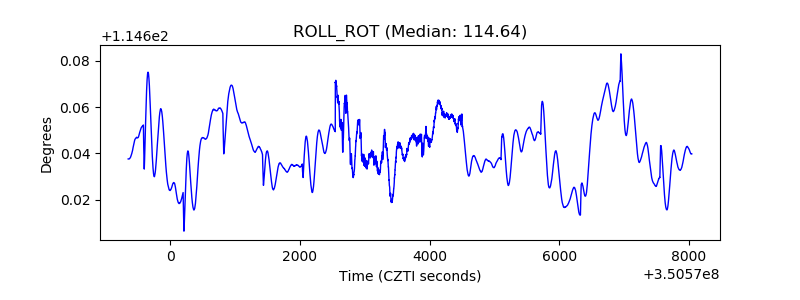 |
| _Roll_DEC | 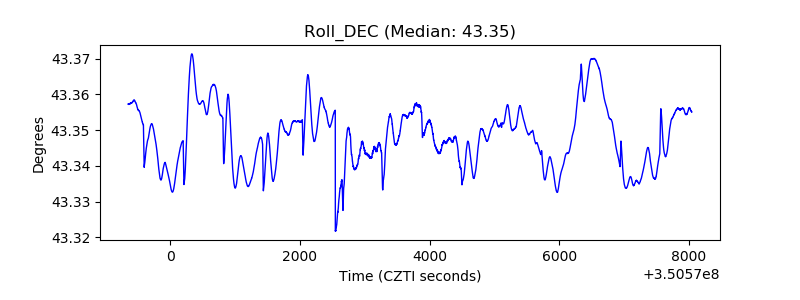 |
| _Roll_RA | 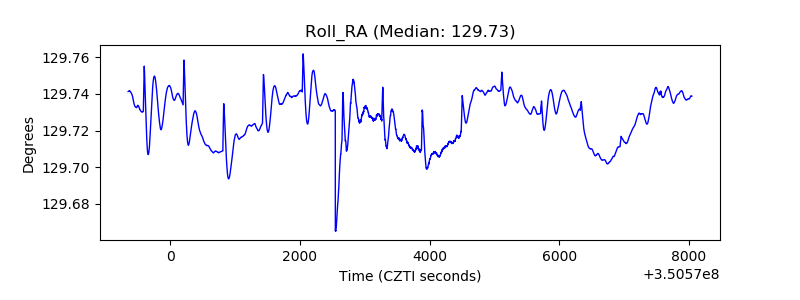 |
| Veto Counter |  |