| Param | Original file | Final file |
|---|---|---|
| Filename | modeM0/AS1A10_123T02_9000004160_29034cztM0_level2.evt | modeM0/AS1A10_123T02_9000004160_29034cztM0_level2_quad_clean.evt |
| Size (bytes) | 539,907,840 | 107,974,080 |
| Size | 514.9 MB | 103.0 MB |
| Events in quadrant A | 3,288,388 | 725,748 |
| Events in quadrant B | 3,357,891 | 745,068 |
| Events in quadrant C | 4,352,047 | 692,651 |
| Events in quadrant D | 4,917,351 | 658,153 |
| Mode M9 | |||
|---|---|---|---|
| Quadrant | BADHDUFLAG | Total packets | Discarded packets |
| A | 0 | 11 | 0 |
| B | 0 | 11 | 0 |
| C | 0 | 11 | 0 |
| D | 0 | 11 | 0 |
| Mode SS | |||
|---|---|---|---|
| Quadrant | BADHDUFLAG | Total packets | Discarded packets |
| A | 0 | 132 | 0 |
| B | 0 | 132 | 0 |
| C | 0 | 132 | 0 |
| D | 0 | 132 | 0 |
| Mode M0 | |||
|---|---|---|---|
| Quadrant | BADHDUFLAG | Total packets | Discarded packets |
| A | 0 | 14127 | 2 |
| B | 0 | 14284 | 2 |
| C | 0 | 17139 | 2 |
| D | 0 | 19172 | 2 |
| Quadrant | Total seconds | Saturated seconds | Saturation percentage |
|---|---|---|---|
| A | 6420 | 64 | 0.996885% |
| B | 6421 | 78 | 1.214764% |
| C | 6420 | 292 | 4.548287% |
| D | 6420 | 409 | 6.370717% |
Noise dominated data is calculated using 1-second bins in cleaned event files. If a bin has >2000 counts, and if more than 50% of those come from <1% of pixels, then it is considered to be noise-dominated and hence unusable.
| Quadrant | # 1 sec bins | Bins with >0 counts | Bins with >2000 counts | High rate bins dominated by noise | Noise dominated (total time) | Noise dominated (detector-on time) | Marked lightcurve |
|---|---|---|---|---|---|---|---|
| A | 7570 | 6421 | 0 | 0 | 0.00% | 0.00% | 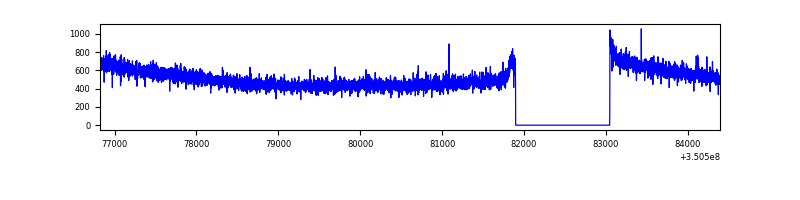 |
| B | 7571 | 6422 | 0 | 0 | 0.00% | 0.00% | 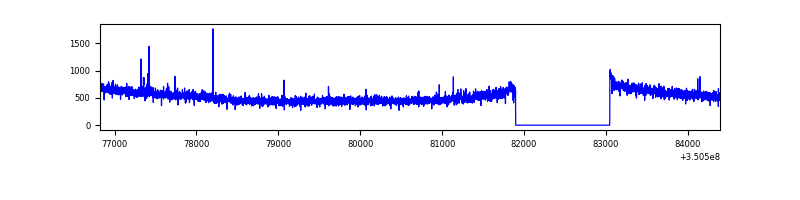 |
| C | 7570 | 6421 | 10 | 10 | 0.13% | 0.16% | 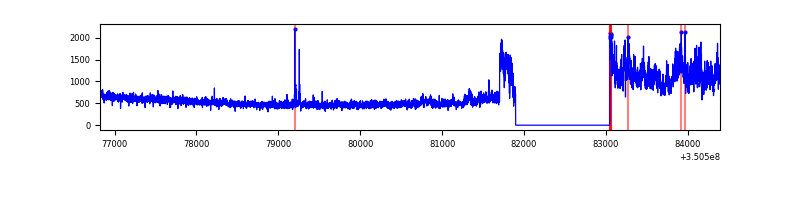 |
| D | 7570 | 6421 | 173 | 173 | 2.29% | 2.69% | 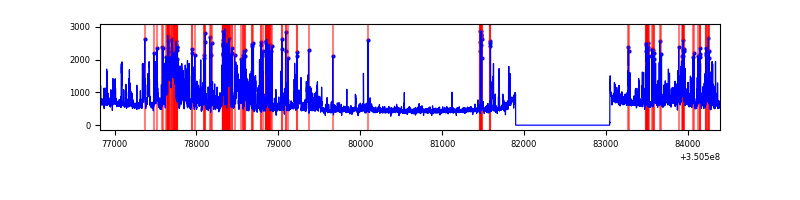 |
Top three noisy pixels from each quadrant. If the there are fewer than three noisy pixels in the level2.evt file, extra rows are filled as -1
| Pixel properties | Quadrant properties | ||||||
|---|---|---|---|---|---|---|---|
| Quadrant | DetID | PixID | Counts | Sigma | Mean | Median | Sigma |
| A | 13 | 254 | 9885 | 53.66 | 851 | 836 | 168.6 |
| A | 3 | 137 | 8098 | 43.06 | 851 | 836 | 168.6 |
| A | 0 | 226 | 7204 | 37.76 | 851 | 836 | 168.6 |
| B | 10 | 245 | 48545 | 305.32 | 840 | 822 | 156.3 |
| B | 12 | 111 | 19163 | 117.34 | 840 | 822 | 156.3 |
| B | 11 | 111 | 17622 | 107.48 | 840 | 822 | 156.3 |
| C | 3 | 233 | 1030730 | 5467.95 | 812 | 818 | 188.4 |
| C | 14 | 238 | 129555 | 683.48 | 812 | 818 | 188.4 |
| C | 2 | 114 | 15090 | 75.77 | 812 | 818 | 188.4 |
| D | 1 | 52 | 1489062 | 7916.39 | 807 | 787 | 188.0 |
| D | 8 | 195 | 250880 | 1330.29 | 807 | 787 | 188.0 |
| D | 7 | 80 | 74821 | 393.8 | 807 | 787 | 188.0 |
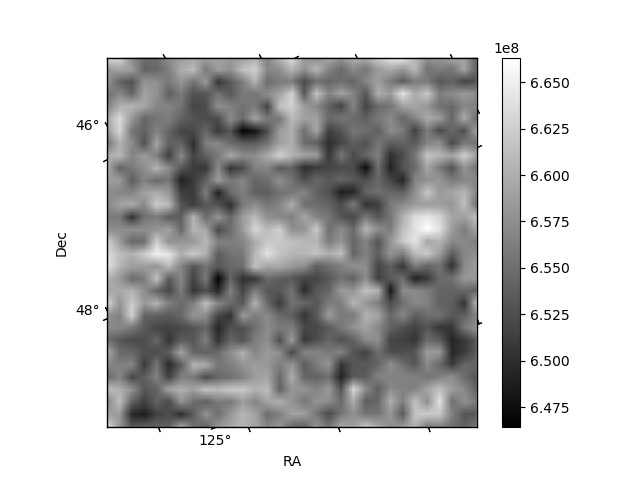
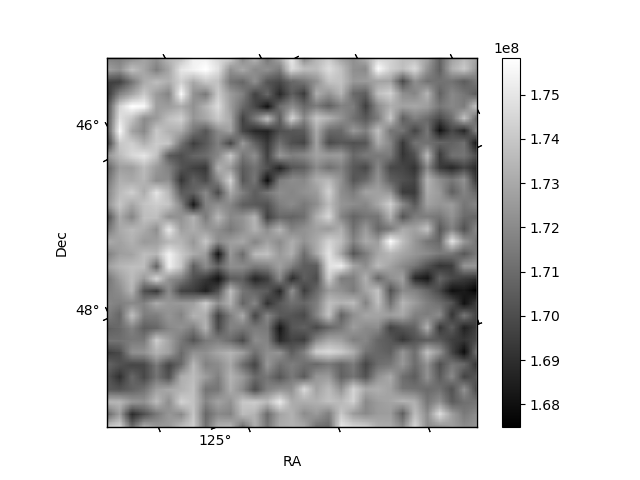
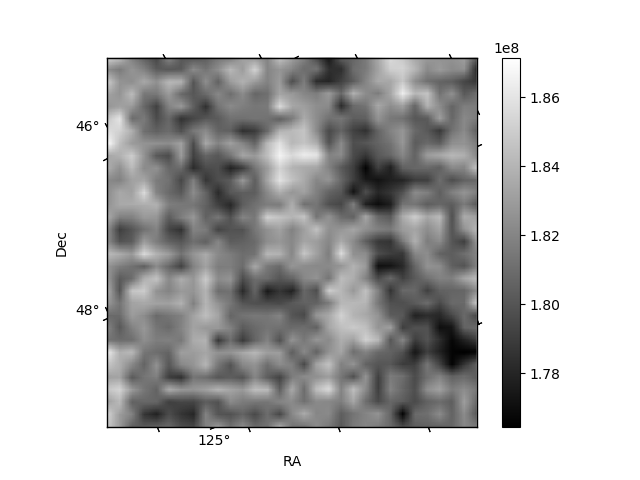
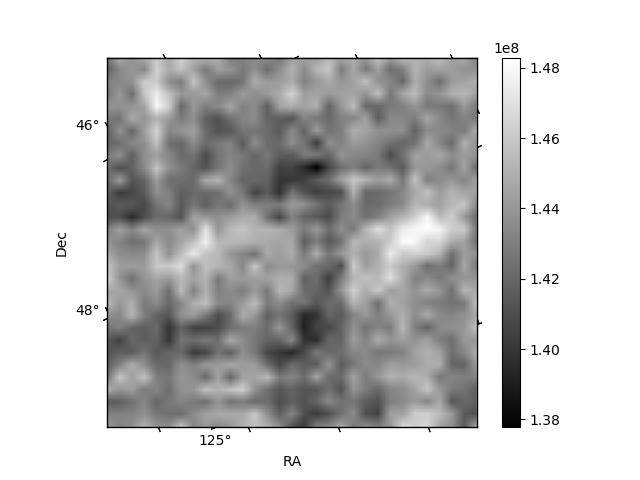
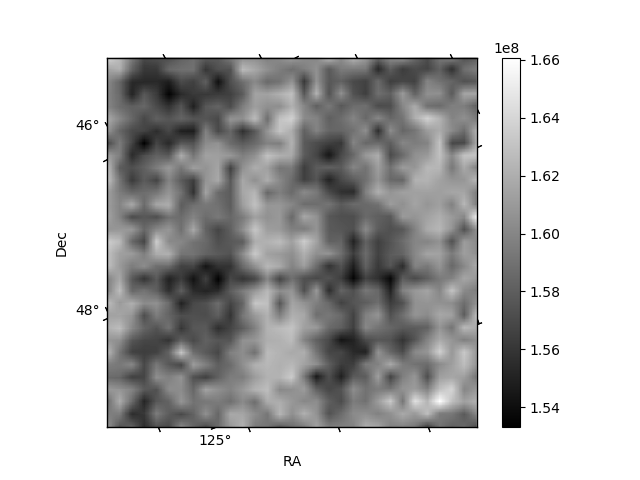
Histogram calculated using DETX and DETY for each event in the final _common_clean file
| Quadrant A | 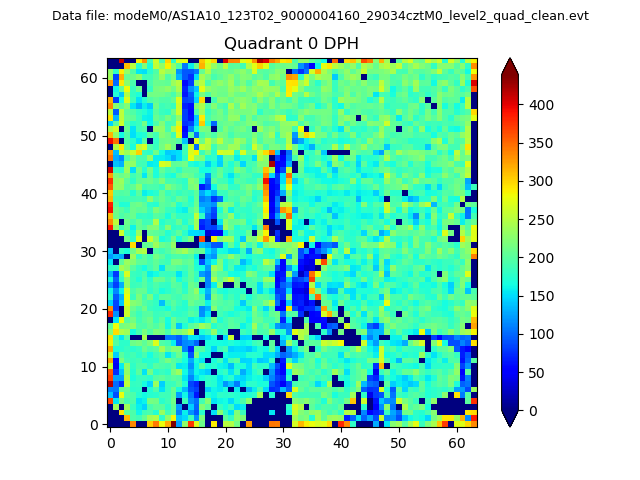 |
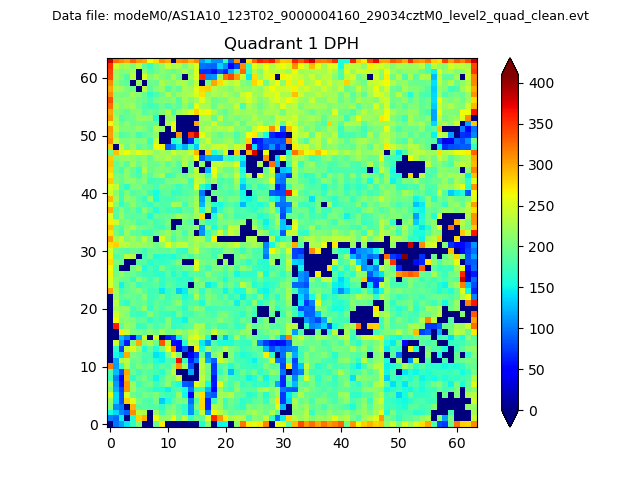 |
Quadrant B |
|---|---|---|---|
| Quadrant D | 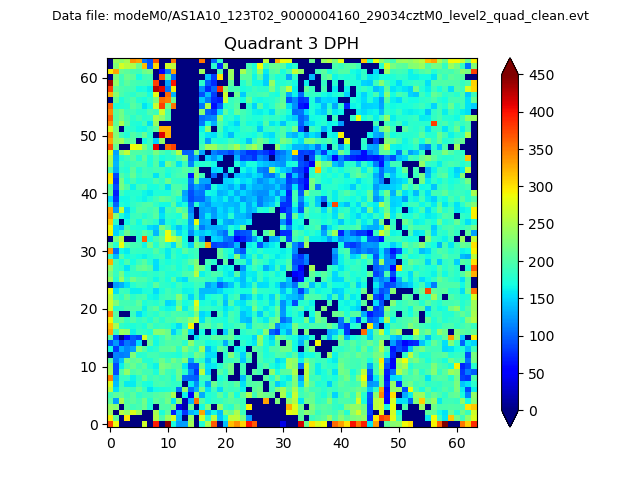 |
 |
Quadrant C |
| Plot type | Count rate plots | Images |
|---|---|---|
| Comparison with Poisson distribution Blue bars denote a histogram of data divided into 1 sec bins. Red curve is a Poisson curve with rate = median count rate of data. |
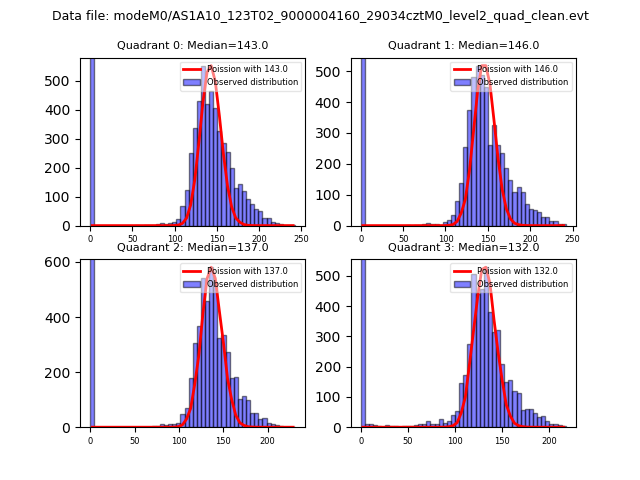 |
 |
| Quadrant-wise count rates Data is divided into 100 sec bins |
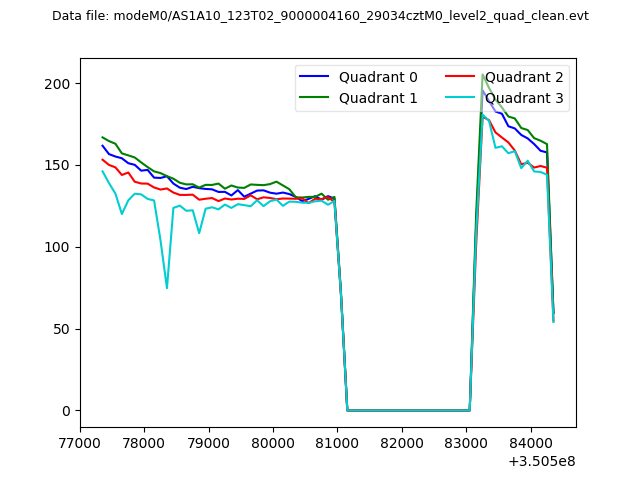 |
|
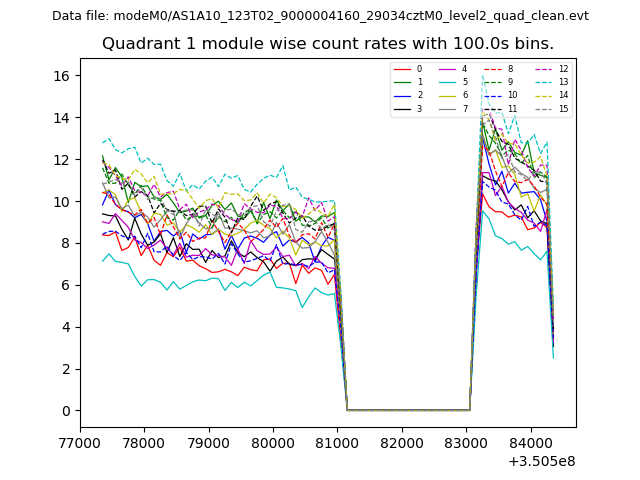
| Module-wise count rates for Quadrant A Data is divided into 100 sec bins |
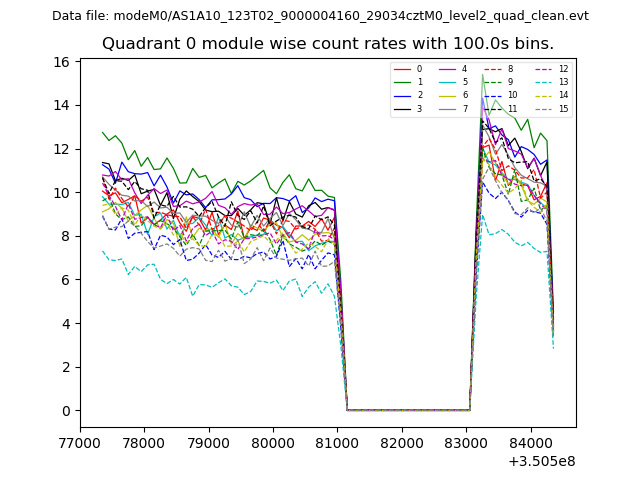 |
 |
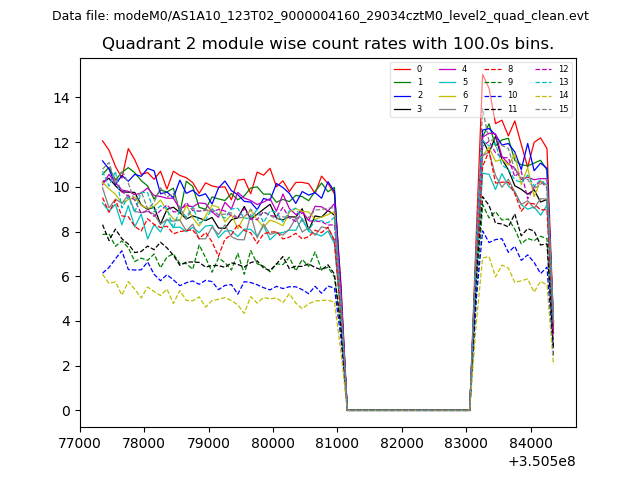
| Module-wise count rates for Quadrant B Data is divided into 100 sec bins |
 |
 |
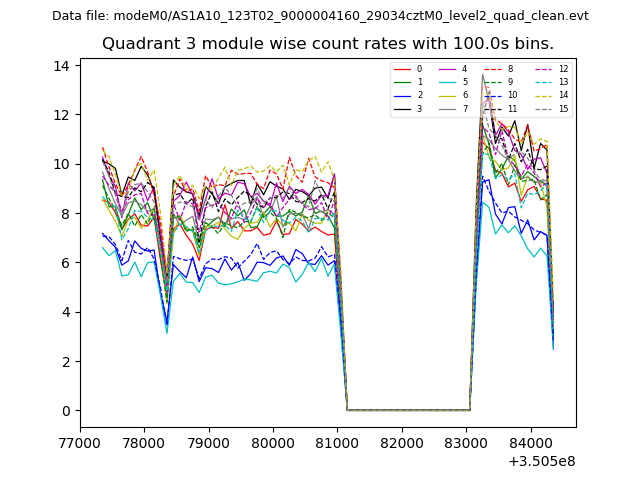
| Module-wise count rates for Quadrant C Data is divided into 100 sec bins |
 |
 |
| Module-wise count rates for Quadrant D Data is divided into 100 sec bins |
 |
 |
| Parameter | Plot |
|---|---|
| CZT HV Monitor | 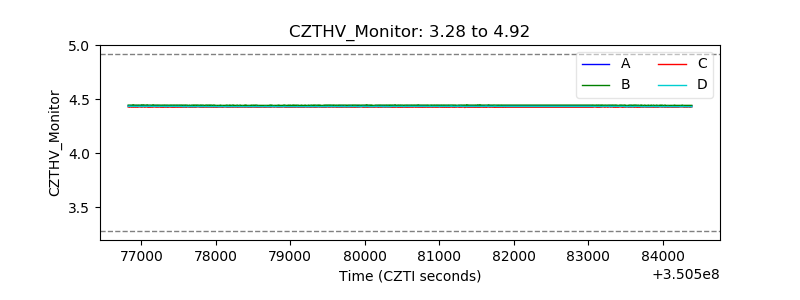 |
| D_VDD | 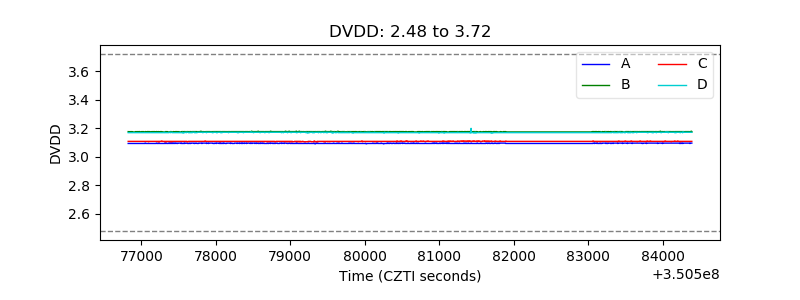 |
| Temperature 1 | 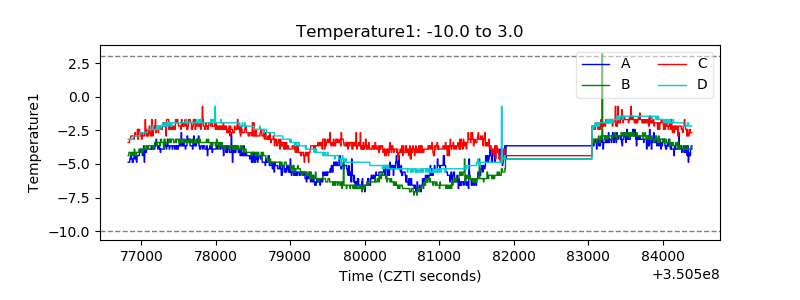 |
| Veto HV Monitor | 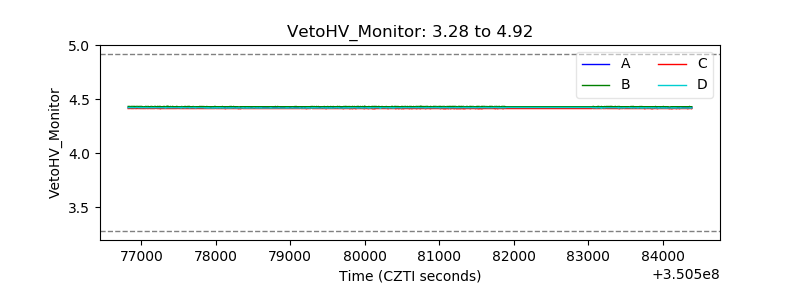 |
| Veto LLD | 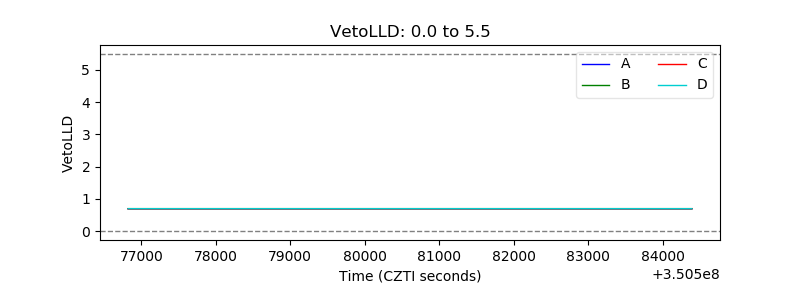 |
| Alpha Counter | 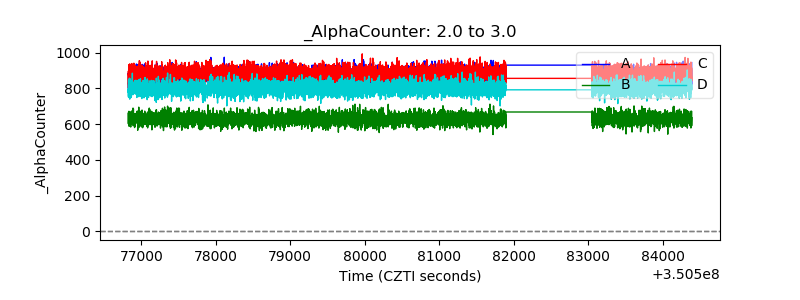 |
| _CPM_Rate | 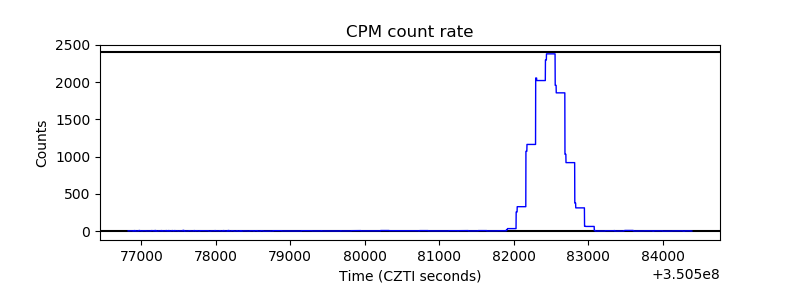 |
| CZT Counter | 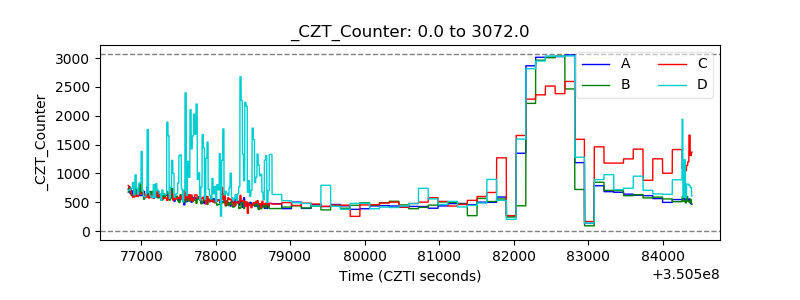 |
| +2.5 Volts monitor |  |
| +5 Volts monitor |  |
| _ROLL_ROT | 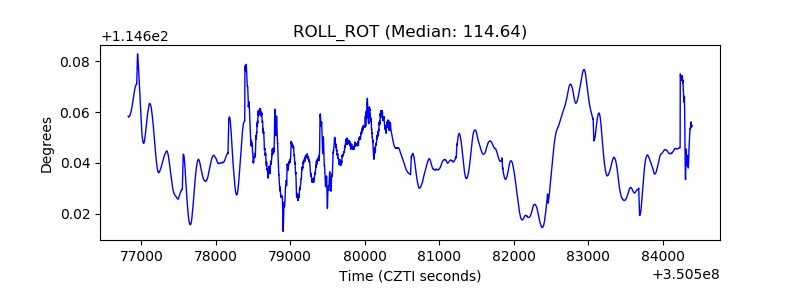 |
| _Roll_DEC | 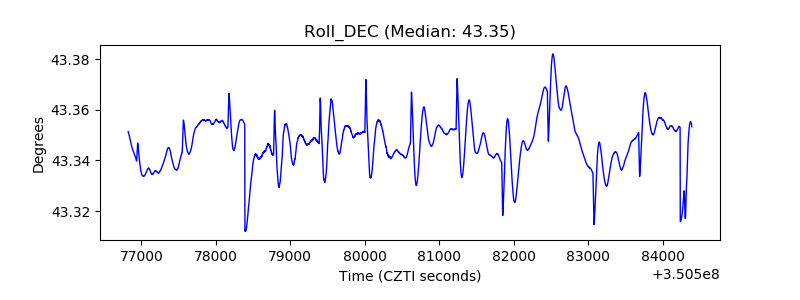 |
| _Roll_RA | 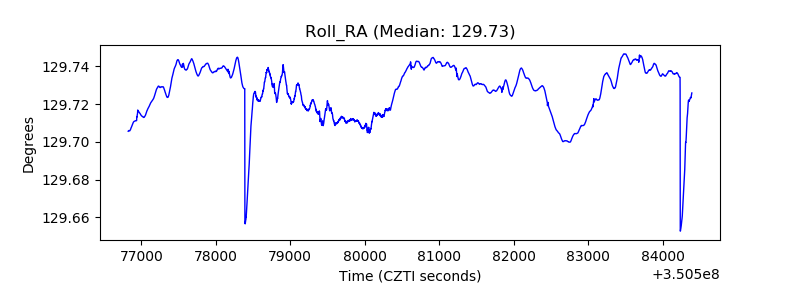 |
| Veto Counter | 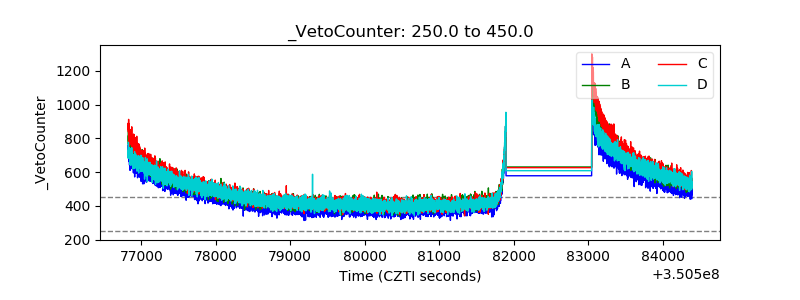 |