| Param | Original file | Final file |
|---|---|---|
| Filename | modeM0/AS1A10_123T02_9000004160_29039cztM0_level2.evt | modeM0/AS1A10_123T02_9000004160_29039cztM0_level2_quad_clean.evt |
| Size (bytes) | 493,562,880 | 85,855,680 |
| Size | 470.7 MB | 81.9 MB |
| Events in quadrant A | 2,900,107 | 559,745 |
| Events in quadrant B | 2,970,036 | 581,203 |
| Events in quadrant C | 3,828,521 | 537,799 |
| Events in quadrant D | 4,838,449 | 498,549 |
| Mode M9 | |||
|---|---|---|---|
| Quadrant | BADHDUFLAG | Total packets | Discarded packets |
| A | 0 | 13 | 0 |
| B | 0 | 14 | 0 |
| C | 0 | 14 | 0 |
| D | 0 | 14 | 0 |
| Mode SS | |||
|---|---|---|---|
| Quadrant | BADHDUFLAG | Total packets | Discarded packets |
| A | 0 | 124 | 0 |
| B | 0 | 124 | 0 |
| C | 0 | 124 | 0 |
| D | 0 | 124 | 0 |
| Mode M0 | |||
|---|---|---|---|
| Quadrant | BADHDUFLAG | Total packets | Discarded packets |
| A | 0 | 12554 | 2 |
| B | 0 | 12665 | 2 |
| C | 0 | 15378 | 2 |
| D | 0 | 18397 | 2 |
| Quadrant | Total seconds | Saturated seconds | Saturation percentage |
|---|---|---|---|
| A | 6047 | 27 | 0.446502% |
| B | 6047 | 52 | 0.859931% |
| C | 6047 | 134 | 2.215975% |
| D | 6047 | 406 | 6.714073% |
Noise dominated data is calculated using 1-second bins in cleaned event files. If a bin has >2000 counts, and if more than 50% of those come from <1% of pixels, then it is considered to be noise-dominated and hence unusable.
| Quadrant | # 1 sec bins | Bins with >0 counts | Bins with >2000 counts | High rate bins dominated by noise | Noise dominated (total time) | Noise dominated (detector-on time) | Marked lightcurve |
|---|---|---|---|---|---|---|---|
| A | 7022 | 6047 | 0 | 0 | 0.00% | 0.00% |  |
| B | 7022 | 6047 | 0 | 0 | 0.00% | 0.00% | 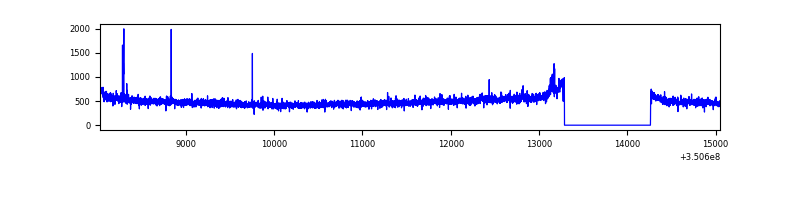 |
| C | 7022 | 6048 | 11 | 11 | 0.16% | 0.18% | 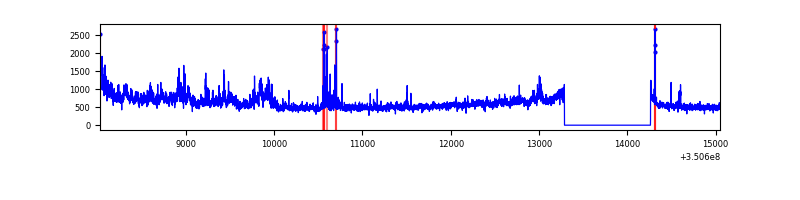 |
| D | 7022 | 6047 | 396 | 396 | 5.64% | 6.55% | 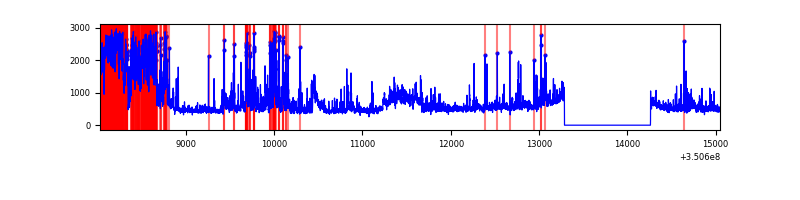 |
Top three noisy pixels from each quadrant. If the there are fewer than three noisy pixels in the level2.evt file, extra rows are filled as -1
| Pixel properties | Quadrant properties | ||||||
|---|---|---|---|---|---|---|---|
| Quadrant | DetID | PixID | Counts | Sigma | Mean | Median | Sigma |
| A | 1 | 113 | 17244 | 110.51 | 747 | 732 | 149.4 |
| A | 13 | 254 | 9679 | 59.88 | 747 | 732 | 149.4 |
| A | 3 | 137 | 7258 | 43.68 | 747 | 732 | 149.4 |
| B | 12 | 111 | 17524 | 118.27 | 749 | 729 | 142.0 |
| B | 11 | 111 | 16144 | 108.55 | 749 | 729 | 142.0 |
| B | 14 | 111 | 15311 | 102.68 | 749 | 729 | 142.0 |
| C | 3 | 233 | 810185 | 4763.38 | 723 | 727 | 169.9 |
| C | 14 | 238 | 116622 | 682.0 | 723 | 727 | 169.9 |
| C | 2 | 16 | 72705 | 423.57 | 723 | 727 | 169.9 |
| D | 1 | 52 | 1784300 | 10669.94 | 704 | 686 | 167.2 |
| D | 8 | 195 | 382766 | 2285.68 | 704 | 686 | 167.2 |
| D | 2 | 234 | 19928 | 115.11 | 704 | 686 | 167.2 |
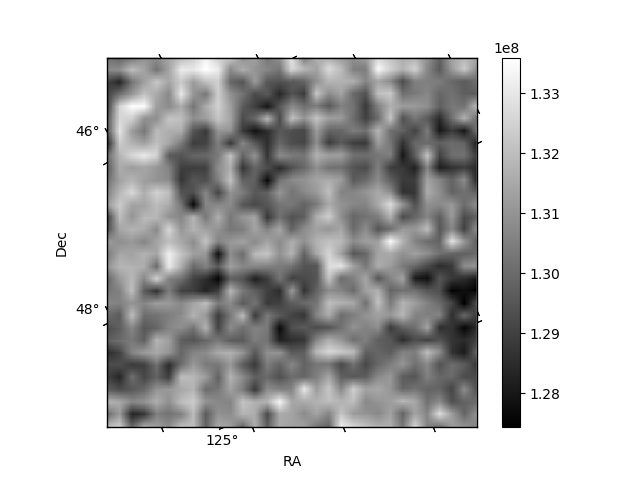
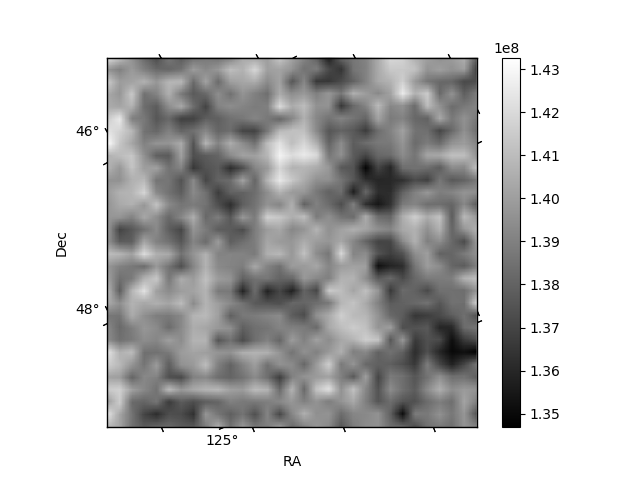
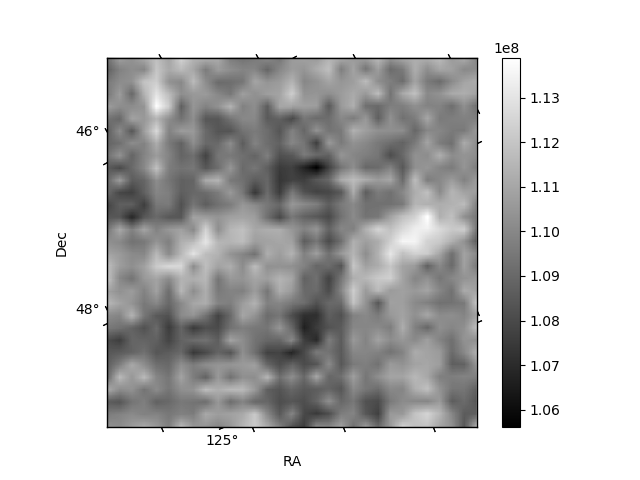
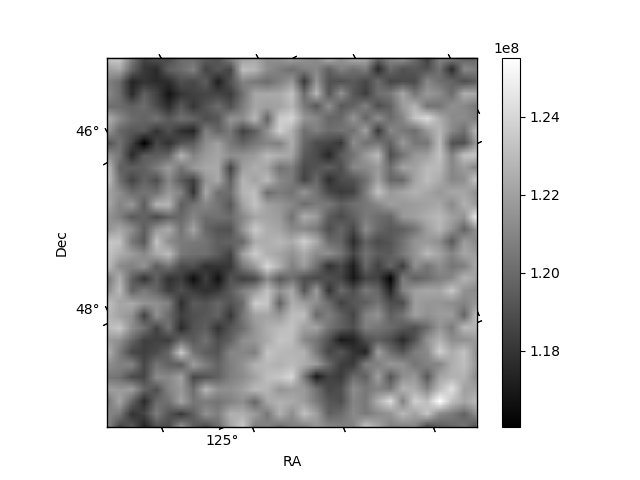
Histogram calculated using DETX and DETY for each event in the final _common_clean file
| Quadrant A | 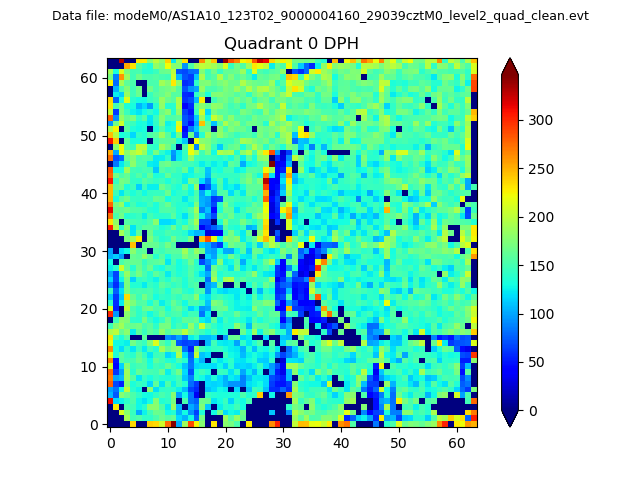 |
 |
Quadrant B |
|---|---|---|---|
| Quadrant D | 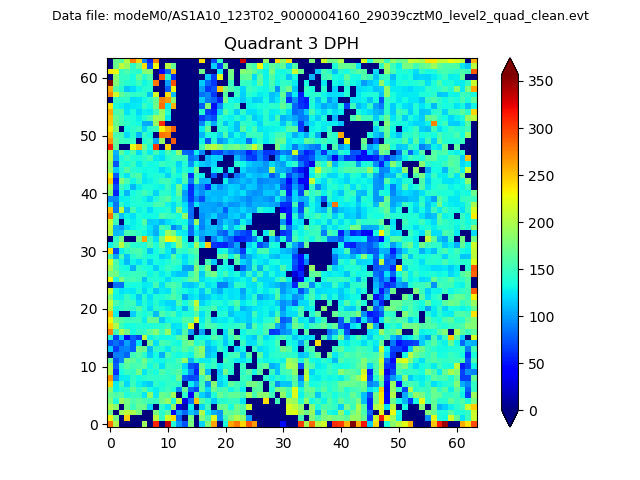 |
 |
Quadrant C |
| Plot type | Count rate plots | Images |
|---|---|---|
| Comparison with Poisson distribution Blue bars denote a histogram of data divided into 1 sec bins. Red curve is a Poisson curve with rate = median count rate of data. |
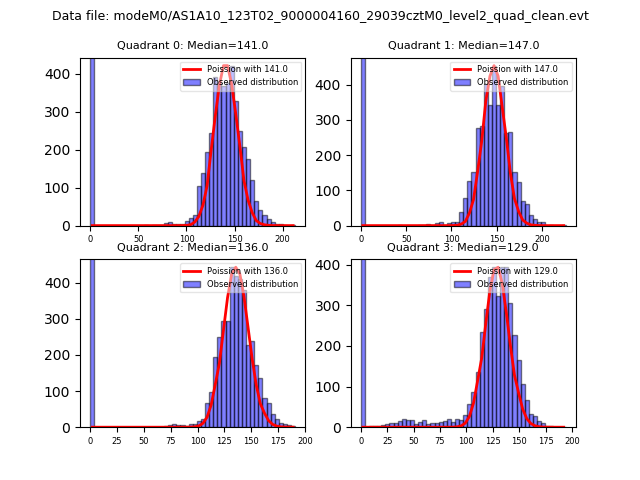 |
 |
| Quadrant-wise count rates Data is divided into 100 sec bins |
 |
|
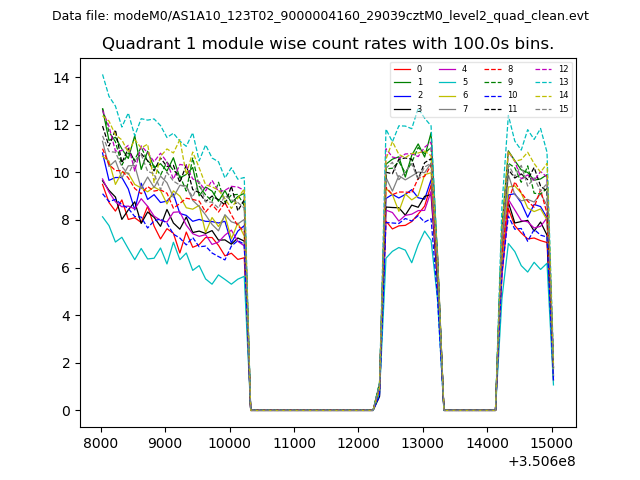
| Module-wise count rates for Quadrant A Data is divided into 100 sec bins |
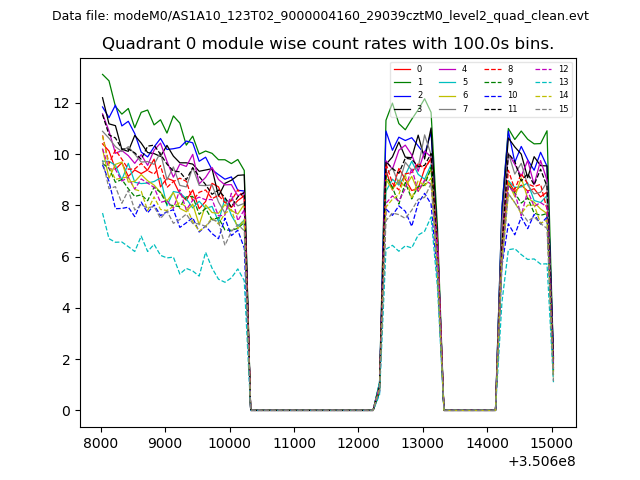 |
 |
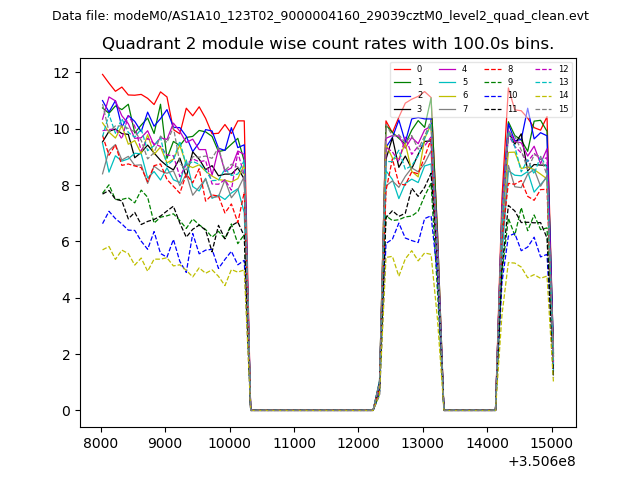
| Module-wise count rates for Quadrant B Data is divided into 100 sec bins |
 |
 |
| Module-wise count rates for Quadrant C Data is divided into 100 sec bins |
 |
 |
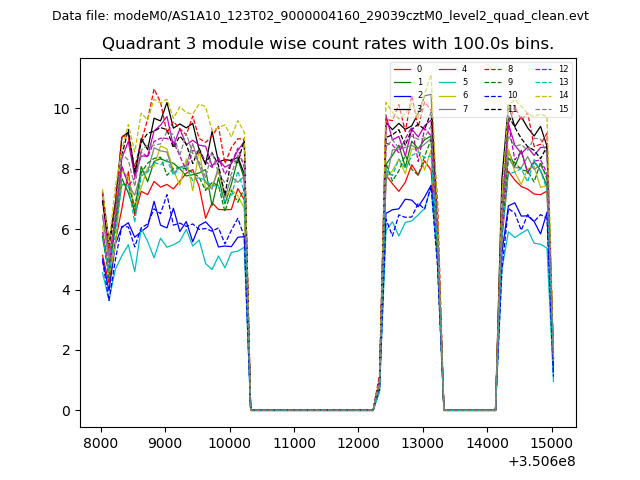
| Module-wise count rates for Quadrant D Data is divided into 100 sec bins |
 |
 |
| Parameter | Plot |
|---|---|
| CZT HV Monitor | 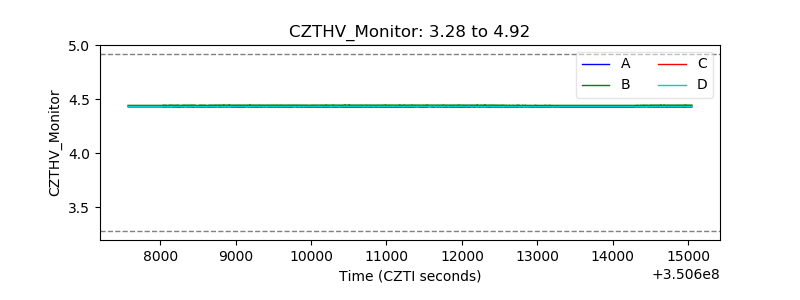 |
| D_VDD | 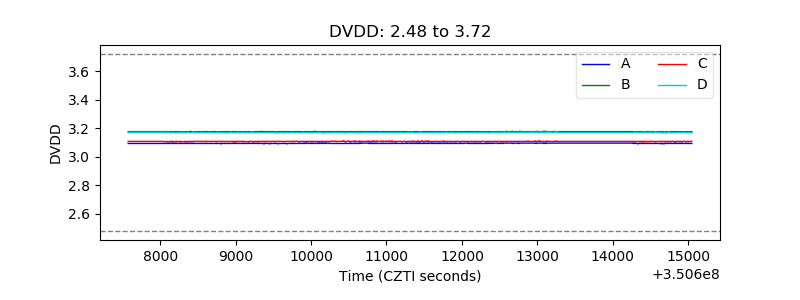 |
| Temperature 1 | 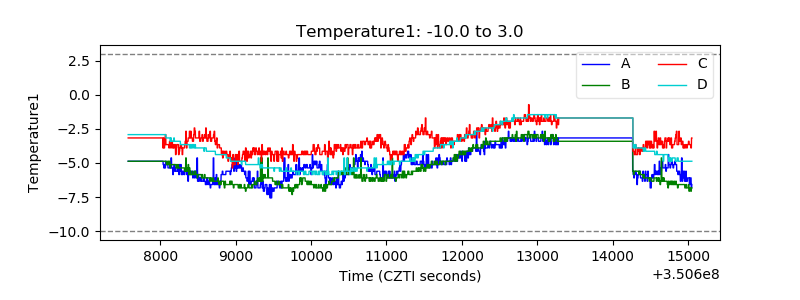 |
| Veto HV Monitor | 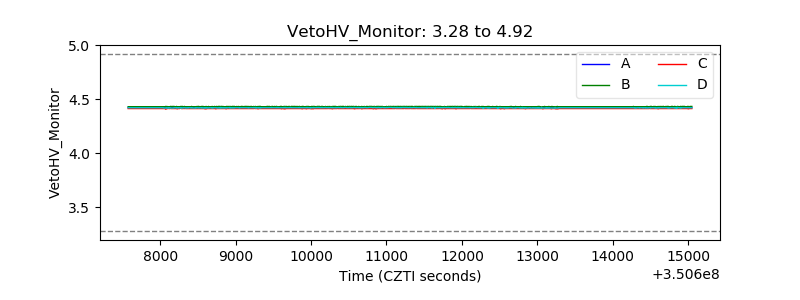 |
| Veto LLD | 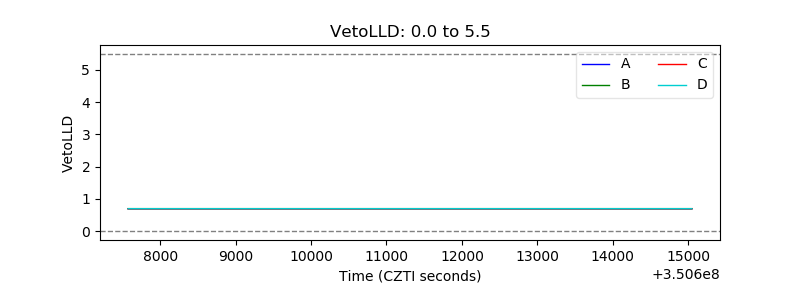 |
| Alpha Counter | 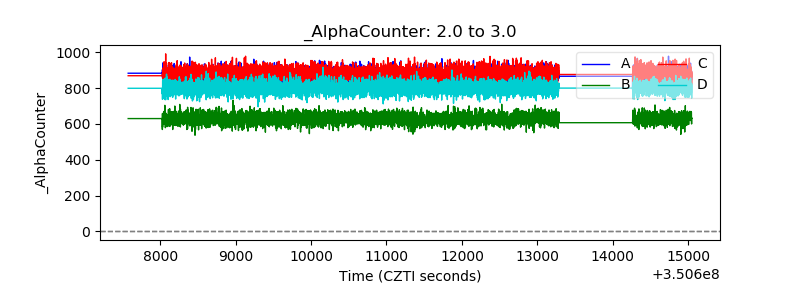 |
| _CPM_Rate | 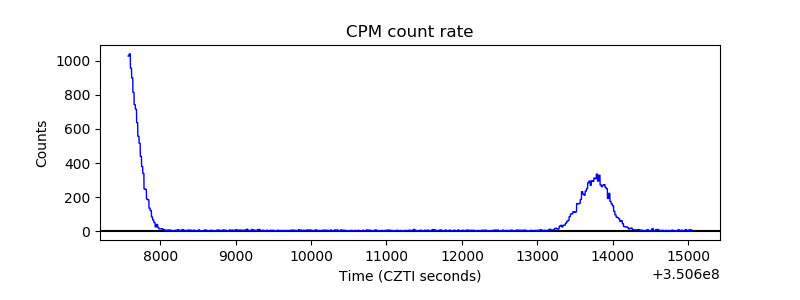 |
| CZT Counter | 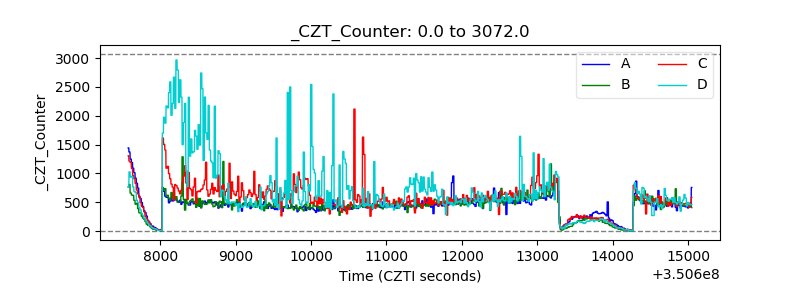 |
| +2.5 Volts monitor |  |
| +5 Volts monitor |  |
| _ROLL_ROT | 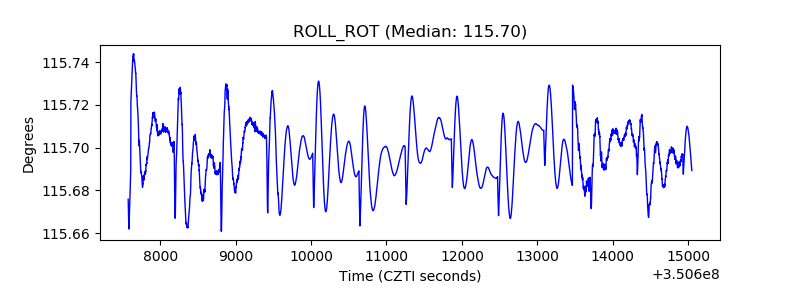 |
| _Roll_DEC | 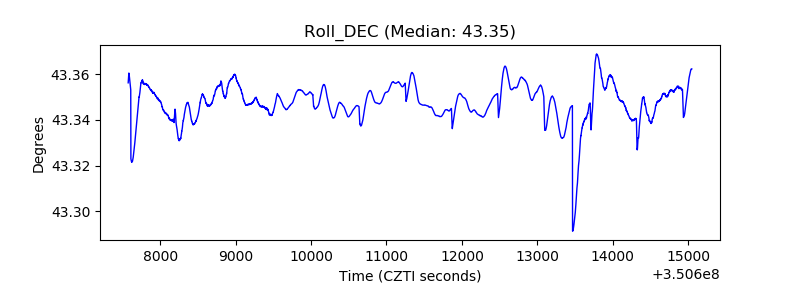 |
| _Roll_RA | 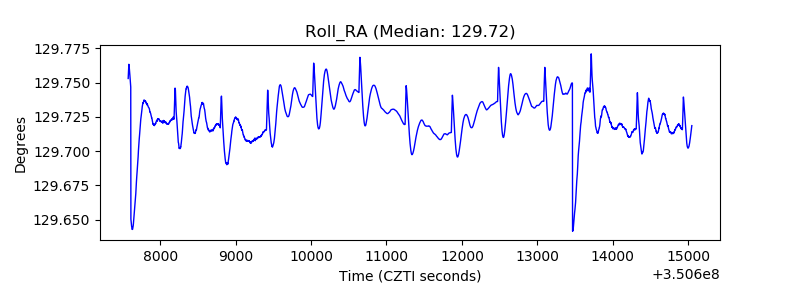 |
| Veto Counter | 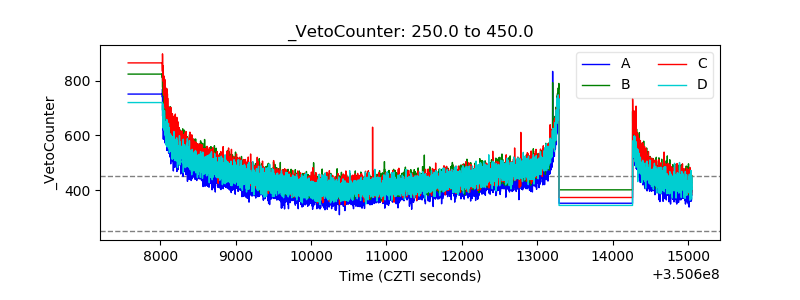 |