| Param | Original file | Final file |
|---|---|---|
| Filename | modeM0/AS1C05_019T04_9000004162cztM0_level2.fits | modeM0/AS1C05_019T04_9000004162cztM0_level2_quad_clean.evt |
| Size (bytes) | 994,985,280 | 1,107,057,600 |
| Size | 948.9 MB | 1.0 GB |
| Events in quadrant A | 6,114,082 | 6,897,135 |
| Events in quadrant B | 5,850,118 | 6,948,919 |
| Events in quadrant C | 6,022,656 | 6,695,051 |
| Events in quadrant D | 5,155,870 | 5,999,665 |
| Mode SS | |||
|---|---|---|---|
| Quadrant | BADHDUFLAG | Total packets | Discarded packets |
| A | 0 | 2078 | 0 |
| B | 0 | 2078 | 0 |
| C | 0 | 2078 | 0 |
| D | 0 | 2078 | 0 |
| Mode M9 | |||
|---|---|---|---|
| Quadrant | BADHDUFLAG | Total packets | Discarded packets |
| A | 0 | 131 | 0 |
| B | 0 | 131 | 0 |
| C | 0 | 131 | 0 |
| D | 0 | 131 | 0 |
| Mode M0 | |||
|---|---|---|---|
| Quadrant | BADHDUFLAG | Total packets | Discarded packets |
| A | 0 | 211987 | 0 |
| B | 0 | 218657 | 0 |
| C | 0 | 215764 | 0 |
| D | 0 | 293844 | 0 |
| Quadrant | Total seconds | Saturated seconds | Saturation percentage |
|---|---|---|---|
| A | 101981 | 1083 | 1.061963% |
| B | 101981 | 1673 | 1.640502% |
| C | 101981 | 1899 | 1.862112% |
| D | 101981 | 5196 | 5.095067% |
Noise dominated data is calculated using 1-second bins in cleaned event files. If a bin has >2000 counts, and if more than 50% of those come from <1% of pixels, then it is considered to be noise-dominated and hence unusable.
| Quadrant | # 1 sec bins | Bins with >0 counts | Bins with >2000 counts | High rate bins dominated by noise | Noise dominated (total time) | Noise dominated (detector-on time) | Marked lightcurve |
|---|---|---|---|---|---|---|---|
| A | 114900 | 101962 | 0 | 0 | 0.00% | 0.00% |  |
| B | 114900 | 101961 | 0 | 0 | 0.00% | 0.00% | 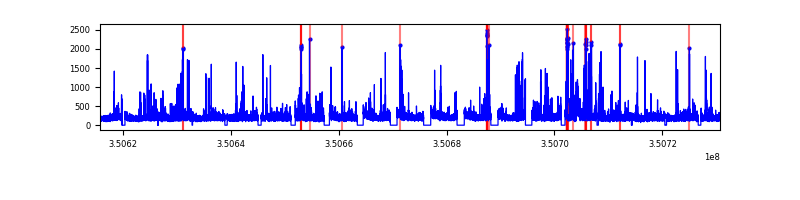 |
| C | 114900 | 101950 | 0 | 0 | 0.00% | 0.00% |  |
| D | 114900 | 101862 | 0 | 0 | 0.00% | 0.00% | 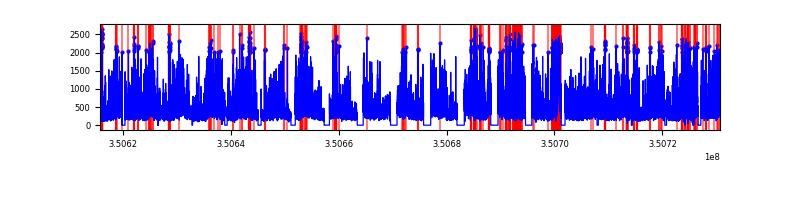 |
Top three noisy pixels from each quadrant. If the there are fewer than three noisy pixels in the level2.evt file, extra rows are filled as -1
| Pixel properties | Quadrant properties | ||||||
|---|---|---|---|---|---|---|---|
| Quadrant | DetID | PixID | Counts | Sigma | Mean | Median | Sigma |
| A | 0 | 29 | 6022 | 11.63 | 1592 | 1499 | 389.0 |
| A | 7 | 110 | 4845 | 8.6 | 1592 | 1499 | 389.0 |
| A | 0 | 30 | 4734 | 8.32 | 1592 | 1499 | 389.0 |
| B | 2 | 9 | 4907 | 11.4 | 1549 | 1482 | 300.4 |
| B | 2 | 8 | 3907 | 8.07 | 1549 | 1482 | 300.4 |
| B | 5 | 128 | 3882 | 7.99 | 1549 | 1482 | 300.4 |
| C | 12 | 241 | 4221 | 6.84 | 1592 | 1495 | 398.7 |
| C | 3 | 187 | 4027 | 6.35 | 1592 | 1495 | 398.7 |
| C | 2 | 191 | 3992 | 6.26 | 1592 | 1495 | 398.7 |
| D | 15 | 46 | 3988 | 6.78 | 1472 | 1346 | 389.5 |
| D | 4 | 246 | 3866 | 6.47 | 1472 | 1346 | 389.5 |
| D | 10 | 189 | 3727 | 6.11 | 1472 | 1346 | 389.5 |
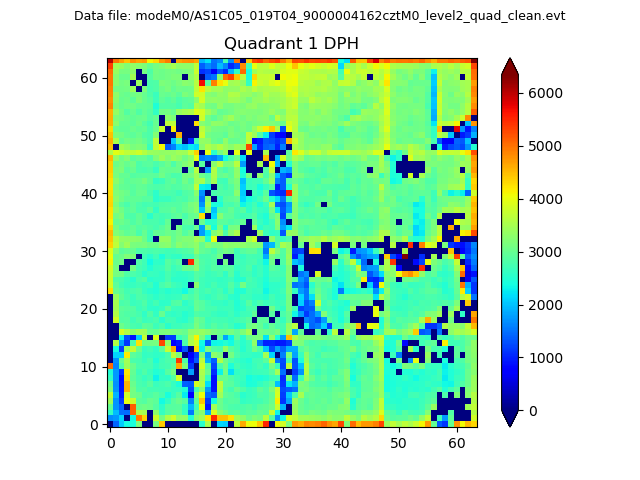
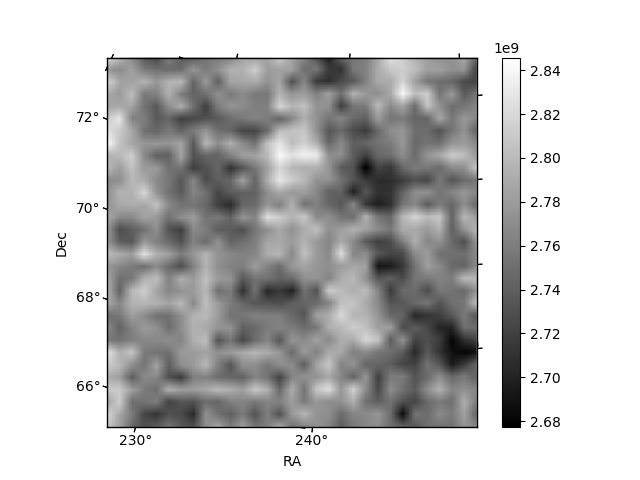
Histogram calculated using DETX and DETY for each event in the final _common_clean file
| Quadrant A |  |
 |
Quadrant B |
|---|---|---|---|
| Quadrant D |  |
 |
Quadrant C |
| Plot type | Count rate plots | Images |
|---|---|---|
| Comparison with Poisson distribution Blue bars denote a histogram of data divided into 1 sec bins. Red curve is a Poisson curve with rate = median count rate of data. |
 |
 |
| Quadrant-wise count rates Data is divided into 100 sec bins |
 |
|
| Module-wise count rates for Quadrant A Data is divided into 100 sec bins |
 |
 |
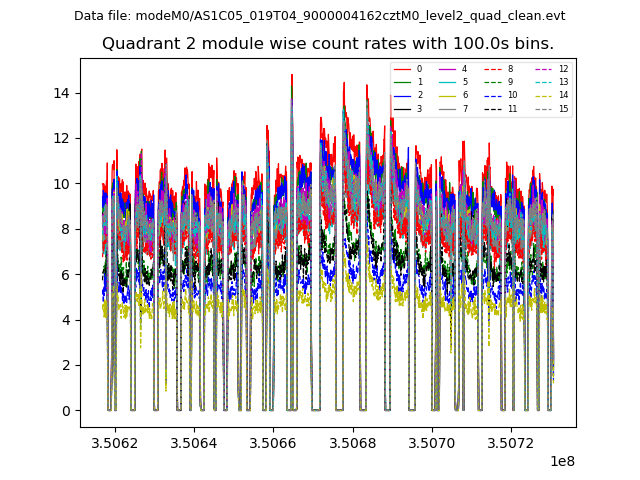
| Module-wise count rates for Quadrant B Data is divided into 100 sec bins |
 |
 |
| Module-wise count rates for Quadrant C Data is divided into 100 sec bins |
 |
 |
| Module-wise count rates for Quadrant D Data is divided into 100 sec bins |
 |
 |
| Parameter | Plot |
|---|---|
| CZT HV Monitor |  |
| D_VDD |  |
| Temperature 1 |  |
| Veto HV Monitor | 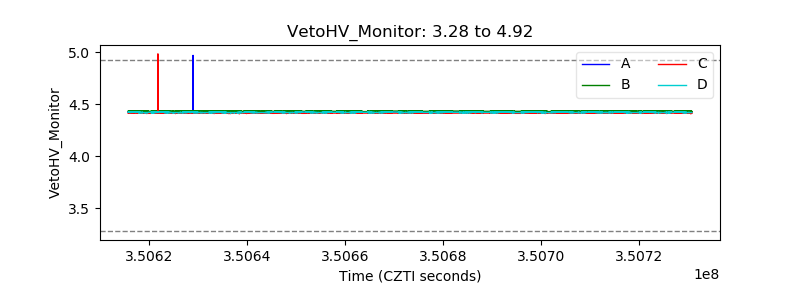 |
| Veto LLD |  |
| Alpha Counter | 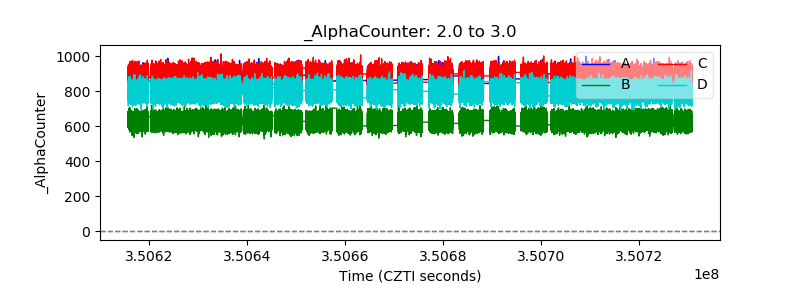 |
| _CPM_Rate | 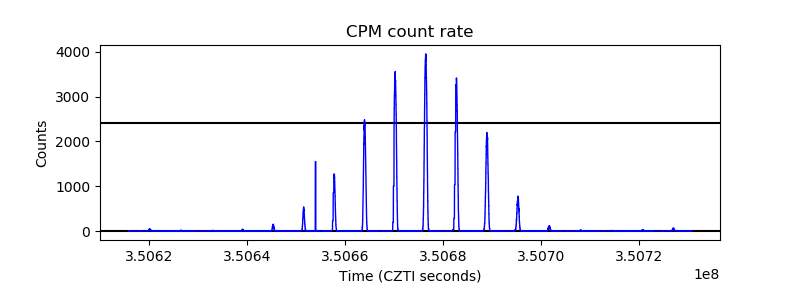 |
| CZT Counter |  |
| +2.5 Volts monitor | 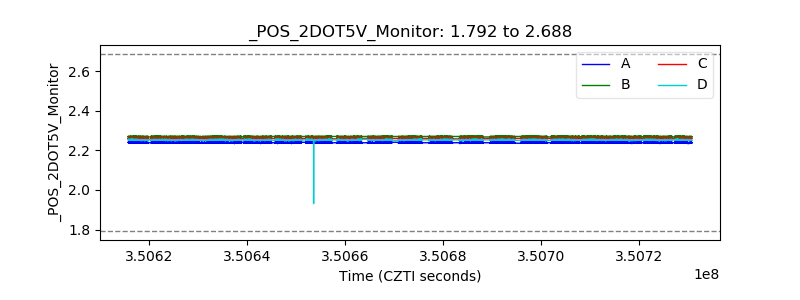 |
| +5 Volts monitor | 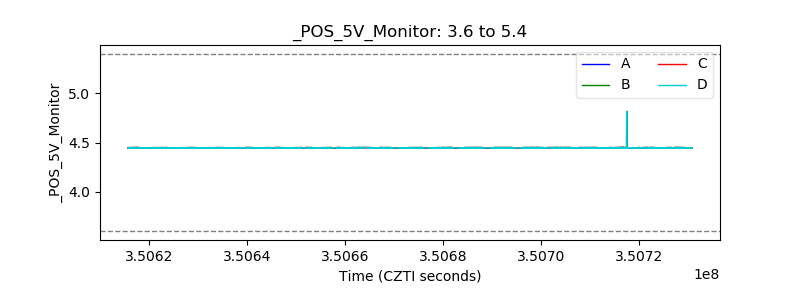 |
| _ROLL_ROT | 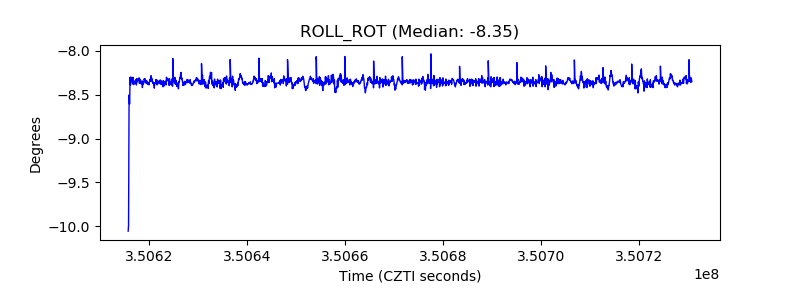 |
| _Roll_DEC | 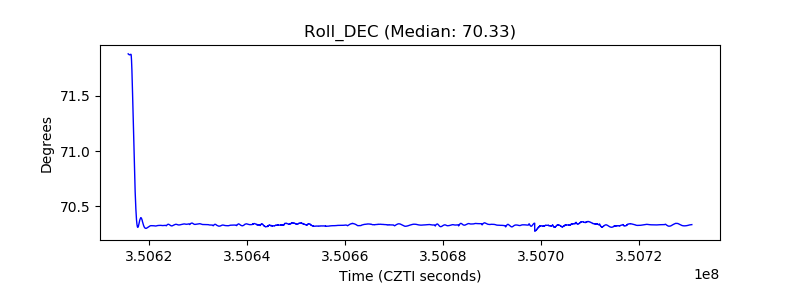 |
| _Roll_RA |  |
| Veto Counter |  |