| Param | Original file | Final file |
|---|---|---|
| Filename | modeM0/AS1C05_019T04_9000004162_29041cztM0_level2.evt | modeM0/AS1C05_019T04_9000004162_29041cztM0_level2_quad_clean.evt |
| Size (bytes) | 555,336,000 | 125,277,120 |
| Size | 529.6 MB | 119.5 MB |
| Events in quadrant A | 3,482,121 | 826,045 |
| Events in quadrant B | 3,606,882 | 842,812 |
| Events in quadrant C | 3,767,071 | 813,679 |
| Events in quadrant D | 5,447,590 | 783,756 |
| Mode SS | |||
|---|---|---|---|
| Quadrant | BADHDUFLAG | Total packets | Discarded packets |
| A | 0 | 154 | 0 |
| B | 0 | 154 | 0 |
| C | 0 | 154 | 0 |
| D | 0 | 154 | 0 |
| Mode M9 | |||
|---|---|---|---|
| Quadrant | BADHDUFLAG | Total packets | Discarded packets |
| A | 0 | 2 | 0 |
| B | 0 | 2 | 0 |
| C | 0 | 2 | 0 |
| D | 0 | 2 | 0 |
| Mode M0 | |||
|---|---|---|---|
| Quadrant | BADHDUFLAG | Total packets | Discarded packets |
| A | 0 | 15632 | 2 |
| B | 0 | 15878 | 1 |
| C | 0 | 16053 | 1 |
| D | 0 | 21319 | 1 |
| Quadrant | Total seconds | Saturated seconds | Saturation percentage |
|---|---|---|---|
| A | 7593 | 91 | 1.198472% |
| B | 7593 | 127 | 1.672593% |
| C | 7593 | 132 | 1.738443% |
| D | 7593 | 248 | 3.266166% |
Noise dominated data is calculated using 1-second bins in cleaned event files. If a bin has >2000 counts, and if more than 50% of those come from <1% of pixels, then it is considered to be noise-dominated and hence unusable.
| Quadrant | # 1 sec bins | Bins with >0 counts | Bins with >2000 counts | High rate bins dominated by noise | Noise dominated (total time) | Noise dominated (detector-on time) | Marked lightcurve |
|---|---|---|---|---|---|---|---|
| A | 7678 | 7593 | 0 | 0 | 0.00% | 0.00% | 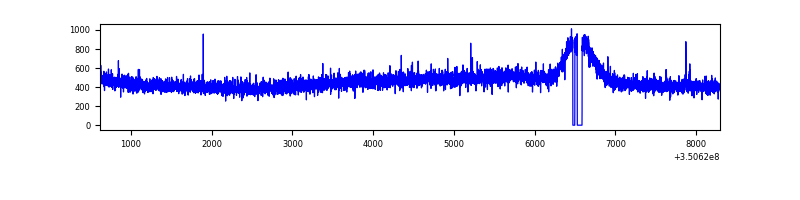 |
| B | 7678 | 7595 | 4 | 4 | 0.05% | 0.05% | 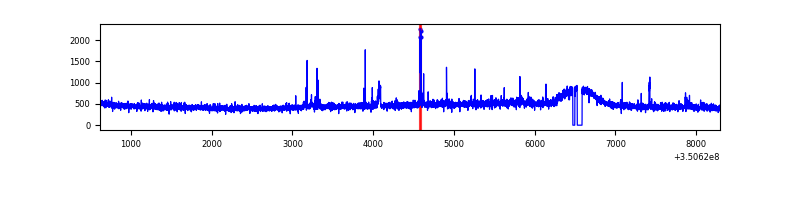 |
| C | 7678 | 7595 | 0 | 0 | 0.00% | 0.00% | 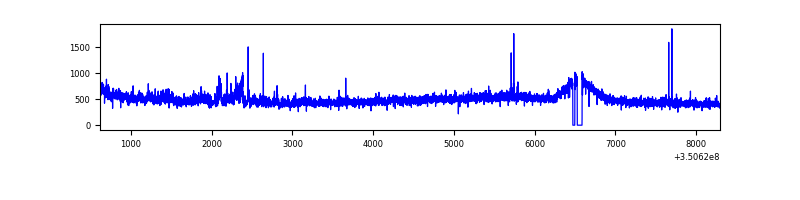 |
| D | 7678 | 7595 | 164 | 164 | 2.14% | 2.16% | 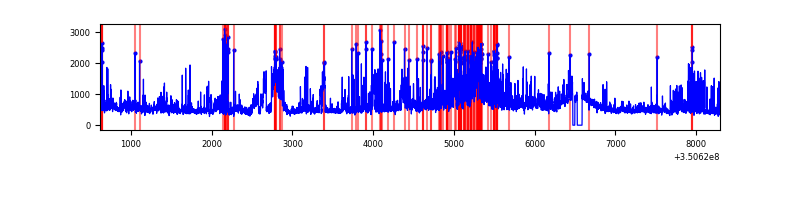 |
Top three noisy pixels from each quadrant. If the there are fewer than three noisy pixels in the level2.evt file, extra rows are filled as -1
| Pixel properties | Quadrant properties | ||||||
|---|---|---|---|---|---|---|---|
| Quadrant | DetID | PixID | Counts | Sigma | Mean | Median | Sigma |
| A | 13 | 254 | 13319 | 68.24 | 900 | 878 | 182.3 |
| A | 3 | 137 | 9306 | 46.23 | 900 | 878 | 182.3 |
| A | 0 | 226 | 7703 | 37.44 | 900 | 878 | 182.3 |
| B | 0 | 190 | 27434 | 153.76 | 898 | 872 | 172.8 |
| B | 10 | 245 | 23101 | 128.67 | 898 | 872 | 172.8 |
| B | 12 | 111 | 21806 | 121.18 | 898 | 872 | 172.8 |
| C | 3 | 233 | 219563 | 1075.54 | 864 | 866 | 203.3 |
| C | 14 | 238 | 139779 | 683.17 | 864 | 866 | 203.3 |
| C | 2 | 16 | 22640 | 107.08 | 864 | 866 | 203.3 |
| D | 1 | 52 | 1426544 | 6919.0 | 861 | 834 | 206.1 |
| D | 8 | 195 | 540250 | 2617.8 | 861 | 834 | 206.1 |
| D | 2 | 250 | 197601 | 954.91 | 861 | 834 | 206.1 |
Histogram calculated using DETX and DETY for each event in the final _common_clean file
| Quadrant A | 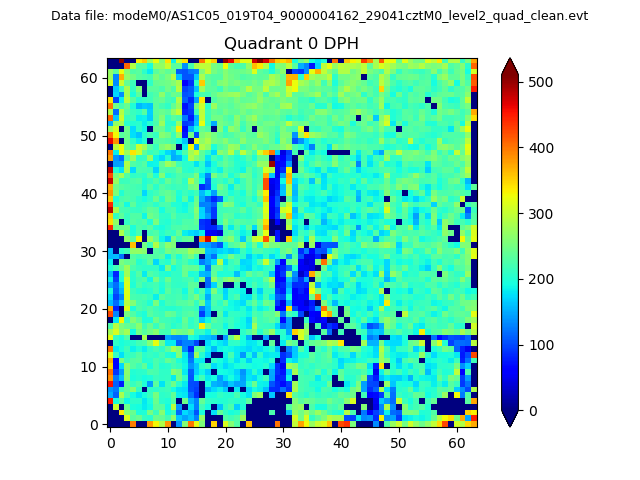 |
 |
Quadrant B |
|---|---|---|---|
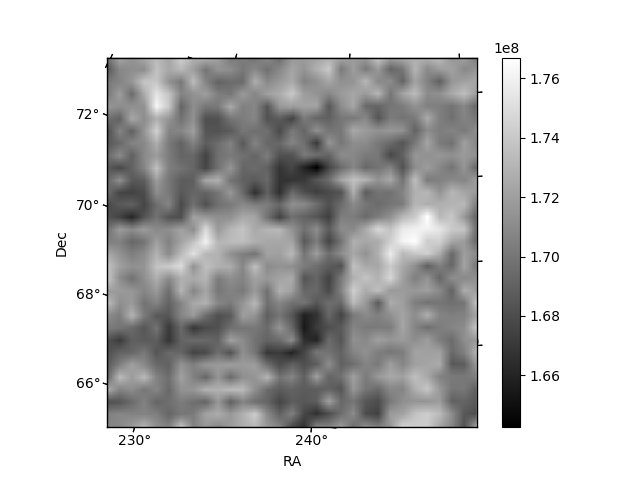
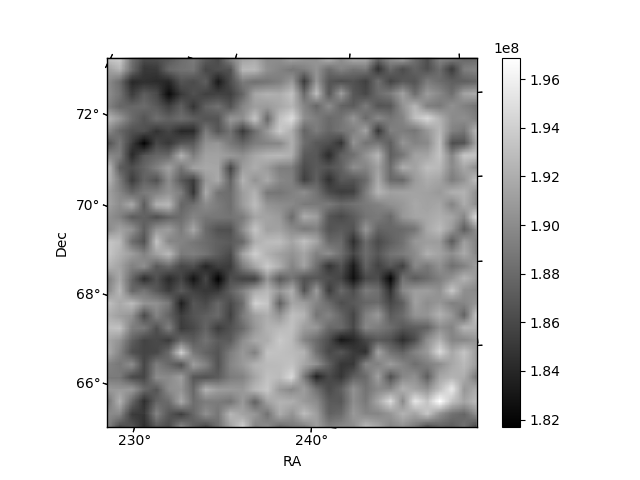
| Quadrant D | 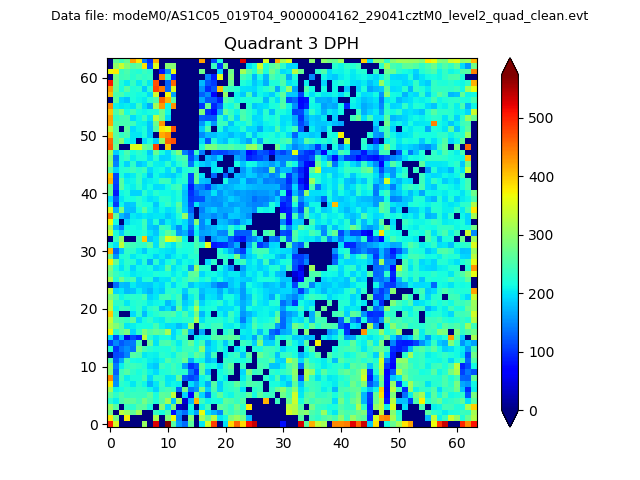 |
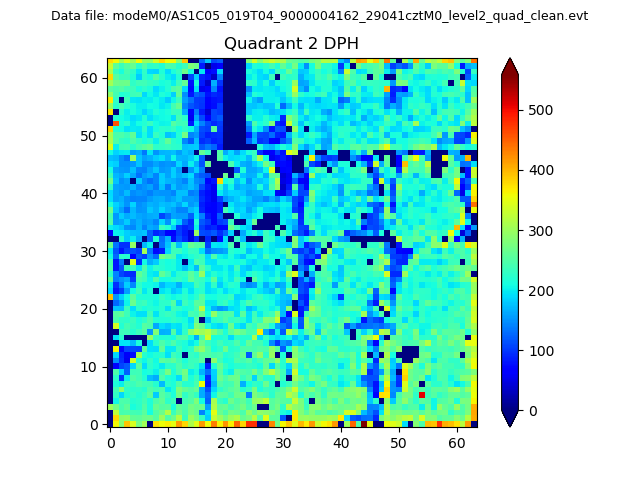 |
Quadrant C |
| Plot type | Count rate plots | Images |
|---|---|---|
| Comparison with Poisson distribution Blue bars denote a histogram of data divided into 1 sec bins. Red curve is a Poisson curve with rate = median count rate of data. |
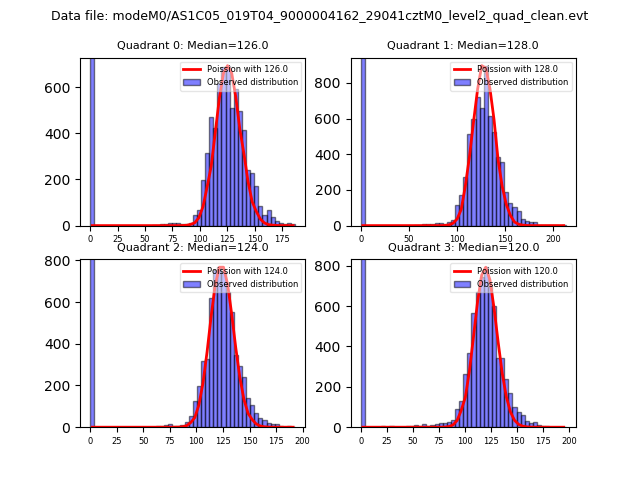 |
 |
| Quadrant-wise count rates Data is divided into 100 sec bins |
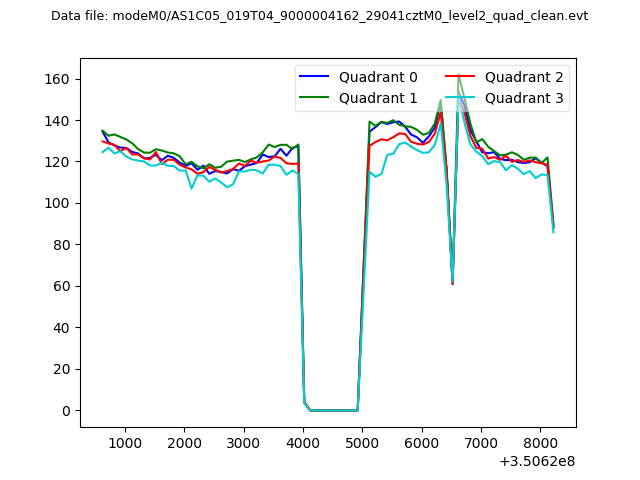 |
|
| Module-wise count rates for Quadrant A Data is divided into 100 sec bins |
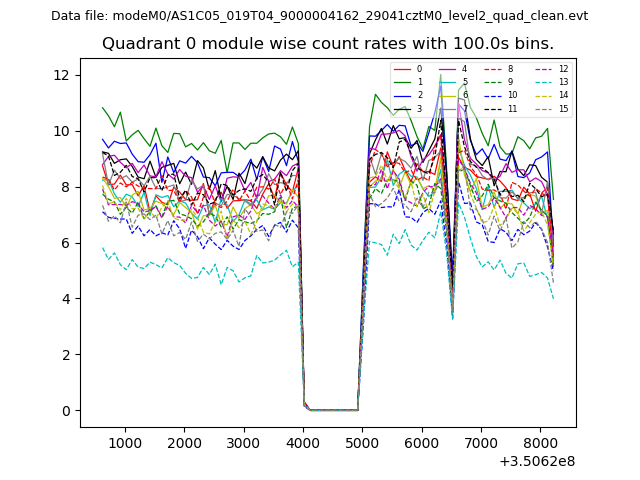 |
 |
| Module-wise count rates for Quadrant B Data is divided into 100 sec bins |
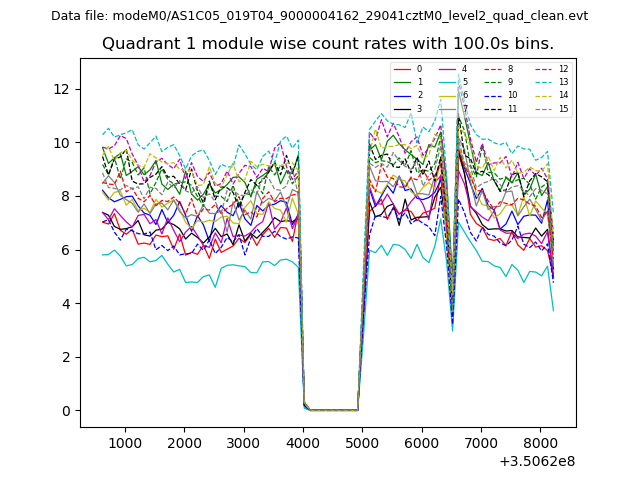 |
 |
| Module-wise count rates for Quadrant C Data is divided into 100 sec bins |
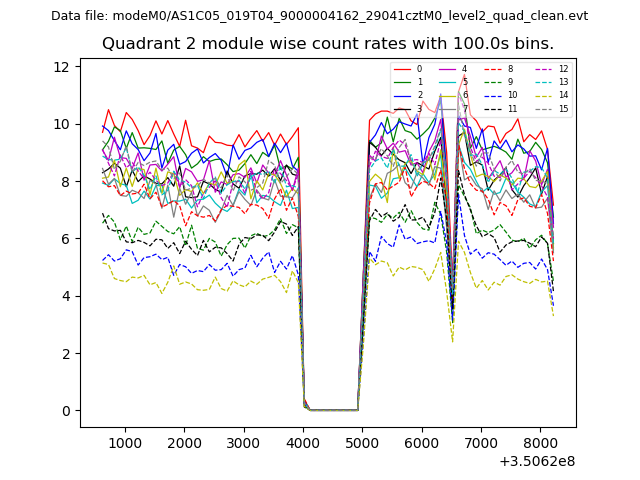 |
 |
| Module-wise count rates for Quadrant D Data is divided into 100 sec bins |
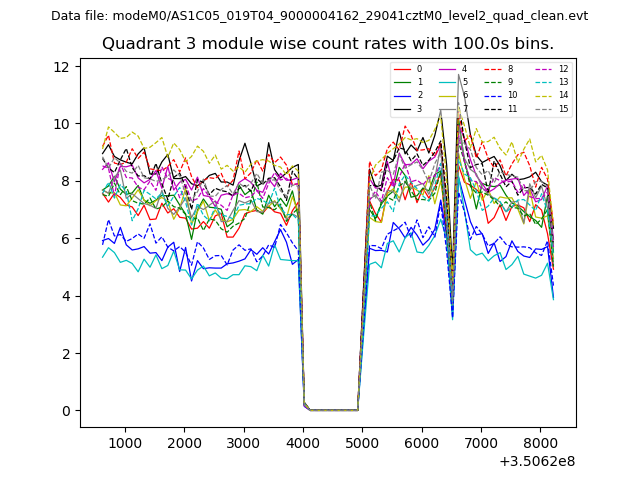 |
 |
| Parameter | Plot |
|---|---|
| CZT HV Monitor | 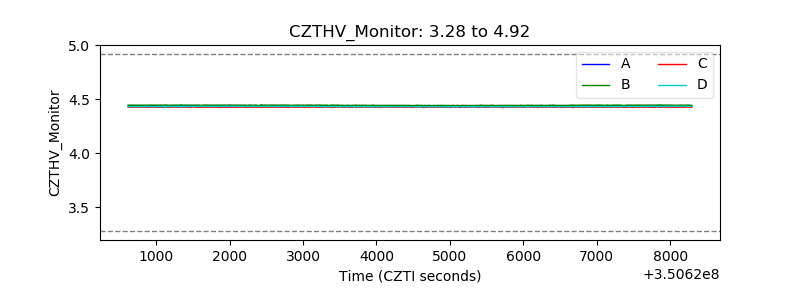 |
| D_VDD | 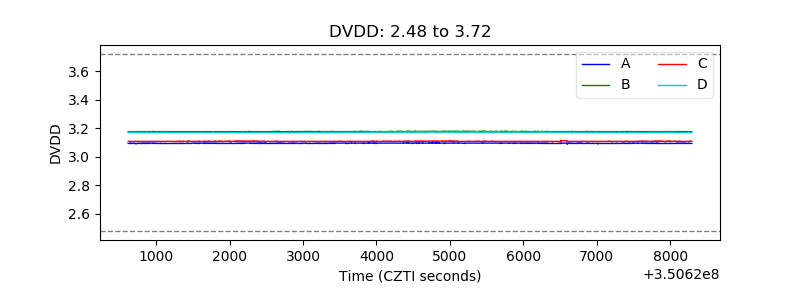 |
| Temperature 1 | 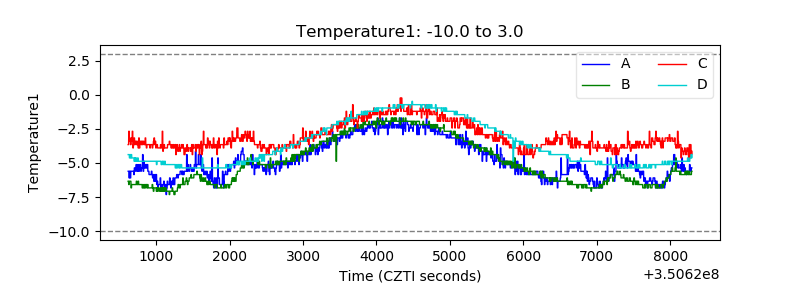 |
| Veto HV Monitor | 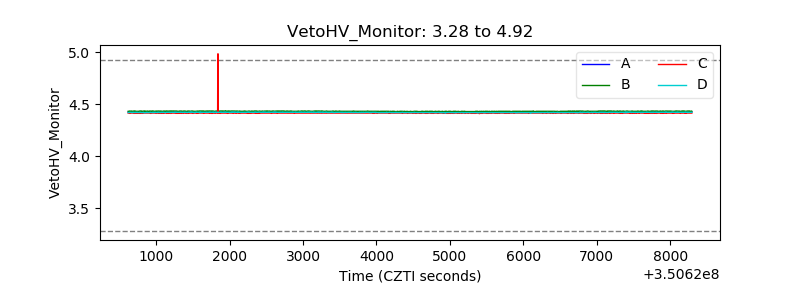 |
| Veto LLD | 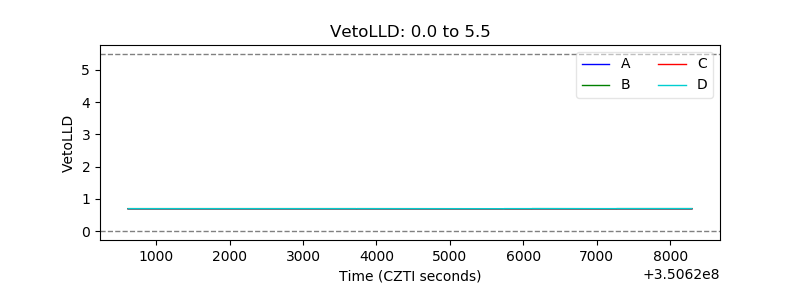 |
| Alpha Counter | 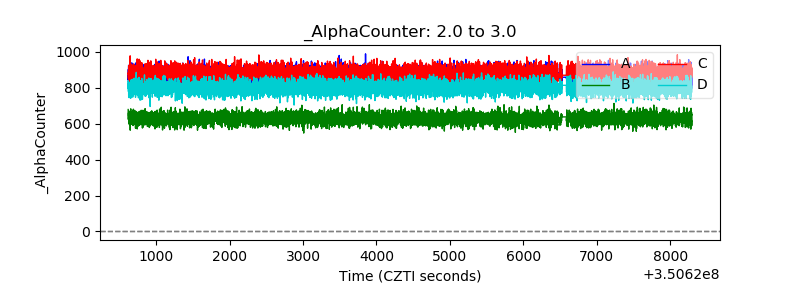 |
| _CPM_Rate | 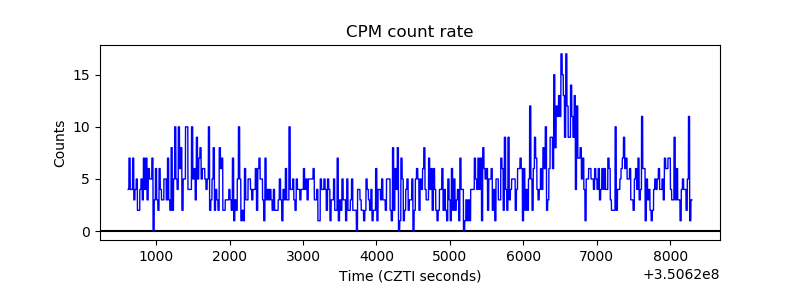 |
| CZT Counter | 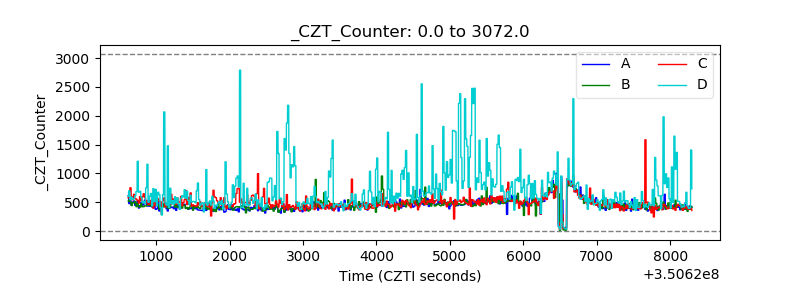 |
| +2.5 Volts monitor |  |
| +5 Volts monitor |  |
| _ROLL_ROT | 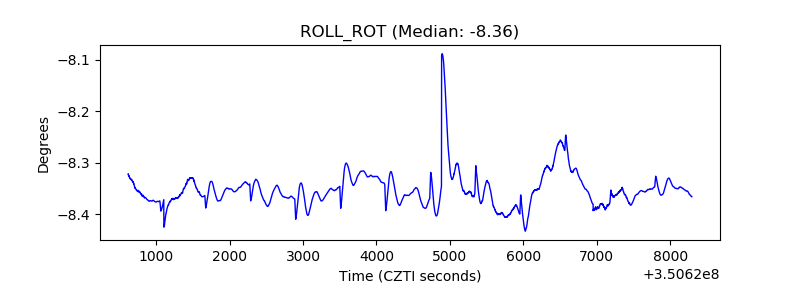 |
| _Roll_DEC | 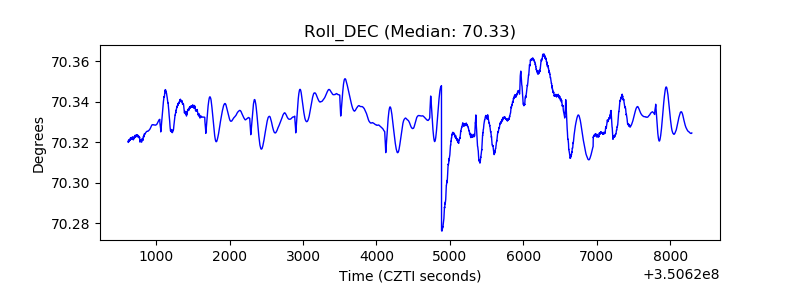 |
| _Roll_RA | 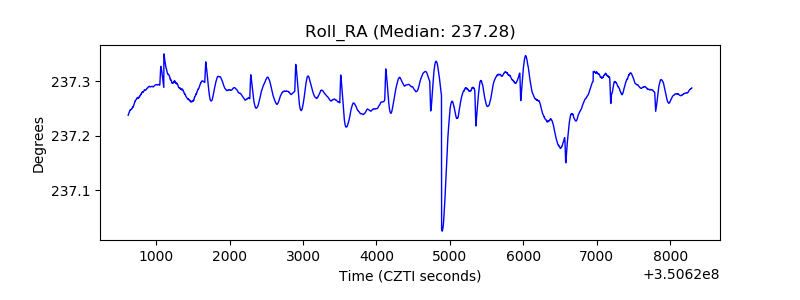 |
| Veto Counter | 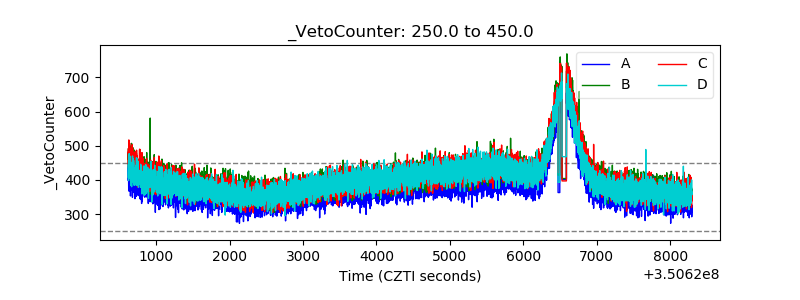 |